Revue Roumaine de Chimie, 2006, 51(9), 877–886
SYNTHESIS AND CHARACTERIZATION OF MIXED-LYGAND COMPLEXES OF Cr(III), Fe(III) AND Zr(IV) IONS WITH UREA AND ORGANIC LIGANDS
Neculai FOCAa and Gabriela LISAb∗ a
“Gh. Asachi” Technical University, Faculty of Industrial Chemistry, Department of Inorganic Chemistry, 71Mangeron Street, Iasi, 700050, Roumania b “Gh. Asachi” Technical University, Faculty of Industrial Chemistry, Department of Physical Chemistry, 71Mangeron Street, Iasi, 700050, Roumania
Received May 5, 2005
This work presents our data obtained as the result of a study concerning the synthesis and physical chemical characterization of certain mixed compounds of Cr(III), Fe(III) and Zr(IV) with urea and {3-[(4-Chloro-phenyl)-(2Hpyridin-1-yl)-methyl]-2,4-dihydroxy-phenyl}-phenyl-methanone with empirical formula C25H20ClNO3 and denoted as L. This ligand was synthesized using as starting material a hydroxybenzophenone. The synthesis of these metallic compounds was accomplished by using the melted urea as reaction medium. The mixed complexes of Cr(III), Fe(III) and Zr(IV) with urea and L separated in solid state were purified, dried and analyzed by chemical analysis, X-ray spectroscopy, X-ray diffraction and thermal analysis. From the obtained data concerning thermal behavior of the studied compounds, the most important kinetic parameters, were determined, namely: the reaction order, the activation energy and the pre-exponential factor.
INTRODUCTION The ligand L used in the synthesis of the mixed compounds of Cr(III), Fe(III) and Zr(IV), has as basic nucleus the hydroxybenzophenone with the structure:
HO N
CH
HO O Cl
{3-[(4-Chloro-phenyl)-(2H-pyridin-1-yl)-methyl]-2,4-dihydroxy-phenyl}-phenyl-methanone
This ligand was synthesized starting from a hydroxybenzophenone.1 After its synthesis and purification, a series of its physical constants such as: molecular mass, melting point and solubility has been ∗
Corresponding author: e-mail:
[email protected]
878
Neculai Foca and Gabriela Lisa
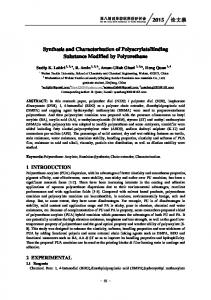
determined in various organic solvents or solvent mixtures: D.M.F-Ethanol-Urea. At the same time, its behavior towards a series of metallic cations in melted urea was followed. It has been found that its highest reactivity is in melted urea, which later was used as a reaction medium in the synthesis of a number of mixed compounds: M-L-urea, were M = Cr(III), Fe(III) and Zr(IV). We specify that the melted urea is a very good reaction medium, which can serve to prepare a large number of compounds with different organic ligands.2-5 EXPERIMENTAL The reaction between the Cr(III), Fe(III) and Zr(IV) ions can be analyzed both in solution, using solvent mixture, for example D.M.F.(1p) – ethanol (4p) – urea, and in melted urea.1 The M-L compounds can be formed in solution, but they are difficult to separate in solid state. The solid state separation of the mixed compounds of Cr(III), Fe(III) and Zr(IV) with urea and the ligand L occurs with very good results if one uses melted urea as reaction medium. The urea, which is used as both reaction medium and reagent, was introduced in porcelain crucibles and heated on oil bath. The temperature was kept under control between 160-165ºC, below the decomposition temperature of urea, which is of 182.5ºC. After the melting of urea, the corresponding chlorides (Merck reagents) of these cations: CrCl3⋅6H2O, FeCl3⋅6H2O and ZrCl4⋅H2O were added. The heating continues at 165°C for two more hours until no gases or steams are emitted. After cooling, the samples were washed with DMF in order to remove the urea excess, and subsequently the obtained compounds, [Cr(urea)6]Cl3, [Fe(urea)6]Cl3 and [Zr(urea)6]Cl4, were separated. After separation, the [M(urea)6]n+ complexes were dried and used for the synthesis of the mixed complexes M-Urea-L. For this, the [M(urea)]n+ compounds were melted again, and small amounts of ligand L were added step by step. The heating goes on for 1.5 h more until the reaction is completed, i.e. no gas (HCl) emission is noticed. After cooling, the complexes were washed with small amounts of water and ethanol and dried on CaCl2 until the mass remains constant. The dried compounds have been chemically analysed in order to establish their molecular formulas. The Cr3+, Fe3+ and Zr4+ contents were determined by atomic absorption spectroscopy AAS, redox potentiometry and gravimetric analyses.6-8 The obtained data are listed in Table 1. The study of the reaction between L and Fe(III) ions The reaction between the L and the Fe(III) ions was studied in solution, using as reaction medium the system: D.M.F. (1p) – C2H5OH (4p) – urea. This system was studied at the above mentioned (table 6) wavelengths in order to determine the Fe(III) – L combination ratio and the formed species within the system: Fe(III) – D.M.F. (1p) – Ethanol (4p). By using a series of spectrophotometric methods, the composition of the system Fe(III) – L was determined.6-9 The obtained data are given in Figs 1-3. [Fe3+], 2. 10-3 M; [L], 2. 10-3 M 0.6 0.5
A
0.4 0.3 0.2 0.1 0 0
0.5
1
1.5
2
2.5
-6
mol L /mol Fe(III)x10 530 nm
573 nm
Fig. 1 – Data obtained from the study of Fe (III) – L system, by the method of molar ratios: [Fe3+]=2⋅10-3M; [L] = 2⋅10-3M.
Mixed-ligand complexes of Cr(III), Fe(III), Zr(IV)
879
The compounds resulted from the reaction between Fe(III) and L present two well – marked spectral maximal in the visible range at 530 and 573 nm respectively.
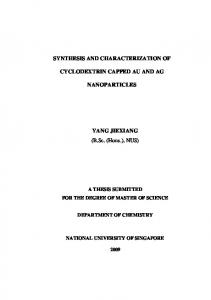
[Fe3+], 2.10-5 M; [L], 2.10-3 M 1.6 1.4 1.2
A
1 0.8 0.6 0.4 0.2 0 0
5
10
mol L /mol Fe(III)x10 mol Fe(III) variable
15
-6
mol L variable
Fig. 2 – The composition of the complexes belonging to the Fe(III) – L system, established by the method angular coefficients
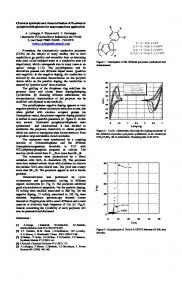
[Fe3+], 4.10-3 M (0- 20x10-6 mol); [L] 4.10-3 M (20x10-6- 0 mol)
0.8 0.7 0.6 A
0.5 0.4 0.3 0.2 0.1 0 0
5
10 mol L /mol Fe (III) x 10
15
20
-6
Fig. 3 – Curves obtained by studying the system composition using the continuous variations method.
The analysis of the obtained data by the three spectrophotometric methods confirms that, as the result of the reaction of the Fe(III) ions with L in solution, the prevailing compound formed has the ratio 1M:2L, and it is obviously, the most stable. Thus, at pH = 3.60 the red complex species [Fe(L)2]+, is rendered evident. The molar absorption coefficient was calculated for this compound: ε = 3.62⋅103 l⋅Mol-1⋅cm-1.
880
Neculai Foca and Gabriela Lisa
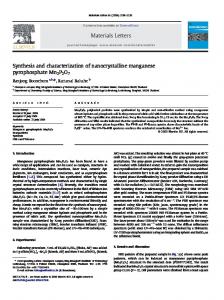
The determination of the global stability factor, β, of the [Fe(L)2]+ compound By applying the Harvey – Manning method, the global stability factor constant β (Figure 4), was determined for the formation of the complex species [Fe(L)2]+. 9 [Fe3+], 4.10-4 M; [L], 8.10-4 M 0.6 0.5
A
0.4 0.3 0.2 0.1 0 0
5
10
15
20
25
mol L / mol Fe(III)x10
30
35
-6
Fig. 4 – The determination of stability factor β, for the [Fe(L)2]+ compound (λ = 530 nm)
Taking into account the global reaction occurring in this system, namely:
nFe3+ + mL ⇔ (Fen Lm )
(3 n − m )+
[(Fe L )
(3 n − m )+
were:
n
m
C ]= Am ⋅ [ As n
Fe 3+
] and Am is the absorbance value with ligand in excess, were it is
assumed that all the Fe (III) amount changes into [Fe(L)2]+ = CM; As is the system absorbance for L/M = 2. Based on the obtained experimental data, the value of the global stability factor constant was calculated by using the relation:
β=
[
[Fen Lm ](3n − m )
] ( n
+
[
(3 n − m )+ (3 n − m )+ C 3+ − n ⋅ (Fen Lm ) ⋅ CL − m ⋅ (Fen Lm ) Fe
])
m
By replacing the concentration for the reactants: [Fe3+] = 2⋅10-4 M⋅L-1; [L] = 4⋅10-4 M⋅L-1 and that of the compound formed within the system, the global constant of formation was determined as: β = 4.21⋅109 L2 Mol-2. The value of the constant β shows that the complex ion has a greater stability. Separation of M-L complexes in solid urea The mixed compounds M-L-Urea, were dissociated in solid state using as a reaction medium, the urea.
9,
The applied method was described in a previous work, which presented data concerning the reaction between the ions of Cr(III), Fe(III) and Zr(IV) with (2-hydroxy-4-methoxy-phenyl)-phenyl-methanone – C14H12O3, denoted by (L1).10 By applying the same working technique and thoroughly obeying the reaction conditions, the complex compounds of Cr(III), Fe(III) and Zr(IV) with urea and L were separated. After drying them in exicator on
Mixed-ligand complexes of Cr(III), Fe(III), Zr(IV)
881
siccative CaCl2 to a constant mass, the compounds were chemically analyzed with the view to establish their molecular formulas. The Cr3+, Fe3+ and Zr4+ contents where determined by atomic absorption spectroscopy and redox potentiometry.11-13 The data for the chemical analysis of the studied complex are given in Table 1 Table 1 The chemical composition of the mixed complex compounds Cr(III), Fe(III) and Zr(IV) with urea and the ligand L Elemental analysis Compounds [Cr(Urea)6]Cl3 [Cr(L)(H2O)(Urea)3]Cl2 [Fe(Urea)6]Cl3 [Fe2(L)2(Urea)]Cl4 [Zr(Urea)6]Cl4 [Zr2(L)(Urea)4Cl2]Cl4
M% 10.00 7.00 10.70 9.83 15.38 17.32
C% 13.90 45.5 13.80 53.95 12.13 33.07
Theoretical H% 4.70 4.63 4.63 3.96 4.08 3.44
N% 32.40 13.26 32.14 3.67 28.32 11.96
Cl% 20.53 14.40 20.37 18.73 23.90 23.56
M% 9.35 6.58 9.80 9.02 14.54 16.42
C% 13.20 44.25 12.42 53.20 11.62 32.30
Experimental H% N% 3.95 31.60 3.80 12.35 3.96 31.56 3.15 2.95 3.40 27.45 2.85 11.20
Cl% 19.36 13.42 19.40 17.30 23.20 22.65
After dissociation and purification, the melting point and the solubility of these complexes in solvents or solvents mixtures were determined. It has been experimentally found that these complex compounds are especially soluble in organic solvents or in their mixtures. Table 2 presents the proposed chemical formulas for these complex compounds, as well as certain of their experimentally determined physical-chemical characteristics. Table 2 The proposed chemical formulas and some physical characteristics of the synthesized complexes Nr.
Chemical compound
Melting Point
The colors of compounds
1 1’ 2
[Cr(Urea)6]Cl3 [Cr(L)(H2O)(Urea)3]Cl2 [Fe(Urea)6]Cl3
72-74 139-142 97-98
gray-greenish dark-green scarlet-brown
2’
[Fe2(L)2(Urea)]Cl4
128-130
brown
3 3’
[Zr(Urea)6]Cl4 [Zr2(L)(Urea)4Cl2]Cl4
94-96 182-184
yellow-gray light-brown
The solvent in witch they are soluble H2O, C2H5OH D.M.F, C2H5OH H2O, C2H5OH D.M.F., C6H6, CO(CH3)2 H2O, C2H5OH D.M.F., C6H6
RESULTS AND DISCUSSION Thermal analysis The thermal stability of L (sample 4) and its complex compounds with the Cr(III) (sample 1), Fe(III) (sample 2) and Zr(IV) (sample 3) has been investigated by thermogravimetric analysis under dynamic conditions of temperature. The experimental measurements were performed with a thermal balance type Paulik-Paulik-Erdey (MOM. Budapest) under the following conditions: mw = 48±2 mg, reference material Al2O3, quartz crucible, heating rate 8, 10 and 12°C/min, in air, at temperatures ranging from 0°C to 900°C. The experimental results revealed that the degradation occurred in multiple stages, following a complex mechanism. For each stage the kinetic parameters and the thermogravimetric characteristics have been estimated (Table 3). According to the data from Table 3, the thermal stability of the analyzed complexes, estimated by means of the starting temperature of the decomposition process, decreases as follows: L > [Cr(L)(H2O)(Urea)3]Cl2 >[Zr2(L)(Urea)4Cl2]Cl4 ≥ [Fe2(L)2(Urea)]Cl4
882
Neculai Foca and Gabriela Lisa
In all cases an amount of solid residue that ranges between 14 and 29% remains after degradation. Taking into account the importance of the isoconversional methods in the thermal analysis,14,15 we have performed the kinetic calculations by means of the method proposed by Vyazovkin and co-workers.16,17 The dependence of the apparent activation energy, Ea, on the reacted fraction, w, is plotted in Figures 5-7 The models of the decomposition processes for every step, f(w) and the pre-exponential factor, log A, are listed in Table 4. The apparent activation energy depends on the reacted fraction, w, revealing the complexity of thermal degradation.18 Table 5 presents other kinetic characteristics determined for the analyzed sample: the rate constant corresponding to the maximum degradation speed (kmax) and the critical (isokinetic) (Tcr). These were calculated by applying the relations deducted by Gorbachev.19,20 By comparing Tcr and Tmax, one can see that they have close values. The different values of the rate constants for the same thermal degradation stage suggest that the thermal degradation of the analyzed samples occurs by different mechanisms, except for the last stage in the case of samples 1, 2 and 4.
280
Ea (kJ/mol)
260 240 220 200 180 160 140 0
0.2
0.4
0.6
0.8
1
w sample 1 sample 3
sample 2 sample 4
Fig. 5 – The apparent activation energy as a function of the reacted fraction for the first stage of the decomposition process
430 410
Ea (kJ/mol)
390 370 350 330 310 290 270 250 230 0
0.2
0.4
0.6
0.8
1
w sample 1
sample 2
sample 3
sample 4
Fig. 6 – The apparent activation energy as a function of the reacted fraction for the second stage of the decomposition process
Mixed-ligand complexes of Cr(III), Fe(III), Zr(IV)
883
870
Ea (kJ/mol)
770 670 570 470 370 0
0.2
0.4
0.6
0.8
1
w sample 1
sample 2
sample 4
Fig. 7 – The apparent activation energy as a function of the reacted fraction for the third stage of the decomposition process
The IR absorption spectra The synthesized complexes were also analyzed based on their I.R absorption spectra. With this aim in view, the I.R absorption spectra were recorder for the complex compounds: M-L-Urea of the urea and the ligand L, by mean UNICAM spectrometer, within the frequency range 400…4000 cm-1 (Table 6). The data presented in Table 6 permit an analysis of the modifications occurring at the frequencies characteristic to the functional group of the ligand (L). Based on the occurred modifications, one can draw certain conclusion regarding the reaction of the ligand L with the cations: Cr(III), Fe(III) and Zr(IV).21,22 Comparing the specters I.R. of the free ligand (L) and of the complexed ligand (M-L) (Table 6), we notice that the main changes occur in the absorption area of the groupings OH and C=O, which shows that the ligand coordination is made by the two functional electron-donor groupings.
X – ray diffraction spectra The structure of Cr(III), Fe(III) and Zr(IV) complex compounds and that of the ligand L2: C25H20ClNO3 have been also analyzed, based on the X-ray diffraction spectra in powder. The records were made by means of a Simens D⋅500 diffractometer with Nickel filter.23-25 The diffractograms have been recorded by using the Cu-Kα radiation within 2-80°C range at a step of 0.1°/s. The diffractograms of the ligand L: {3-[(4-Chlorophenyl)-(2H-pyridin-1-yl)-methyl]-2,4-dihydroxy-phenyl}-phenyl-methanone, as well as these of the complex compounds of the Cr(III), Fe(III) and Zr(IV) ions with the ligand are given in Table 7. The diffractograms were indexed by means of the TROER software.26 The obtained results are given in Table 7. From the data presented in Table 7, one can notice that these complex compounds crystallize in systems with tetragonal, orthorhombic and monoclinic symmetry. At the same time, one can notice for this ligand that only the chrome compound preserves the ligand symmetry, while the iron or zirconium complex compounds have a tetragonal symmetry. The crystal parameters of L show large values of the a and b constants, which indicates that the benzene ring will preferably place within this plane. This does not occur by consideration, since the coordination is accompanied by a decrease of the crystal parameters. Except for some cases, one can notice that the values of the crystal parameters are close to each other, which corresponds to a central ion. From the analysis of the unit cell volum e variation in the case of the metallic complex compounds with L, a compression of the ligand around the central ion can be noticed, the volumes of the complex compounds being considerably smaller than those of the free ligand.
884
Neculai Foca and Gabriela Lisa
Mixed-ligand complexes of Cr(III), Fe(III), Zr(IV)
885
886
Neculai Foca and Gabriela Lisa
Table 7 Unit cell parameters of the synthesized complexes Compound L Cr-L sample 1 Fe-L sample 2 Zr-L sample 3
a(Å) 12.669
Crystalline parameters b(Å) c(Å) 15.279 9.027
∝ 90
Angles β 121.82
γ 90
Volume (Å3) 1485.00
9.103
7.755
9.020
90
127.52
90
491.28
7.948
7.948
14.622
90
90
90
923.87
5.292
6.884
5.484
90
90
90
417.36
CONCLUSIONS The mixed complexes of Cr(III), Fe(III) and Zr(IV) with urea and L separated in solid state were purified, dried and analyzed by chemical analysis, X-ray spectroscopy, X-ray diffraction and thermal analysis. REFERENCES 1. 2. 3. 4. 5. 6. 7. 8. 9. 10. 11. 12. 13. 14. 15. 16. 17. 18.
19. 20. 21. 22. 23. 24. 25. 26.
G. Surpateanu, R. Mocanu and G. Irimia, Anal. Univ. „Al.I.Cuza”, Iasi, 1994, 7, 157. R. Ripan and I. Ceteanu, “Chimia metalelor”, Vol. II, Ed. Didactica si Pedagogica, Bucuresti, 1969, p. 252. K.Venkataraman, “The Chemistry of Azoic Derivates Complexes”, Academic Press, New York, 1986, p. 276. C.D. Nenitescu, “Chimie Organica”, Ed. Didactica, Bucuresti, 1980, p. 144. M. Raileanu, “Influenta mediului de reactie asupra reactivitatii chimice”, Ed. Cartea Româneasca, Craiova, 1987, p. 45. Al. Duca, “Chimie Analitica Generala”, Partea I, Ed. Institutului Politehnic Iasi, 1974, p. 88. N. Foca, “Combinatii Complexe ale colorantilor azoici cu cationic ai metalelor tranzitionale”, Ph. D. Diss., Polyt. Inst., Iasi, 1986. C. Luca and O. Enea, “Determinarea constantelor analitice. Metode electrometrice si optice”, Ed. Didactica si pedagogica, Bucuresti, 1971, p. 145. G.H. Ayers, “Quantitative Chemical Analysis”, A. Haper International Edition, New York, London, 1969, p. 166. N. Foca, G. Lisa and I. Rusu, J. Therm. Anal. Cal., 2004, 78, 239. N. Furman , “Standard Methods of Chemical Analysis”, New York, 1963, p. 212. G. Popa and V. Croitoru, “Chimie Analitica Cantitativa”, Ed. Did. si Ped., Bucuresti, 1971, p. 221. G. F. Kirkbringht and M. Sargent, “Atomic Absorbtion and Fluorescent Specroscopy”, Academic Press, London, 1974, p. 123. T. Wanjun, L. Yuwen, Z. Hen, W. Zhiyong and W.Cunxin, J. Therm. Anal. Cal., 2003, 74, 309. P. Budrugeac and E. Segal, J. Therm. Anal. Cal., 2003, 72, 831. S.V. Vyazovkin, A. I. Lesnikovich and I.S. Romanovsky, J. Therm. Anal. Cal, 1988, 34, 609. S.V Vyazovkin and W. Linert, Analytica Chimica Acta, 1994, 295, 101. M. E. Brown, M. Maciejewski, S. Vyazovkin, R. Nomen, J. Sempere, A. Burnham, J. Opfermann, R. Strey, H. L. Anderson, A. Kemmler, R. Keuleersh, J. Janssensh, H. O. Desseynh, Chao-Rui Lii, Tong B. Tangi, B. Roduitj, J. Malekk and T. Mitsuhashil, Thermochim. Acta, 2000, 355, 125. V.M. Gorbachev, J. Thermal Anal., 1975, 6, 349. V.M. Gorbachev., J. Thermal Anal., Vol. 8 (1976), ref. in. E. Segal, D. Fatu, Introducere in cinetica neizoterma, Ed.Acad.Rom., Bucuresti, 1983, p. 125. K. Nakamuto, “Infrared Spectra of Inorganic and Coordination Compounds”, Wiley, New York, 1963, p. 223. J. Bellany, “Advanced Infrared Group Frequencies”, Mathwen, London, 1968, p. 232. W.J. Potts, “Chemical Infrared Spectroscopy”, Academic Press, New York, 1964, p. 322. P. Klug and I. Alexander, “X-Ray Diffraction Procedures”, John Wiley and Sons, New York, 1974, p. 93. A. B. P. Lever, “Inorganic electronic spectroscopy”, second edition, Elsevier Publisshing Company, Amsterdam, 1984, p. 142. H. Lipson Seeple, “Interpretation of X-Ray Powder Diffraction Patterns”, Macmillan, London, 1970, p. 175.