Factors that influence membrane synthesis and plug microstructure were determined. ... I would like to thank my advisor, Dr. Jerry Y. S. Lin, for giving me the.
Synthesis and Characterization of Ordered Mesoporous Silica with Controlled Macroscopic Morphology for Membrane Applications by Shriya Seshadri
A Dissertation Presented in Partial Fulfillment of the Requirements for the Degree Doctor of Philosophy
Approved April 2011 by the Graduate Supervisory Committee: Jerry Y. S. Lin, Chair Lenore Dai Kaushal Rege David J. Smith Bryan Vogt
ARIZONA STATE UNIVERSITY May 2011
ABSTRACT Ordered mesoporous materials have tunable pore sizes between 2 and 50 nm and are characterized by ordered pore structures and high surface areas (~1000 m2/g). This makes them particularly favorable for a number of membrane applications such as protein separation, polymer extrusion, nanowire fabrication and membrane reactors. These membranes can be fabricated as top-layers on macroporous supports or as embedded membranes in a dense matrix. The first part of the work deals with the hydrothermal synthesis and water-vapor/oxygen separation properties of supported MCM-48 and a new AlMCM-48 type membrane for potential use in air conditioning systems. Knudsentype permeation is observed in these membranes. The combined effect of capillary condensation and the aluminosilicate matrix resulted in the highest separation factor (142) in Al-MCM-48 membranes, with a water vapor permeance of 6×10⁻⁸ mol/m2Pas. The second part focuses on synthesis of embedded mesoporous silica membranes with helically ordered pores by a novel Counter Diffusion SelfAssembly (CDSA) method. This method is an extension of the interfacial synthesis method for fiber synthesis using tetrabutylorthosilicate (TBOS) and cetyltrimethylammonium bromide (CTAB) as the silica source and surfactant respectively. The initial part of this study determined the effect of TBOS height and humidity on fiber formation. From this study, the range of TBOS heights for best microscopic and macroscopic ordering were established. Next, the CDSA ii
method was used to successfully synthesize membranes, which were characterized to have good support plugging and an ordered pore structure. Factors that influence membrane synthesis and plug microstructure were determined. SEM studies revealed the presence of gaps between the plugs and support pores, which occur due to shrinking of the plug on drying. Development of a novel liquid deposition method to seal these defects constituted the last part of this work. Post sealing, excess silica was removed by etching with hydrofluoric acid. Membrane quality was evaluated at each step using SEM and gas permeation measurements. After surfactant removal by liquid extraction, the membranes exhibited an O2 permeance of 1.65x10⁻⁶ mol/m2.Pa.s and He/O2 selectivity of 3.30. The successful synthesis of this membrane is an exciting new development in the area of ordered mesoporous membrane technology.
iii
The following chapters within this dissertation are modified versions of papers or book chapters that have been published or are to be submitted for publication in the journal indicated: Chapter 1 Lin, J.Y.S. & Seshadri S.K. (2010) Chapter 22: Preparation Chemistry of Inorganic Membranes, Modern Inorganic Synthetic Chemistry, P. R. Xu, W. Pang and Q. Huo (Eds.), Elsevier, 507-523.
Chapter 2 Seshadri, S. K. & Lin, Y. S. (2011) Synthesis and Water Vapor Separation Properties of Pure Silica and Aluminosilicate MCM-48 Membranes, Separation and Purification Technology, 76, 261-267. Chapter 3 Seshadri, S. K. & Lin, Y. S., Effect of silica source and environmental conditions on the synthesis of ordered mesoporous silica fibers under non-mixing conditions, Chemistry of Materials, to be submitted. Chapter 4 Seshadri, S. K., Alsyouri, H. & Lin, Y. S (2010) Counter diffusion self-assembly synthesis of ordered mesoporous silica membranes in straight pore supports, Microporous Mesoporous Materials, 129, 228-237. Chapter 5 Seshadri, S. K. & Lin, Y. S., Preparation and defect sealing in ordered mesoporous silica membranes, Advanced Materials, to be submitted.
iv
DEDICATION
To my parents for their love, support and encouragement
v
ACKNOWLEDGMENTS I dedicate this work to my family for their encouragement, patience and belief in me. Special appreciation goes out to my parents, K.S.V. Seshadri and Kamala Seshadri, who taught me the importance of knowledge and have always inspired and encouraged me to follow my dreams. Without them, this work would not be possible. My brother, Ashwin Seshadri, also deserves particular mention for his practical advice and support throughout my life. I would also like to express my gratitude to my sister-in law, Kavita, and my extended family, especially my grandmothers, for their guidance and encouragement. I would like to thank my advisor, Dr. Jerry Y. S. Lin, for giving me the opportunity to work in a novel and exciting area. I am grateful for his support and guidance. His approach to research has left a significant impression on me, especially his willingness to foster independent thinking in his graduate students. I am thankful for his trust in his graduate students and instilling in me a sense of optimism towards problem solving, which is, I believe, equally important in research, as hard work. I would like to thank Dr. Lenore Dai, Dr. Kaushal Rege Dr. David J. Smith and Dr. Bryan Vogt for taking the time and effort to serve on my committee and for their invaluable input. I would also like to take this opportunity to thank my friends for being there for me throughout my educational life.
First, I extend my thanks to
Matthew Anderson (a.k.a. SuperMatt) for being a good friend during my studies at A.S.U. Thanks are certainly due to for proof reading my work, but I am vi
especially thankful for his support and help in cheering me up though frustrating times in research. Special thanks also go out to Deepak Singh and Vineet Gupta for their friendship, advice and guidance when I first arrived at A.S.U. I would also like to acknowledge Mr. Fred Peña for his help with lab setups and troubleshooting. Finally, thanks are due to by current and former lab group members Carrie Eggen, Teresa Rosa, Tyler Norton, Duo Li, Nick Linneen, Xiaoli Ma, Jose Ortiz Landeros, Dr. Jessica Abraham, Dr. Masakoto Kanezashi,, Bo Lu, Haibing Wang, Dr. Jay Kniep, Dr. Xiaotong Wei, Armando Villarreal, Dr. Qinghua Yin, Dr. Ke Zhang, Dr. Xuefeng Zhu, Prof. Xianghong Huang, Dr. Zebao Rui, Dr. Mikel Duke, Dr. Zhenxia Zhao, Dr. Chao Ji, Dr. Jiansheng Li, and Ding Wang for making lab and a fun place to work and for their kindness, friendship and support during the entire course of my Ph.D. studies.
vii
TABLE OF CONTENTS Page LIST OF TABLES..................................................................................................... xii LIST OF FIGURES .................................................................................................. xiv Chapter 1 GENERAL INTRODUCTION ................................................................................... 1 1.1 Inorganic membranes ................................................................................ 1 1.2 Ordered Mesoporous Materials ................................................................ 3 1.3 Synthesis of ordered mesoporous membranes ......................................... 9 1.4. Objectives and Dissertation Structure ................................................... 23 1.5 Structure of the dissertation .................................................................... 30 Chapter 2 SYNTHESIS AND WATER VAPOR SEPARATION PROPERTIES OF ALUMINA SUPPORTED SILICA AND ALUMINOSILICATE MCM-48 MEMBRANES…………………………………………………………..............31 2.1 Introduction ............................................................................................. 31 2.2 Experimental ........................................................................................... 36 2.3. Results and Discussion........................................................................... 39
viii
Page Chapter 3 ORDERED MESOPOROUS SILICA FIBERS: EFFECT OF SILICA SOURCE HEIGHT AND ENVIRONMENT ON FIBER MORPHOLOGY AND FIBER LENGTH UNDER QUINCENT UNMIXED CONDITIONS ................................ 54 3. 1 Introduction: ........................................................................................... 54 3.2. Experimental .......................................................................................... 58 3.2.1. Effect of silica source concentration, height and interface area on fiber formation .............................................................................. 58 3.2.2 Effect of environmental humidity ............................................ 61 3.2.3. Characterization .................................................................................. 62 3.3. Results and Discussion........................................................................... 63 3.3.1. Effect of silica source ratio and height on product formation . 63 3.3.2. Effect of humidity on product formation ................................ 79 3.4 Conclusion ............................................................................................... 93 Chapter 4 COUNTER DIFFUSION SELF ASSEMBLY SYNTHESIS OF ORDERED MESOPOROUS SILICA MEMBRANES IN STRAIGHT PORE SUPPORTS ... 95 4.1 Introduction ............................................................................................. 95 4.2. Experimental .......................................................................................... 99 4.2.1 Supports .................................................................................... 99 4.2.2 CDSA Growth of Mesoporous Membranes ........................... 100 ix
Page 4.2.3 Membrane Characterization ................................................... 102 4.3. Results and Discussion......................................................................... 106 4.3.1 Results of Membranes Synthesized by Three Methods ......... 106 4.3.2. Discussion ............................................................................. 121 4.4. Conclusions .......................................................................................... 124 Chapter 5 DEFECT SEALING BY NOVEL LIQUID DEPOSITIONTECHNIQUE .......... 126 5.1 Introduction ........................................................................................... 126 5.2 Experimental ......................................................................................... 130 5.2.1. Sealing membrane gaps ......................................................... 131 5.2.2 Excess silica etching and Surfactant Removal by Extraction 134 5.2.3 Characterization...................................................................... 134 5.3 Results and Discussion.......................................................................... 136 5.3.1 Results of Gap Sealing Studies .............................................. 136 5.4 Conclusions ........................................................................................... 153 Chapter 6 SUMMARY AND RECOMMENDATIONS ........................................................ 155 REFERENCES ........................................................................................................ 162
x
Page APPENDIX THEORETICAL PERMEANCE OF SUPPORT AND UPPER LIMIT OF MEMBRANE CELL ............................................................................................... 179 THEORETICAL PERMEANCE CALCULATION FOR AS-SYNTHESIZED MEMBRANE WITH GAPS ................................................................................... 184 PREPARATION OF MESOPOROUS SILICA FIBERS...................................... 187 PREPARATION OF ALPHA- ALUMINA SUPPORTS...................................... 190 PREPARATION OF MCM-48 MEMBRANES .................................................... 193 PREPARATION OF AL-MCM-48 MEMBRANES ............................................. 195 MEMBRANE SYNTHESIS BY COUNTER DIFFUSION SELF ASSEMBLY (CDSA) METHOD .................................................................................................. 197 PROCEDURE FOR DEFECT SEALING & POST SEALING SILICA ETCH.. 199 STEADY STATE SINGLE GAS PERMEATION................................................ 201 UNSTEADY STATE SINGLE GAS PERMEATION .......................................... 205 SINGLE AND MULTICOMPONENT GAS PERMEATION ............................. 209 MULTICOMPONENT GAS PERMEATION SETUP FOR OXYGEN/WATER VAPOR SEPARATION STUDIES........................................................................ 212
xi
LIST OF TABLES Table
Page
1.1:Various inorganic precursor and surfactant interactions and corresponding mesoporous structures formed................................................................ 8 1.2: Hydrothermally synthesized membrane: Synthesis solutions used and membrane properties ............................................................................ 11 1.3: Mesoporous silica membranes synthesized by dip and spin coating: Synthesis solutions used and membrane property ................................................ 16 2.1: Properties of MCM-48, Al- MCM-48 and γ- alumina membrane at maximum separation factor ................................................................................... 52 3.1: Various conditions under which synthesis of fibers is studied ...................... 61 3. 2: Length of fibers formed at different TBOS heights (H) and mole ratios ..... 64 3. 3: Interplanar spacing and pore wall thickness, and N2 adsorption-desorption results for the samples prepared at different TBOS heights ............... 71 3.4: Interplanar spacing and pore wall thickness, and N2 adsorption-desorption results for the samples prepared at different TBOS heights ............... 86 4.1: Results of permeation and nitrogen porosimetry studies on hydrophobic track-etch membrane supports .......................................................... 108 5.1: SF6 permeance for membranes synthesized with precursors at various pH…………………………………..………………………………137 5.2: SF6 permeance after gap plugging with different silica precursors ............ 142 5.3: SF6 permeance for membranes sealed at different humidities .................... 142 xii
Table
Page
5.4: SF6 permeance post HF etching with 1:20 (HF: H2O ) solution. ............... 144 5.5: Permeance and selectivity data for as-synthesized, sealed, etched and extracted membrane .......................................................................... 149 5.6: Comparison of nitrogen permeance of mesoporous silica membranes prepared in this work with other preparation methods ..................... 150
xiii
LIST OF FIGURES Figure
Page
1.1: Synthesis pathways for mesoporous silica formation .......................................4 1.2: A schematic representation of organic-inorganic interface under various synthesis conditions ....................................................................................6 1.3: Steady-state film thinning profile established during dip-coating ..................12 2.1: Multicomponent set up for water vapor separation ........................................39 2.2: a) XRD pattern for a MCM-48 membrane and b) Al-MCM-48 membrane ...41 2.3: a) SEM micrograph of a) MCM-48 membrane and b) Al-MCM-48 membrane. Both figures show a uniform thickness for each membrane. ..43 2.4: Cross sectional EDS for an Al-MCM-48 membrane, which shows the change in silica and alumina content from the surface of the membrane into the support........................................................................................................44 2.5: He permeance of MCM-48 membrane ...........................................................45 2.6: He permeance of Al–MCM-48 membrane .....................................................46 2.7: Binary water vapor and oxygen permeance for a MCM-48 membrane at different relative humidities .......................................................................49 2.8: Binary water vapor and oxygen permeance for an Al-MCM-48 membrane at different relative humidities .......................................................................49 2.9: Water vapor to oxygen separation factor for Al-MCM-48 and MCM-48 membranes .................................................................................................50
xiv
Figure
Page
3.1: Scehmatic representation of interfacial method for fiber growth and the CDSA concept ...................................................................................................... 55 3.2: Schematic representation of the experiments with various mole ratio of TBOS keeping the interface area constant ....................................................................... 59 3.3: Schematic representation of the experiments with various interface areas keeping mole ratio of TBOS constant ................................................................... 60 3.4: Schematic for fiber synthesis equipment at controlled humidities ................ 62 3.5: SEM micrographs of fibers synthesized at various TBOS heights… ………66 3.6: Nitrogen adsorption-desorption isotherms for fibers synthesized at various TBOS heights ........................................................................................................ 70 3.7: XRD patterns for fibers synthesized under various TBOS heights ............... 72 3.8: Evaluation of lattice parameter and wall thickness from the hexagonal pore arrangement........................................................................................................... 73 3.9: TEM micrographs of fibers synthesized at various TBOS heights ............... 76 3.10: Inverse length of fiber synthesized (1/L) vs Height of TBOS (H) .............. 78 3.11: Output relative humidity in the two humidity control systems days. .......... 81 3.12: SEM micrograph of products grown at (a) 0% RH and (b) 100% RH ........ 83 3.13: TGA data showing weight loss during the calcination process of the fibers84 3.14: Nitrogen adsorption- desorption isotherms for fibers synthesized at various relative humidities ................................................................................................. 86
xv
Figure
Page
3.15: XRD micrographs of fibers synthesized at a) 100% Relative humidity b) 0% Relative Humidity ................................................................................................. 87 3.16: Schematic representation of fiber formation process ...................................91 4.1: Schematic representation of Method A, Method B & Method C 101 4.2: Schematic representation of oxygen permeation setup................................ 103 4.3:.SEM micrograph of polycarbonate track etch membrane support and membranes sythesized by Method A .................................................................. 107 4.4: SEM micrograph of membarnes synthesized by Method B. ....................... 107 4.5:XRD patterns showing an ordered mesoporous structure of plugs in the assynthesized membrane after CDSA growth ........................................................ 109 4.6: TGA data for as-systhesised Hydrophobic polycarbonate membrane......... 110 4.7: Nitrogen adsorption/desorption isotherm of the plugs from membranes synthesized using hydrophobic supports by Method B ...................................... 113 4.8: Nitrogen adsorption/desorption isotherm of the plugs from membranes synthesized using hydrophilic supports by Method B ........................................ 114 4.9: SEM micrograph showing membranes synthesized Method C ……….......116 4.10: Nitrogen adsorption/desorption isotherm of the plugs from membranes synthesized using hydrophobic supports by Method C; Inset - BJH pore size distribution. ......................................................................................................... 118 4.11: Nitrogen adsorption/desorption isotherm of the plugs from membranes synthesized using hydrophilic supports made by Method C………………… ..119 xvi
Figure
Page
4.12: TEM image of a plug removed from a membrane synthesized on a hydrophobic support ...........................................................................................120 5.1: Schematic showing various steps leading to formation of gap in membrane ............................................................................................................................. 127 5.2: Illustration of the entire gap sealing process, followed by etching and surfactant removal ............................................................................................... 132 5.3: Schematic of the counter liquid deposition step to remove gap between plug and support. ......................................................................................................... 133 5.4: Schematic of setup for infiltration followed by reaction with water vapor . 134 5.5: As-synthesized membrane showing the presence of gaps between plug and support................................................................................................................. 136 5.6: Membranes after secondary with TMOS and acid at pH 0.5 at low and high magnification ...................................................................................................... 138 5.7: Membranes after secondary with TEOS and acid at pH 0.5 at low and high magnification ...................................................................................................... 138 5.8: Membranes after secondary with TBOS and acid at pH 0.5 at low and high magnification ...................................................................................................... 139 5.9: Top view of a membrane with the gaps sealed by infiltration method at 10% RH ....................................................................................................................... 143 5.10: Cross sectional view of the membrane after gap filling. The plug is removed in this image to make visualization easy............................................................. 144 xvii
Figure
Page
5.11: SEM micrograph showing a plug within a support pore a) with the gap sealed before etching, b) with microporous silica filling the gap between plug and support post etching ............................................................................................ 145 5.12: Schematic showing the different points at which the gap can be filled to seal defects ................................................................................................................. 151 5.13: Illustration of the entire gap sealing process in the source infiltration and reaction with water vapor method....................................................................... 153
xviii
Chapter 1 GENERAL INTRODUCTION 1.1 Inorganic membranes Inorganic membranes include a large group of dense or porous materials allowing for selective transport of mass species, such as gases, liquids or ions. According to the IUPAC definition, in terms of the material pore size [Koros et al., 1996], membranes include macroporous (pore diameter dp > 50 nm), mesoporous (2 nm < dp < 50 nm) and microporous (0 < dp< 2nm) materials, which correspond to microfiltration (MF), ultrafiltration (UF) and nanofiltration (NF) membranes. Membranes with pore size smaller than 0.3 nm through which helium cannot permeate are referred to as dense membranes. With respect to the materials used to fabricate them, membranes include polymeric, inorganic and biological membranes. Both polymeric and inorganic membranes have found industrial applications for separation and chemical reaction, with polymeric membranes playing a major role in liquid separation (desalination) and gas separation due to their low costs and ease of fabrication into membrane modules with high packing density. The major advantages of inorganic membranes as compared to polymeric membranes are their better thermal, chemical and mechanical stability and higher perm-selectivity [Lin, 2001]. However, the disadvantages are their higher costs and difficulty to make the membrane modules with high packing density. Inorganic membranes will find applications that require high perm-selectivity and 1
good chemical and thermal stability beyond what can be offered by polymeric membranes. For example, microporous zeolite membranes provide extremely high water to organic selectivity and can be used for solvent dehydration [Sano et al., 1997]. High temperature dense mixed-conducting ceramic membranes can be used in air separation to produce warm oxygen for power generation, and steel and glass production [Marcano, et al., 2002].
Many chemical reactions are
operated at high temperatures so inorganic membranes are ideally suited in membrane reactors for chemical reactions to improve reaction conversion or product selectivity [Bredesena et al., 2004; Li, 2007]. Porous inorganic membranes can be classified as microporous, mesopores and macroporous. The membranes are typically prepared in an asymmetrical structure, consisting of thick, large pore supports and a thin, smaller pore separation layer. In most cases, macroporous membrane separation layers are prepared by submicron or nanometer sized particles.
Here, the particle size
determines the pore size of the eventual membrane fabricated. Microporous inorganic membranes include crystalline (zeolites and metal organic frame work (MOF’s) and amorphous (mainly SiO2 and carbon) materials. The membranes are prepared as thin films on porous inorganic supports that provide mechanical strength. The thickness of the microporous film varies from tens of nanometers to a few microns. In most cases, the microporous membrane film is coated on the surface of an amorphous mesoporous inorganic membrane layer with desired surface smoothness and pore size. Disk and single-tube configurations are the 2
most common geometries of the microporous inorganic membranes, although microporous membranes are also prepared on hollow fiber and flat-sheet supports. As discussed above, microporous membranes include amorphous silica, crystalline zeolite and MOF membranes.
Similarly, mesoporous membranes
include disordered mesoporous materials such as ultra-filtration -alumina or zirconia membranes whose pores are random and formed by packing small aluminum or zirconia crystalline particles. Ordered mesoporous membranes, on the other hand, have various defined pore architectures depending on the synthesis methods. These membranes also need to be fabricated on macroporous supports. Due to their ordered nature and narrow pore size distribution, a substantial effort has been made in the past decade towards fabrication of these membranes. The membrane synthesis protocol is usually very closely related to material synthesis in these systems. Therefore, to understand the synthesis of ordered mesoporous membranes, it is first necessary to understand the synthesis of ordered mesoporous materials. 1.2 Ordered Mesoporous Materials Ordered mesoporous materials contain pores ranging from 2 to 50 nm. Unlike disordered mesoporous materials, these materials have pores arranged in an ordered fashion, with a pore wall made of amorphous microporous material. These were developed in an effort to synthesize materials which have the crystallinity of zeolites but can cater to applications where much larger pore sizes are desired [Xu et al., 2007].
While single molecules are used as structure 3
directing agents for zeolites, larger molecular assemblies of surfactants are used as directing agents to form mesopores. The first ordered mesoporous materials synthesized with the use of surfactant molecules was reported by the Mobile research group in 1992 [Kresge et al., 1992]. Since this discovery, a number of groups have successfully synthesized various ordered mesoporous structures and morphologies. Ordered mesoporous materials are characterized by having ordered pore structures with a narrow pore size distribution, high surface areas (~1000 m2/g), highly ordered pore channels, high thermal and structural stability (with adequate treatment), high porosity and a number of different pore connectivities that can be achieved by modulating the synthesis conditions and surfactants used. These properties make them particularly favorable for a number of membrane applications such as size separation, polymer extrusion, nanowire fabrication, membrane reactors and catalytic reactors [Lu et al., 2004].
Figure 1.1: Synthesis pathways for mesoporous silica formation [Hoffman et al., 2006] 4
The pore ordering in mesoporous materials is derived from surfactant templates. During synthesis, metal alkoxides undergo either hydrolysis and condensation around preexisting liquid crystal templates or co-operative selfassembly to form a material with long range order. The surfactant can then be removed to obtain the final ordered mesoporous structure. The steps in the formation process of an ordered mesoporous system are illustrated in Figure 1.1 [Hoffman et al., 2006]. While the chemistry of metal oxide hydrolysis and condensation is similar to that in sol-gel synthesis, the addition of surfactants introduces more complexities. The reactions rates for polymeric metal oxide formation need to be controlled so as to allow for enough time for long range order formation. The synthesis solution is usually made up of four components: 1) the inorganic precursor; 2) the structure directing surfactant template; 3) a solvent; and 4) a catalyst [ Soler-Illia et al., 2003]. There are three main processes that take place during synthesis: inorganic hydrolysis condensation, assembly of surfactant templates and the interaction between the organic and inorganic species [Soler-Illia et al., 2003]. The delicate interplay between these processes results in the formation of a well ordered system. The final morphology of the given product is essentially governed by the interaction between the charged inorganic species and the surfactant. Depending on the synthesis conditions used, a number of morphologies can be attained.
5
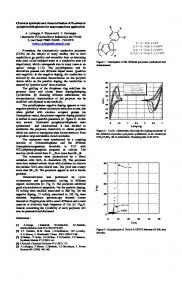
Figure 1.2: A schematic representation of organic-inorganic interface under various synthesis conditions [Soler-Illia et al., 2002] Huo et al. [Huo et al., 1994] have described the formation of a number of materials using the concept of charge matching between the template and inorganic species. Figure 1.2 shows a schematic representation of an organicinorganic interface under various synthesis conditions. Here, S denotes the surfactant template, I the inorganic species, X the halogen ion and M the alkaline cations. The positive (+), negative (-) and the neutral (0) symbols indicate cations, anions and neutral molecules respectively. Based on the pH used, the inorganic species can carry a different charge. For example, for the case where the pH of the synthesis solution is greater than 10, the silica will be in its anionic form. Conversely, for a pH lower than the isoelectric point, at 2, the silicate will be in its cationic form. In the most elementary system, as in the case for synthesis of order silica at pH >10, the ordering is derived from the direct interaction between 6
the inorganic species and charged surfactant (S+I-). In other cases, mediating ions might be necessary to bring about charge matching within the system. This is obtained by the addition of acid or alkaline moieties. In synthesis conditions below a pH of 2, a halide (Br-, Cl-) acts as a bridging ion to form a S+X-I+ assembly. Ordered mesoporous silicate synthesis has been extensively studied in the past decade and these materials can now be prepared by using a wide range of precursors under a vast number of reaction conditions (pH, temperature, etc). The precursors that are most commonly used are tetraethylorthosilicate (TEOS) as silica source, water (and ethanol in some cases) is used as the solvent and NaOH or an acid halide is usually used as the catalyst [Xu et al., 2007]. This extensive array of synthesis conditions has led to a wide range of possible pore symmetries that can be formed. Table 1.1 summarizes the various pore systems that can be attained under various synthesis conditions. In a typical synthesis procedure for ordered mesoporous silica, the surfactant is mixed with the water and a catalyst. The silica source is then added to this mixture and stirred from anywhere between 30 min to 2 hours. The system is heated to ~100oC in an oven for 3 to 6 days depending on the procedure chosen. The product is then washed and filtered to obtain the organic–inorganic composite. The surfactant can then be removed by liquid extraction or calcination to obtain the final product [Huo et al., 1996].
7
Table 1.1: Various inorganic precursor and surfactant interactions and corresponding mesoporous structures formed Inorganic Precursor (I)
Anionic
Anionic
Cationic
Surfactant (S)
Cationic
Anionic
Cationic
Counterion (X/F/M)
---
M
X
Interaction
Possible Formed
I−S+ electrostatic force
Hexagonal MCM-41 and FSM-16, cubic MCM-48, hexagonalcubic SBA-2, lamellar and hexagonal W2O3, lamellar, hexagonal and cubic Antimony (V) Oxide, lamellar Tin Sulfide and Aluminophosphate
I−M+S− electrostatic force
+
−
I+X−S+ electrostatic force
I+S− electrostatic force
Cationic
Anionic
---
Cationic Cationic Neutral
Non Ionic Non Ionic Cationic
X− F− F−
Neutral
Non Ionic
---
Neutral
Non Ionic
N0 (amine)
I0N0 hydrogen bond
Neutral
Non Ionic
M+
I0(S0Mn+)
No Charge
No Charge
---
IS covalent complex
I+X−(S0H+) I+F−N0 I0F-S+ I0S0 hydrogen bond
8
Structures
AMS-n, lamellar Zinc Oxide, Alumina Cubic SBA-1 (Pm3n), hexagonal-cubic SBA-2, hexagonal SBA-3, lamellar and hexagonal Zirconia, hexagonal Titanium Dioxide, Zinc Phosphate Lamellar Magnesium, Aluminum, Gallium, Manganese Oxides, hexagonal Alumina, hexagonal Gallium Oxide, hexagonal Tritium Dioxide, hexagonal Tin Oxide Hexagonal SBA-15 Hexagonal Silica Hexagonal Silica Near hexagonal HMS Near hexagonal MSUX; hexagonal Titanium, Aluminum, Zirconia, Tin Oxides Hexagonal and cubic metal-containing silica Silica, Nb, Ta oxides, hexagonal Ta
1.3 Synthesis of ordered mesoporous membranes Given the numerous morphologies and ordering that can be achieved, these materials have garnered considerable interest for fabrication into supported thin films and membranes. The use of these materials as membranes is a fairly recent development. Various methods have been utilized to fabricate these membranes, the most predominant of them being hydrothermal synthesis, dip coating and spin coating. Hydrothermal synthesis is widely used for production of MCM-48 type membranes. Here, ordered mesopores formation and membrane synthesis take place in a coupled process. The support for membrane synthesis is placed in the synthesis sol and once the ordered gel is formed, it precipitates and deposits onto the support forming a membrane. The initial hydrolysis of silica and formation of the mesophase begins at room temperature. The system is then heated and further ordering of the system, condensation-polymerization of the silicate species and the precipitation of the ordered silica-organic composite to form a film on porous the support all take place at this elevated temperature. The final step involves removal of the surfactant to reveal an ordered mesoporous membrane [Nishiyama et al., 1998 ]. In the first reported synthesis by Nishiyama et al. [Nishiyama et al., 1998], the precursors used where tetraethylorthosilicate (TEOS), quaternary ammonium surfactant (C16H33(CH3)3NBr; CTAB), NaOH and deionized water in the following molar ratio 0.59 CTAB: 1.0 TEOS: 0.5 NaOH: 61 H2O. Macroporous 9
alumina discs were used as the support for this particular membrane. In a typical procedure, the support is soaked in TEOS. Afterwards, the remaining reactants are mixed together and the solution is added to the TEOS. After mixing for 90 min, the mixture is then transferred to an autoclave with the support held horizontally at the bottom. The system is heated to 90oC for 96 hrs. Table 1.2 summarizes the various studies conducted to fabricate these membranes along with the N2 permeance values. Various methods can be used to remove the surfactant from the assynthesized membrane. The most common one involves calcining the material at 500oC for 4 hours. Upon calcination, the uncondensed silanol groups in the silica matrix condense to form siloxane bonds, which results in the contraction of mesopores [Feng et al., 2000]. This shrinkage can lead to defects in the membranes. To avoid this, liquid extraction of surfactants has been carried out. The surfactant can be extracted using an EtOH/HCl solution containing 250 mL EtOH and 3.5 g of 37% HCl at 100oC for 24 h [Kumar et al., 2006]. This modification has been observed to improve the quality of the membrane as evidenced by the improved gas separation properties. Due to the long synthesis time and large pore supports used, EDS and XRD analysis has shown that there is often considerable silica penetration into the supports. Various measures have been taken to minimize such infiltration. Kumar et al. [Kumar et al., 2008] used asymmetric supports, covering one side with electrical tape, to some degree of success. Boissiere et al. [2005] impregnated a tubular support with an aqueous 10
solution of NaF, which catalyzes the condensation reaction of the silica precursor. In this method, the growth of the selective silica layer was restricted to just the area on top of the support. Table 1.2: Hydrothermally synthesized membrane: Synthesis solutions used and membrane properties
Support Used Stainless steel Asymmetric -alumina -alumina -alumina -alumina (tube) Asymmetric alumina (porous) Symmetric Zirconia Asymmetric -alumina
Precursors Used
1 TEOS: 0.5 NaOH: 60 H2O: 0.6 CTAB 1 TEOS: 0.5 NaOH: 61 H2O: 0.59 CTAB 1 TEOS: 0.5 NaOH: 61 H2O: 0.59 CTAB 1 TEOS: 0.5 NaOH: 61 H2O: 0.59 CTAB 1 TEOS: 0.5 NaOH: 61 H2O: 0.59 CTAB 1 TEOS: 0.35-0.55 NaOH: 55-65 H2O: 0.40-0.65 CTAB 1 TEOS: 0.46 NaOH: 56 H2O: 0.48 CTAB 1 TEOS: 0.5 NaOH: 61 H2O: 0.59 CTAB
Pore Size (nm) ----2.0 2.5 2.7
Thickness (m) /N2 Reference permeance (mol/m2Pas) 500/ Nishiyama et al., 1.5x10⁻⁵ 1998 ---/ Nishiyama et al., 8x10⁻⁸ 2001 7/ McCool et al., 2003 1.4x10⁻⁶ 15/ Kumar et al., 2006 0.8x10⁻⁷ 6/ Liu et al., 2007 2.0x10⁻⁷
2
0.5 1.4 x10⁻⁷
Sakamoto et al., 2007
---
2-3/ 7x10⁻⁷
Ji et al., 2008
2.5
7/1.12x10-7
Kumar et al., 2008
Other popular techniques for membrane synthesis are dip and spin coating. These two are similar, in that, both techniques employ solvent evaporation to induce structure formation by increasing reactant concentration within the system. These systems usually contain surfactants at concentrations well below the critical micellar concentration (cmc) in the dip coating solution. This technique, called evaporation induced Self Assembly (EISA), was first reported by Brinker and co11
workers in 1997 [Lu et al., 1997]. In a typical synthesis, TEOS (Si(OC 2H5)4), ethanol, water and HCl (molar ratios 1:3:8:5x10⁻⁵) were refluxed at 60C for 90 min. Second, water and HCl were added, increasing the concentration of HCl to 7.34 mM. After stirring at 25C for 15 min, the sols were aged at 50C for 15 min and diluted with ethanol. Finally, CTAB was added in quantities corresponding to concentrations in the range 0.03–0.11 M (1.5–5.0 wt%). The final reactant mole ratios were: 1 TEOS: 22 C2H5OH: 5H2O: 0:004 HCl: 0:054–0:18 CTAB. These synthesis systems are often acid catalyzed since the isoelectric point of silica is around a pH of 2.
At the isoelectric point, condensation is minimized.
Maintaining the system at this pH helps avoid condensation and structure formation before dip coating.
Figure 1.3: Steady-state film thinning profile established during dip-coating of a complex fluid comprising soluble silica, surfactant, alcohol and water. Approximate trajectory taken in ethanol/water/CTAB phase space during dipcoating. Point A corresponds to the initial composition of solution, Point B is near the drying line, and Point C corresponds to the dried film [Brinker et al., 1999]. 12
It has been observed that optimum ordering is obtained when the number of Q1 species in the prehydrolyzed silica is the greatest. In sols where Q3 species are present, apparent ordering within the system is lost in the final dip coated film [Klotz et al., 2000]. Once the solution is dip coated, the more volatile components (alcohol, water and acid) evaporate rapidly increasing local surfactant and silica concentrations. This leads to rapid self-assembly of the surfactant and silica, forming the liquid-crystal mesophase at the air/liquid interface. Similarly, at the substrate/liquid interface, local concentrations of surfactant are high due to formation of cylindrical micelles and hemimicelles which lead to the formation of ordered mesopores at the interfaces. Figure 1.3 reveals the approximate pathway that is traversed during synthesis. The ordering of the final structure is strongly dependent on the relative rates of three competing reactions: organic-inorganic interface co-assembly (kinter), organic assembly (korg) and inorganic condensation (kinorg). In general, the rates of these reactions need to be controlled such that the kinter > korg> kinorg in order to synthesize well ordered mesophases. A number of different phase structures and pore orientations can be achieved by carefully controlling the precursor concentration and the humidity of the reaction environment. It is possible to control the composition of the final material by fine tuning the composition of the initial reaction mixture. Towards this, synthesis of mesoporous thin films has been widely studied. McCool et al. [McCool et al., 2003] first reported on the synthesis of mesoporous MCM-48 membranes by dip coating. Here, a TEOS sol was prepared by mixing TEOS, 13
ethanol, water and HCl in the molar ratio of 1 TEOS: 3 EtOH: 1 H2O/5∙ 10−5. The sol was refluxed at 60C for 1 h and then cooled to room temperature. The dip coating solution was then prepared by mixing the prehydrolyzed sol with water, HCl and CTAB. The final molar ratios of the dipping sol were 1 TEOS: 20 EtOH: 5 H2O: 0.004 HCl: 0.14 CTAB. The dipping solution was aged for 1 week prior to use. Supports were then dipped in the solution in a class 100 laminar flow cabinet. The dipping rate was approximately 3 cm/s. After dip coating, the membranes were dried in the laminar flow cabinet for 1 h. The membranes were calcined in air at 500C for 4 h with heating and cooling rates of 1C/min. The dip coated membrane was seen to be ~ 2 m thick. Table 1.3 lists the different studies that were conducted on membrane synthesis using dip coating techniques, including the composition of the final sol precursor prepared. While most studies have focused on using ionic surfactants, non-ionic pluronic surfactants has also been successfully used to synthesize mesoporous membranes [Higgins et al., 2006; Higgins et al., 2009].
These membranes
showed larger diameter pores (4.7 nm) than when ionic surfactants were used (2.5 nm). For membranes synthesized using non-ionic pluronic surfactants, a typical synthesis solution consisted of the following molar ratio: 1 TEOS: 5.2 EtOH: 12 H2O: 0.015 HCl: 0.021 Pluronic P123. The thickness of the synthesized membrane is reported to be about 1 µm and has been reported to be of good quality.
14
Impregnation of silica sol into the support has also been observed in the case of dip coated membranes. Boffa et al. [Boffa et al., 2007] sought to control silica impregnation into the support by increasing the viscosity of the sol with the help of a urea based additive called BYK-420. By rendering the sol thixotropic, the group was able to decrease silica penetration into the support. The addition of BYK-420 also resulted in an increased pore diameter. Beyond a maximum concentration, complete collapse of the pores was observed. The sol used in the spin coating of ordered mesoporous membranes is similar to those used in dip coating. In spin coating, the sol is dropped on a substrate which is then spun at a fixed rpm. The sol spreads radially over the support due to centrifugal forces. In addition, excess silica sol is spun off during this procedure [Brinker et al., 1990]. The volatile components then evaporate from the system, increasing local silica and surfactant concentration to form an ordered mesoporous structure. Relatively few membranes have been prepared by the spin coating technique, as extremely smooth surfaces are required to assure proper coverage. The presence of macropores in the supports makes this requirement difficult to achieve.
The composition of the sols used for spin
coating is listed in Table 1.3.
15
Table 1.3: Mesoporous silica membranes synthesized by dip and spin coating: Synthesis solutions used and membrane property (* = O2 permeance) Technique
Support Used
Dip coating, spin coating
-alumina (support by -alumina)
Dip coating
-alumina
Dip coating, spin coating
-alumina
Spin Coating
Porous alumina
Dip coating
Dip coating
-alumina and -alumina (supported by alumina) Asymmetric -alumina
Dip Coating
Anodic alumina
Dip coating
-alumina
Spin coating
Assymetric alumina
Dip coating
Nafion 117
Dip Coating
Anodic alumina
Precursors Used 1 TEOS: 6.5 1propanol: 2.6 2Butanol: 10 H2O: 0.01 HCl: 0.08 CTAB 1 TEOS: 20 EtOH: 5 H2O: 0.004 HCl: 0.14 CTAB 1 TEOS: 6.5 1propanol: 2.6 2Butanol: 10 H2O: 0.01 HCl: 0.08 CTAB 1 TEOS: 6.5 1propanol: 2.6 2Butanol: 10 H2O: 0.01 HCl: 0.08 CTAB 1 TEOS: 6.5 1propanol: 2.6 2Butanol: 10 H2O: 0.01 HCl: 0.08 CTAB
1 TEOS: 8.7 EtOH: 6 H2O: 0.004 HCl: 0.25 Brij-56 1 TEOS: 1-propanol 15: 15.5 H2O: 0.14 HNO3: 0.13 CTAB 1 TEOS: 7.6 EtOH: 5 H2O: 0.005 HCl: 0.1 CTAB 1 TEOS: 20 EtOH: 5 H2O: 0.0087 HCl: 0.0097 Pluronic P123 1 TEOS: 5.2 EtOH: 12 H2O: 0.015 HCl: 0.021 Pluronic P123
16
Pore size (nm)
Thickness (nm)
Reference
2.8-3.4
20-30
Chowdhury et al., 2003
2.0
2000
McCool et al., 2003
2.3-2.6
65-70
Schmuhl et al., 2004
0.8
430
Nakagawa et al., 2005
---
≈ 600
Chowdhury et al., 2006 ]
4.7
≈ 20003000
Higgings et al. , 2006
5-20
---
Yoo et al., 2006
1.8-4.2
1000
Boffa et al., 2007
2.0
300
Sakamoto et al., 2007
---
1000020000
Lin et al., 2008
4.7
1000
Higgins et al., 2009
A number of alternative techniques have been developed for the synthesis of mesoporous membranes.
These techniques include using shear force
[Hillhouse et al., 1997], magnetic fields [Yamauch, et al., 2005] and aerosol assisted deposition [Nagarajan et al., 2008]. Some of these techniques seek to fill the pores in the support, hence reducing the pore size and bringing it down into the mesopore range. There has also been considerable interest shown towards developing oriented pores, especially those which are oriented perpendicular to the support surface. Such an orientation would allow for greater accessibility for molecular transport [Nagarajan et al., 2008]. Confinement techniques have developed into extremely promising synthesis methods for the formation of oriented pores. Here, the structure directing agent effects of the interface were sought to control mesostructure formation. The first successful study was conducted by Yamaguchi et al. [Yamaguchi et al., 2004], in which a mixture of ethanol, TEOS, 1 mL HCl solution and CTAB were added, and the solution was stirred for 30 min. Porous anopore supports (pore diameter = 200 nm) was set in an ordinary membrane filtration apparatus, and the precursor solution was dropped onto the alumina membrane. Moderate aspiration was applied so that the precursor solution penetrated into the columnar pores of the support. The support, including the precursor solution, was then dried in air at room temperature. Resulting in the formation of mesopores within the pores of the anopore support. The mesopores were seen to have channels that run in a perpendicular direction to the support surface. The channels, however, did not 17
run the entire thickness of the support. The authors ascribed the formation of the hexagonal structure in the direct vicinity of the pore wall to the adsorption of cationic CTAB to the alumina wall. Lu et al. [Lu et al., 2004] reported the synthesis of mesoporous SBA-15 having a pore diameter of 6 nm within alumina anopore supports by dipping it in a sol solution for 20 hrs. Both these methods can be thought of as a combination of the EISA method and support confinement technique. Stucky and co-workers have published a comprehensive study on the effect of confinement on the mesophase formed in anopore supports [Wu et al., 2004]. In situ grazing incidence small-angle X-ray scattering (GISAXS) techniques, in combination with ex situ transmission electron microscopy (TEM) conducted by Platschek et al. [Platschek et al., 2008] have revealed that, in the case of ionic CTAB surfactant, contrary to previous belief, the formation of structure starts very late in the evaporation process. It has been proposed that the cmc is reached first, followed by structure formation in the vicinity of the support wall, acting as a heterogeneous nucleation center. Nonionic surfactants Brij-56 and Pluronic P123 were observed to form a circular hexagonal structure first with the mesopores aligned around the circumference of the AAM channels. The circular structure subsequently transforms into a columnar hexagonal (P123 surfactant), or a mixture of columnar hexagonal and curved lamellar phases with the lamellae oriented parallel to the walls of the AAM channels (Brij-56 surfactant). It has been reported that these transformations occur after complete
18
solvent evaporation and, therefore, differ from simple evaporation-induced phase formation. Another area of importance deals with the use of functionalized membranes. Functionalization of zeolites and sol-gel silica has been a topic of great interest for some time. Given that ordered mesoporous silica materials have high surface areas, availability of terminal silanol groups and large pore sizes (which leads to better pore accessibility), they are expected to have better performance in applications such as adsorbents, catalysis, sensing and membrane reactors [Lu et al., 2007]. Functionalization of the silica matrix can be achieved either in the synthesis stage by co-condensation or in a post synthesis grafting step. The advantage of functionalizing during synthesis is that it can be accomplished with a one step synthesis procedure. Additionally, these methods have been shown to provide more stable composite materials with a homogenous distribution of functional groups [Burkett et al., 1996]. The main disadvantage is that the synthesis system will need to be modified to accommodate the additional reactants added to the synthesis mixture, which means that delicate charge balance within the system must be maintained. The loading of the material also needs to be kept at less than 25% to avoid structural collapse of the mesopores. Post synthesis functionalization, on the other hand, has the advantage of not requiring remodeling of the ordered material synthesis process.
The
functionalization of mesopores can be relatively easy to achieve due to the presence of uncondensed siloxane bonds within the system. These siloxane bonds 19
act as anchoring sites for functional molecules. It has been suggested that the population density and the quality of the functionalized monolayers on mesoporous materials are greatly affected by the population of silanol groups and the number of adsorbed water molecules on the mesoporous silica surface. The calcining step used in preparing mesoporous silica causes condensation of the silanol groups present, thus resulting in poor surface coverage [Feng et al., 1997]. This can usually be overcome by introducing a small amount of water into the system to recover some of lost silanol groups. Other drawbacks in these systems are the narrowing of the pores due to the addition of the grafted materials and difficulty in achieving uniform dispersion of the grafted molecule in the mesostructure. Furthermore, the pore openings are often blocked, which leads to low loading within the pores of the membrane. Early studies conducted on functionalized materials and thin films have been quite successful. In membrane systems, however, fewer studies have been conducted. Most of these studies have focused on employing the post synthesis grafting technique. Grafted materials include, but are not limited to long chain hydrocarbons
such
as
3-aminopropyltrimethoxysilane,
polyethyleneimine,
aminoproply triethoxysilane and octadecyldimethylchlorosilane. These grafted membranes were used to study various separation properties. Park et al. [Park et al., 2003] post-functionalized MCM-48 membranes with trimethylchlorosilane to enhance hydrothermal stability and hydrophobicity. The separation properties of this membrane for ethanol, methylethyl ketone (MEK), and ethyl acetate (EA) in 20
an aqueous solution were studied. Functionalization using trimethylsilane and triethylsilane resulted in enhanced EtOH/water separation properties in the membrane [Park et al., 2001]. Yacou et al. [Yacou et al., 2009] have successfully shown that high dispersion of platinum into the silica matrix can be brought about with the use the of sol-gel method. Iron oxide nanocrystallites [Li et al., 2008] and iron oxide clusters [Bachari and Touileb, 2009] have also been successfully incorporated in SBA-15 materials. These modifications can greatly enhance the potential of membranes in separations with catalytic reactors. 1.4 Applications and present challenges for mesoporous membranes Given the highly tunable pore sizes, large surface area and ease of functionalization, mesoporous membranes have a number of applications in fields ranging from flue gas separation to drug delivery. Since mesoporous membranes have diameters greater than 2 nm, gas separation by molecular sieving cannot be achieved in these membranes. If synthesized without defects, these membranes can only provide a maximum selectivity equal to that predicted by Knudsen diffusion. This selectivity is not high enough to make these membranes desirable for gas separation in their original form. The trend in the recent years has been towards using functionalized mesoporous membranes to enhance selectivity. The high surface area of the membranes makes it an excellent support for functionalized molecules. One of the areas that has generated a lot of interest in the recent years is CO2 separation form flue gas. This has been achieved by amine functionalization of the various membranes [McCool et al., 2005, Sakamoto et al., 21
2007; Kumar et al., 2008b]. CO2/N2 selectivity as high has 800 has been achieved but at the expense of a very low CO2 permeance [Sakamoto et al., 2007]. Another promising area for mesoporous membrane systems is the separation of organics from water. Park et al. [Park et al., 2003] have studied organic-water separation of functionalized mesoporous membranes which have been reported to enhance separation of organics. Ordered mesoporous membranes with straight through pore channels are particularly attractive in membrane morphology as they are expected to provide higher
fluxes
than
conventional
membranes.
Recently,
trimethylsilyl
functionalized SBA-15 membranes have been shown to successfully size separate silver nanoparticles [Mekawy et al., 2011].
An artificial biomembrane has also
been fabricated by introducing an enzyme, formaldehyde dehydrogenase, into the silica nanochannels that had been incorporated in an anodic alumina support. There are a myriad of potential applications for ordered mesopores membranes with straight though channels.
Materials with straight through
channels, with hexagonal pore structure, has been used as catalyst supports for polymerization of various olefins [Tudor and O’Hare 1997; Looveren et al. 1998, Kageyama et al. 1999; Ko and Woo 2001]. The pore channels of these particles serve as templating polymerization reactors for the growth of polymer fibers that have enhanced structural and mechanical properties. These membranes are also expected to aid in protein separation, [Katiyar & Pinto,2006] catalysis and nanowire fabrication [Han et al., 2000]. 22
As detailed in the previous section, a number of different synthesis techniques have been used to fabricate ordered mesoporous membranes, with various degrees of success. Successful mesoporous membrane studies have focused on the synthesis of MCM-48 membranes with cubic structure. At the most basic level of synthesis, the biggest challenge is to fabricate defect free membranes with high fluxes. This could be achieved by reducing the thickness of the separation layer or by removing resistances offered by the macroporous support [Kumar et al., 2010].
Another challenge includes the search for
functionalizing moieties that improve selectivity without causing a significant loss in permeance [Kumar et al., 2010]. Much research interest has been shown towards fabricating membranes with straight through pore channels, which would enhance pore accessibility at the membrane surface. A few studies have focused on synthesis of membranes with specific pore ordering using confining techniques [Yamaguchi et al., 2008; Mekawy et al., 2011; Itoh et al., 2011]. These techniques have shown much promise. However, these studies have focused on large pore mesoporous membranes (3.5 nm and larger) using non-ionic surfactants as templates. Once fabricated, these membranes are expected to pave the way for applications in areas such as polymer extrusion and drug delivery. 1.5 Objectives and Dissertation Structure Ordered mesopores membranes can be fabricated in two different morphologies as indicated previously: 1) As a supported membrane that is 23
fabricated on a macroporous support to form a two layer system with the selective layer being the mesoporous top layer. 2) As composite membrane where the selective ordered mesoporous material is embedded inside a supporting dense matrix.
The type of membrane desired would greatly depend on the end
application. This work deals with synthesis, characterization and separation studies of both these membrane morphologies. Published research shows that, in the case of supported membranes, enhancement of separation factors with minimal loss in permeation flux is a critical area where improvement is desired [Kumar et al., 2010]. One area in which ordered mesoporous membranes could provide enhanced separation factors, which has not been exploited as of yet, is vapor-gas separation. Given the small diameters and narrow pore size distribution of these materials, it is expected that capillary condensation will take place within the pores at low partial pressures of the vapor. This would, in turn, result in the filling of the pores and block the transport of the non-condensable gas though the membranes resulting in enhanced separation factors. The first part of this dissertation, therefore, deals with the study of water vapor–oxygen separation using supported ordered mesoporous membranes, for enhanced separation performance with minimal loss in permeance. In the area of embedded membranes, there has been immense interest in fabrication of ordered systems with controlled pore orientation, with an aim at allowing either higher flux and/or an increase in the range of applications in 24
mesoporous membrane systems. One successful method used for the synthesis of these membranes, is a combination of dip coating and evaporation induced selfassembly [Yamaguchi et al., 2008]. However, the pore channel ordering in this method cannot be controlled easily and most systems that have been fabricated via this approach have a pore size that is greater than 3.5 nm. The second part of the dissertation will address the formation of these membranes with pores that run though the thickness of the membrane and have a diameter of 2.5 nm. Specifically, this dissertation is divided into two parts. The first part deals with synthesis of supported MCM-48 type membranes. In this study, a MCM-48 and a new aluminosilicate Al-MCM-48 membrane were fabricated into the supported membrane morphology. The synthesis was geared towards improving the oxygen/water vapor separation performance in MCM-48 membranes by incorporation of aluminum into the framework. The incorporation of aluminum in the pore walls of the Al-MCM-48 membrane is expected to increase the selectivity, with minimal loss in permeation flux. Successful synthesis of such a membrane would result in potential applications in air conditioning systems, water vapor separation in flue gases etc. The second issue that will be addressed is the formation of an oriented pore membrane with pore size of 2.5 nm and channels that run though the length of the membrane. In this study a Counter Diffusion Self Assembly technique will be utilized to synthesize embedded membranes with pores that run helically though the thickness of the membrane. Factors that affect material and membrane 25
morphology will be studied to obtain reproducible membranes of good quality. New defect sealing techniques will be studied to synthesize high performance defect free membranes. These membranes will provide new avenues in membrane applications such as polymer extrusion. Objective 1: Fabrication of mesoporous membranes with enhanced oxygen/water vapor selectivity in the supported membrane morphology In this work, ordered mesoporous MCM-48 and aluminum incorporated MCM-48 (Al-MCM-48) membranes will be fabricated on macroporous -alumina (Alcoa; A16 particle size) supports by the hydrothermal synthesis method. The surfactant will be removed by a liquid extraction method to minimize defect formation. The presence of an ordered structure will be verified using X-ray diffraction studies. Single gas permeation measurements will be conducted to verify quality of the membrane and determine if the pores are in the mesoporous range. After verifying membrane quality, oxygen/water vapor separation studies will be conducted at various relative humidities. The results from both MCM-48 and Al-MCM-48 membranes will be compared with sol-gel derived membranes reported in literature. Objective 2: Synthesis of ordered, oriented mesoporous membranes by Counter Diffusion Self Assembly in embedded membrane morphology The Counter Diffusion Self Assembly (CDSA) method of membrane synthesis is an extension of the Interfacial Fiber Synthesis technique under quiescent conditions. In the interfacial method for fiber synthesis, a silica source 26
phase (known as the oil phase) is poured over a water phase (acid + water + surfactant) [Huo et al., 1997]. In time, the silica source undergoes hydrolysis and diffuses into the water phase were it undergoes condensation around preexisting surfactant micelles to form fibers at the interface. These fibers contain ordered mesoporous channels that run helically around the fiber axes [Marlow et al., 2000].
The CDSA method for membrane synthesis, as stated earlier, is an
extension of this method. The methodology used to fabricate the membrane by the CDSA method is to place a support at the interface of an oil (silica source) and water system. The fibers are allowed to grow within the pores of the support to form an embedded membrane. It is, therefore, crucial to understand the effect of the different reactants involved and the environmental conditions on fiber formation and final morphology to be able to successfully fabricate membranes. So far, the effects of various silica sources and acid concentration on fiber morphology have been studied [Kleitz et al., 2001; Alsyouri et al., 2003]. However, the effect of silica source height and environmental conditions (i.e., humidity) have not been addressed. These are two potentially important parameters that affect the final morphology of the system. This knowledge will then be used towards synthesizing membranes by the CDSA method. It is also a well known phenomenon that once formed, mesoporous materials tend to shrink. This usually leads to the formation of defects within the membranes. As a result, membranes synthesized in the aforementioned manner
27
will be subjected to defect sealing procedures to make the membranes useful for future applications. For successful membrane synthesis, a fundamental study on fiber synthesis and defect sealing post-synthesis needs to be undertaken. Therefore, the objective of this section can be divided into three parts 1) Identifying the effect of silica source height and environmental humidity on fiber morphology and structure 2) Fabrication of membranes using the CDSA method and 3) Defect sealing in membranes using a liquid deposition technique. Part 1: Effect of silica source height and environmental conditions on fiber formation: In this study, tetrabutylorthosilicate (TBOS) will be used as the silica source since this has been reported to provide the best quality fibers [Kleitz et al., 2001]. The height of TBOS will be varied by changing mole ratios or interfacial area between the oil and water phases. The humidity in the environment will be changed by flowing air having different humidities above the system. The external morphology of the products will be studied by visual inspection and SEM imaging. The internal structure of the fibers will be studied using XRD, nitrogen porosimetry and TEM studies. Surfactant uptake studies will be conducted using TGA-DSC. This study will result in a better understanding of the fiber formation process and the effect of silica source height on fiber morphology and channel ordering. This is not only important towards gaining a mechanistic understanding, but will result in knowledge that will be useful towards synthesizing membranes using the CDSA method. 28
Part 2: Synthesis of ordered mesoporous membranes by the Counter Diffusion Self Assembly (CDSA) method: This work will focus on synthesizing embedded membranes using CDSA method to grow short silica fibers (plugs) in straight pore supports of varying surface chemistry (hydrophobic and hydrophilic). In this study, straight pore supports with large pore sizes that can also withstand the highly acidic conditions of fiber growth will be identified. Plugs will be grown within the pores of the supports by the CDSA growth technique. The quality of the plugged membranes will be evaluated using SEM images. In addition, oxygen permeation experiments with constant transmembrane pressure will be conducted to characterize the overall quality of the membranes. The internal microstructure of the plugs will be studied using XRD, nitrogen porosimetry and TEM studies. Part 3: Defect sealing in membranes by liquid deposition techniques: Any defects that are present in membranes grown by the CDSA method will be sealed using liquid deposition methods. Studies will be undertaken to identify the best method to seal defects by using liquid silica source precursors (i.e., TMOS, TEOS, TBOS etc). Towards this, two novel methods will be attempted to seal the defects. The first method is a Counter-diffusion Liquid Deposition (CLD) method. Here, the membrane will be held at the interface between a silica source phase and acidified water. The precursors are expected to inter-diffuse and react at the defect sites. Subsequently, microporous silica will be deposited at these sites, effectively sealing the defects.
Different precursors at different pH conditions will be
studied. Another method employed for defect sealing will be infiltration of silica 29
precursors into the defects followed by reaction with water vapor. The effect of various silica precursors and humidity levels will be evaluated. Any excess deposited silica on the membrane surface will have to be removed by wet etching. The membrane quality will be evaluated using SEM and single and multicomponent gas permeation studies. 1.6 Structure of the dissertation This dissertation consists of two parts. Chapter 2 focuses on the synthesis and water vapor/oxygen separation study in supported MCM-48 and Al-MCM-48 membranes.
Chapters 3-5 focuses on the synthesis of defect free oriented
mesoporous membranes in the embedded membrane morphology. In Chapter 2, hydrothermal synthesis of MCM-48 and Al-MCM-48 is discussed.
The
performance of the membranes in terms of water vapor/oxygen separation has been evaluated. In Chapter 3, the effect of silica source height and humidity on fiber morphology and microstructure is evaluated. Chapter 4 discusses various configurations for synthesis of oriented mesoporous membranes by the CDSA method. Key factors that affect membrane formation are also discussed. Chapter 5 reports on the study of liquid deposition techniques used to seal defects in CDSA grown membranes. Post defect sealing, excess silica wet etching and membrane quality testing is reported. Chapter 6 summarizes the work reported in this dissertation and discusses future directions for morphology and microstructure control in ordered mesoporous materials and membranes
30
Chapter 2 SYNTHESIS AND WATER VAPOR SEPARATION PROPERTIES OF ALUMINA SUPPORTED SILICA AND ALUMINOSILICATE MCM-48 MEMBRANES 2.1 Introduction Ordered mesoporous materials, as discussed in Chapter 1, are synthesized by the surfactant-templated self-assembly method [Kresge et al., 1992]. MCM-48 is a member of the M41S family characterized by an ordered cubic pore structure, with 2.5 nm pores and high surface areas [Zhao et al., 1996]. It is prepared by the alkaline synthesis pathway using the ionic surfactant cetyltrimethyl ammonium bromide (CTAB). The synthesis and application of MCM-48 membranes have received considerable attention in recent years. The most widely used technique to synthesize these materials, in support membrane morphology, is the hydrothermal synthesis method. In this Chapter, synthesis and characterization of both MCM-48 and a new Al-MCM-48 type membrane is discussed. One potential application for water vapor-oxygen separation using these membranes has been studied. To understand the reasoning behind using MCM-48 membranes, it is necessary to understand the separation processes involved in inorganic membranes. The first part of the introduction will, therefore, go over the different types of separation mechanisms in inorganic membranes. Separation is governed by the type of gas transport that dominates a given membrane. The basic mechanisms have been identified as activated diffusion [Lin et al., 2001], 31
Knudsen diffusion [Fosmoe and Hench, 1992; Lin and Burggraaf, 1991], surface diffusion [Sloot et al., 1992] and viscous flow [Lin and Burggraaf, 1993]. Activated diffusion is seen to dominate in microporous membranes (dp < 2 nm) and viscous flow is observed in macroporous membranes (dp > 50 nm). On the other hand, Knudsen type behavior is predominately seen in mesoporous membranes (2 > dp > 50 nm). Theoretically, the best separation factor that can be achieved by a mesoporous membrane in which Knudsen diffusion is the governing mechanism, is equal to the ratio of the inverse square roots of the molecular weights of the gases being separated. Functionalizing mesoporous membranes with organic molecules to improve separation factor has become a popular technique to enhance separation. This, however, increases separation factors but at the expense of permeation flux [Kumar et al., 2010]. Another major transport mechanism that is observed in membranes is capillary condensation which may lead to much higher separation factors than Knudsen diffusion in gas-vapor systems.
Here, vapor can be
condensed in the pores of a membrane at relatively lower pressure, resulting in a higher permeation flux for the vapor while blocking the flow of the noncondensable gas [Uhlhorn et al., 1992]. Capillary condensation of vapor has been shown to enhance separation factors in numerous studies conducted on mesoporous membranes [Tokay et al., 2009; Farooq et al., 2007; Elkamel and Noble, 1992; Sperry et al., 1991]. Studies have been carried out to model the behavior of condensable vapors and reveal the feasibility of capillary 32
condensation for separation [Uchytil et al., 2003]. This mechanism of vapor–gas separation in mesoporous systems has indicated much promise. One such promising area is dehydration of humid gas streams. Dehydration is of interest in areas such as air conditioning [Zhang, 2006], desalination processes [Arabi and Reddy, 2003] and flue gas processing [Sijbesma et al., 2008]. While air conditioning has traditionally used cooling systems or adsorbents to remove moisture from air, these processes are now becoming obsolete due high energy requirements, fouling and hygiene related concerns. Membranes are now emerging as a particularly favorable alternative for air conditioning systems as they are proving to be more cost effective [Zhang, 2006; Peinemann et al., 2006]. It has been proposed that water vapor can be removed from air containing a high relative humidity by passing the humid air over a membrane. Water vapor is removed from this stream by using a purge stream containing a lower water vapor partial pressure relative to the feed. The purge stream may consist of dry air from the area being air conditioned [Zhou et al., 2004; El-dessouky et al., 2000; Bonne et al., 1990]. One important performance criteria for the membrane is the water vapor seperation factor of membrane with respect to oxygen. Though this has been extensively studied in polymer membranes, few studies have been conducted using inorganic membranes. Early studies by Asaeda et al. [Asaeda et al., 1986] have shown that water vapor separation can be brought about in silica–alumina composite membranes. 33
Pan et al. [Pan et al., 1999] and Cooper and Lin [Copper and Lin, 2002] have demonstrated that sol-gel derived -alumina membranes can be used to dehumidify air. By bringing about capillary condensation of water vapor in the pores of the membrane, the condensate was able to reduce oxygen transport through the membrane, leading to high separation factors. Pan et al. [Pan et al., 1999] reported that CVD modified -alumina membranes exhibited a water vapor/oxygen separation factor as high as 71 at 12% relative humidity with a water vapor permeance of 6.9×10⁻⁷ mol/m2Pas. Cooper and Lin [Cooper and Lin, 2002] observed a water vapor permeance ranging from 1.5x10⁻⁶ mol/m2Pas to 3.0x10⁻⁷ mol/m2Pas, and an oxygen permeance ranging from 1.7×10⁻⁷ mol/m2Pas to 1.5×10⁻⁹ mol/m2Pas with water vapor/oxygen separation factors as high as 140 at room temperature. It has been reported that a 3 times CVD modification of the membrane was needed to bring the pore size down from 3.6 nm to 1.8 nm in order to achieve good separation. This is a time consuming and cost intensive process. It is expected that a membrane having a smaller pore size and a more narrow pore size distribution would be a more efficient system for dehumidification than CVD modified -alumina membranes. Ordered mesoporous MCM-48 are precisely suited for this application given their well defined pore diameter (~2.5 nm) and narrow pore size distribution. It is expected that these membranes will demonstrate better separation
capabilities
than
-alumina
membranes
for
dehumidification
applications, as they have a smaller pore size and narrower pore size distribution 34
without the need for any CVD modification. While some studies have reported the adsorption and capillary condensation of water in ordered mesoporous material powders [Oh et al., 2003; Inagaki et al., 1998; Ohashi et al., 1999], to our knowledge, no study has been reported on the dehumidification of air by ordered mesoporous inorganic membranes. Also, studies have shown that water adsorption in a silica matrix increases with a greater number of OH bonds within the matrix [Naono et al., 1980; Morimoto et al, 1971]. Therefore, it is believed that, to improve adsorption properties of the mesoporous material, Al can be incorporated into the siliceous matrix. This addition induces defects in the matrix and gives rise to Si-OH-Al bonds leading to higher number of OH groups within the amorphous walls and a more acidic system [Go´ra-Marek et al., 2006; Russo, 2008]. Aluminosilicate MCM-48 (coded Al-MCM48) membranes are therefore also expected to offer better water vapor separation properties and stability than pure silica MCM-48 membranes for dehumidification applications. Furthermore, no work has been reported on synthesis of Al-MCM-48 membranes. In this study both supported MCM-48 and Al-MCM-48 membranes have been fabricated using the hydrothermal synthesis method. The water vapor/oxygen separation properties of both membranes will be compared to determine which type provides the best separation characteristics.
35
2.2 Experimental 2.2.1 Support preparation Macroporous α-alumina support disks were prepared by pressing alumina powder (A16 powder; Alcoa, TX) followed by sintering at high temperature [Alsyouri, 2004]. The supports fabricated were 20 mm in diameter and 2 mm in thickness with a pore size approximately 0.2 µm. 2.2.2 Synthesis of MCM-48 membranes Silicate MCM-48 (MCM-48) membranes were prepared by combining the procedures used by Huang et al. [Huang et al., 2005] and Kumar et al. [Kumar et al., 2008]. The molar composition of the gel used to synthesize the membrane was 1.0 TEOS/0.65 CTMABr/0.50 NaOH/62 H2O. Porous -alumina supports were covered on one side with Teflon tape to prevent growth of the membrane on that particular side.
The support was then placed in 11.2 mL of
tetraethylorthosilicate (TEOS, 98%, Sigma Aldrich) for 30 min. 1.098g NaOH (97+% reagent grade, Sigma Aldrich) and 56 mL of deionized water were then mixed with 12.00 g of CTMABr (Sigma Aldrich) and stirred for 10 min. The mixture was combined with the TEOS and the resulting gel solution and support were stirred for 1.5 h. The disk was then transferred to a Teflon autoclave. The gel solution was poured over the membrane before sealing the autoclave. The system was heated in an oven at 100°C for 4 days. Al-MCM-48 with a Si/Al ratio of 30 was used for this work, as other studies have indicated that this ratio has the highest stability with a minimal 36
amount of structural loss [Galarneau et al., 2006]. Here, aluminum sulfate was used as the aluminum source. The gel composition used was 1.0 CTAB/2.5 TEOS/1.5 NaOH/0.04 AlS/244 H2O [Oye et al., 1999]. The support was covered with Teflon tape on one side and placed in 21.3 g of TEOS for 30 min. 14.9 g of CTAB was dissolved in 180.2 g of distilled water and 2.48 g of NaOH and the temperature of the solution was maintained at 36oC. This solution was then combined with the TEOS and, after stirring for 5 min, 1.1 g of aluminum sulfate (AlS, 98+%, Sigma Aldrich) was added. The solution was stirred for 55 min and the gel was transferred to a Teflon lined autoclave. The autoclave was placed in an oven at 100oC for 3 days. The surfactant was extracted from both MCM-48 and Al-MCM-48 membranes using an EtOH/HCl solution containing 250 mL EtOH and 3.5 g of 37% HCl, kept at 100°C for 24 h. 2.2.3 Membrane characterization XRD (Bruker D8 Focus, CuKα) was used to determine the structure of the MCM-48 and Al-MCM-48 membranes. The membrane thickness and quality were determined using scanning electron microscopy (SEM, FEI XL30) images. EDS measurements were made to determine the composition of the membranes and the thickness of the mesoporous layers. The pore size of the material was analyzed using nitrogen adsorption porosimetry (Micromeritics, ASAP2020). Membrane quality and gas permeation properties were tested using unsteady state permeation with helium, nitrogen, oxygen and carbon dioxide gases for the supports and synthesized membranes. 37
2.2.4 Water vapor separation studies A multigas separation apparatus was set up to measure the water vapor separation properties of the membranes. Figure 2.1 shows a schematic of this apparatus. The membranes to be studied were placed in a stainless steel membrane cell and were exposed to air containing water vapor at various relative humidities on the feed side and dry nitrogen on the sweep side. The flow rate of the feed stream was maintained at 100 cc/min. The humidity of the inlet stream air varied from 10 to 100 % in 15% increments by mixing the water saturated air with dry air. The N2 purge stream was maintained at a flow rate of 25 cc/min. At each inlet relative humidity, the system was left undisturbed for an hour to allow the system to reach equilibrium. The relative humidity of the inlet and outlet streams was measured using a thermohygrometer (Cole Palmer, 37950-11). The oxygen content of the streams was measured using an oxygen sensor (6000 Oxygen Analyzer, Illinois Instruments).
38
9
Air + water vapor
7 3
8
5
4
9 3
Air + water vapor
Air + water vapor 8
5
5
6
1
10
2
1. Nitrogen, 2. Air, 3. Mass flow controllers, 4. Valve, 5. Three way valve, 6. Bubbler 7. Membrane, 8. Membrane Cell, 9. Oxygen/Humidity sensor holder, 10. Sensor
Figure 2.1: Multicomponent set up for water vapor separation The permeance of oxygen and water was calculated as the permeation flux of the respective species divided by the transmembrane partial pressure of the species. The separation factor was then calculated as the ratio of the water to oxygen molar fraction in the outlet of the permeate to that in the retentate. 2.3. Results and Discussion 2.3.1. Membrane characterization XRD patterns of MCM-48 and Al-MCM-48 prepared in this work are shown in Figures 2.2a and 2.2b. Both patterns reveal the diffraction peaks (211) and (220), which are characteristic of MCM-48 materials and can be indexed in the space group Ia3d [Kosslick et al., 1998; Danumah et al., 2001]. The d211 and 39
d220 reflections occur at approximately 2 values of 2.5 and 2.9 respectively in both MCM-48 and Al-MCM-48 membranes. The ratio of d220/d211 ranges from 0.86 to 0.87, which is a characteristic of cubic symmetry [Kosslick et al., 1998; Danumah et al., 2001]. It is noticed that the diffraction peaks are more defined in the case of the MCM-48 membranes. The incorporation of aluminum in the framework is seen to reduce the structural ordering of the membrane, as evidenced by the less defined pattern in the case of Al-MCM-48 membranes [Huang et al., 2008]. The SEM micrographs of the cross-section of the MCM-48 and Al-MCM48 membranes are shown in Figures 2.3a and 2.3b respectively. A uniform membrane is formed in both cases. The micrographs show a thickness of around 25 µm for the MCM-48 membrane, and approximately 45 µm for the Al-MCM48 membranes. EDS analysis was conducted on the Al-MCM-48 membrane to determine the aluminum and silicon concentration profiles through the membrane. Figure 2.4 shows the atomic distribution of Si and Al in the membrane. The profiles can be divided to two regions. In the region of about 45 µm from the surface, which is the Al-MCM-48 layer, the Al/Si ratio is about 0.1. The ratio is reversed in the region beyond the first 45 µm, clearly indicating this to be the alumina support. The ratio of Al/Si in the membrane is much higher than the composition of the gel solution (~0.03). It is possible that aluminum from the support migrated into the silica matrix during membrane synthesis, as is
40
commonly seen in zeolite membrane synthesis on -alumina supports [Kanezashi et al., 2006].
Intensity
211
220
2
3
4
5
6
7
8
9
10
7
8
9
10
(a)
Intensity
211
220
2
3
4
5
6
(b) Figure 2.2: a) XRD pattern for a MCM-48 membrane and b) Al-MCM-48 membrane 41
Single gas permeation experiments were conducted to determine the quality of the synthesized membranes. The N2 permeance of the as-synthesized membranes (without CTAB removal) was measured to be less than 3x10⁻⁹ mol/m2Pa·s, about 3 orders of magnitude smaller than that for the support. This indicates good quality membranes were synthesized, with the presence of very minor defects. Figures 2.5 and 2.6 shows the permeance of the support and the extracted
(surfactant
removed)
MCM-48
and
Al-MCM-48
membranes
respectively as a function of He pressure across the membrane. The permeance of the support is seen to be highly dependent of He pressure. This is indicative of viscous flow, which is seen in macroporous membranes.
42
MCM-48
Support
(a)
Al-MCM-48
Support
(b)
Figure 2.3: a) SEM micrograph of a) MCM-48 membrane and b) Al-MCM-48 membrane. Both figures show a uniform thickness for each membrane. 43
Counts
Al
Si
0
20
40
60
80
100
Distance from Surface (m)
Figure 2.4: Cross sectional EDS for an Al-MCM-48 membrane, which shows the change in silica and alumina content from the surface of the membrane into the support. The MCM-48 and Al-MCM-48 showed a He permeance of approximately 7x10⁻⁸ mol/m2Pas and 3x10⁻⁸ mol/m2Pas respectively. This permeance is lower than the permeance reported for MCM-48 membranes in previous studies [Kumar et al., 2006; McCool et al., 2003]. This can be attributed to the fact that the membranes synthesized in this study were 2-10 times thicker than the membranes synthesized in other reported work. Unlike the -alumina supports, MCM-48 and Al-MCM-48 membranes show very little dependence on He pressure. This result is typical of Knudsen type flow, which is expected to dominate in mesoporous membranes.
44
4.0
2
Permeance (10 mol/m .Pa.s)
3.0
2.0
-7
Support Support+ Extracted Membrane Membrane
1.0
0.0 150
200
250
300
Pressure Difference (kPa)
(a)
6.0 5.0 4.0 O2
3.0
N2
-8
2
Permeance (10 mol/m .Pa.s)
He
2.0 1.0 0.0 0.0
0.1
0.2
0.3
1/MW
0.4
0.5
1/2
(b) Figure 2.5: a) He permeance of support, support + extracted MCM-48 membrane and membrane showing that good quality membranes were synthesized and b) molecular weight dependencies of single gas permeance data 45
4.0
2
Permeance (10 mol/m .Pa.s)
3.0
-7
Support Support +Extracted Membrane Membrane
2.0
1.0
0.0 150
200
250
300
Preassure Difference (kPa) (a)
He 6.0
4.0
-8
2
Permeance (10 mol/m .Pa.s)
8.0
CO2
N2
2.0
0.0 0.0
0.1
0.2
0.3
1/MW
0.4
0.5
1/2
(b) Figure 2.6: a) He permeance of support, support + extracted Al–MCM-48 membrane and membrane showing that good quality membranes were synthesized and b) molecular weight (b) dependencies of single gas permeance data 46
Furthermore, when Knudsen flow is dominant, the permeance is proportional to the inverse square root of the molecular weights of the permeating gases [Mulder, 1991]. To verify that the membranes are truly mesoporous in nature, single gas permeance tests with various gases were performed. Figure 2.5b and 2.6b show the single gas permeance through the MCM-48 and Al-MCM-48 membranes for various species. The linear dependence of permeance on the inverse square root of the molecular weight of the permeating species further confirms Knudsen behavior in the membrane. This reveals that the membrane is truly mesoporous in nature with the absence of macroporous defects. 2.3.2 Water vapor/oxygen separation properties of MCM-48 and Al-MCM-48 membranes Water permeance and water vapor/oxygen separation factor of a membrane are directly related to the dehumidification ability of the membrane. Figure 2.7 shows a representative plot of water vapor/oxygen separation studies carried on MCM-48 membranes. The permeance of water vapor shows an initial decrease and then remained constant with relative humidity increase. The permeance of water vapor is around 1x10⁻⁷ mol/m2Pas. Conversely, O2 permeance remains constant at low relative humidities and began to decrease rapidly at about 60% RH. The rapid decrease is due to capillary condensation of water, which has been shown to occur at a relative humidity of 60% in MCM-48 type membranes [Oh et al., 2003].
The oxygen permeance decreases from 47
approximately 2x10⁻⁸ mol/m2Pas at low relative humidities to about 5x10⁻⁹ mol/m2·Pa·s at a relative humidity of 90%. Capillary condensation fills the pores with condensed water. Because the solubility of oxygen in water is low, transport of oxygen through the membrane is hindered, hence resulting in low oxygen fluxes. The results of studies conducted on Al-MCM-48 membranes are summarized in Figure 2.8. Here, water vapor permeance deceases slightly, then remains relatively constant, ranging from 4x10⁻⁸ mol/m2Pas to 6x10⁻⁸ mol/m2Pas. The oxygen permeance remains relatively constant, until a relative humidity of 60%, and then begins to decease sharply from 4x10⁻⁹ mol/m2Pas to 4x10⁻¹⁰ mol/m2Pas.
48
Water Vapor Oxygen
2
Permeance (mol/m .Pa.s)
1E-6
1E-7
1E-8
1E-9 10
20
30
40
50
60
70
80
90
100
RH%
Figure 2.7: Binary water vapor and oxygen permeance for a MCM-48 membrane at different relative humidities
Water Vapor Oxygen
1E-6
2
Permeance, mol/m .Pa.s
1E-7
1E-8
1E-9
1E-10 0
20
40
60
80
100
RH% Figure 2.8: Binary water vapor and oxygen permeance for an Al-MCM-48 membrane at different relative humidities
49
160 Al-MCM-48 Si-MCM-48
120 100 80
Seperation factor
140
60 40 20 0 0
20
40
60 RH%
80
100
Figure 2.9: Water vapor to oxygen separation factor for Al-MCM-48 and MCM48 membranes The water vapor to oxygen separation factor for both membranes is plotted in Figure 2.9. For the MCM-48 membrane, initially, the separation factor remains constant at a value of about 5. However, it increases rapidly to 17 at relative humidity of 60%.
For the Al-MCM-48 membrane, the separation factor is
constant at a value of 10 up to a relative humidity of 60%. It rapidly rises to 142 at relative humidity of 95%. This value is 8 times greater than the highest separation factor achieved in the MCM-48 membranes obtained in this work. The higher separation factor for Al-MCM-48 membrane than MCM-48 is clearly related to aluminum content in the membrane layer. Several studies have shown that the incorporation of aluminum into the framework of MCM-48 can increase the number of acid sites and silonol groups in material [Go-ra-Marek and Datka, 50
2006; Russo et al., 2008]. This brings about an increased adsorption capacity for polar molecules, and hence, a higher concentration of adsorbed water in the membrane layer. As a result, Al-MCM-48 membrane offers higher water vapor permeance. 2.3.3 Comparison with -Alumina membranes Table 2.1 shows the results of the dehumidification study using MCM-48, Al-MCM-48 and γ-alumina membranes respectively. It is seen that the separation factor obtained for MCM-48 membranes in this work is 17. This value is slightly higher than that reported for fresh -alumina membranes by Cooper and Lin [Cooper and Lin, 2002]. The separation factor is, however, similar to that of one time CVD modified -alumina membranes. It was reported that the pore size of the one time CVD modified -alumina membranes was 2.2 nm. This pore size is similar to the pore size of MCM-48 (2.3 nm), thus explaining the similarity in separation factors. However, it was found that the one time CVD modified alumina membrane experienced a drop in oxygen permeance, beginning at low relative humidities and progressively declining as the relative humidity was increased. On the other hand, for MCM-48 membranes, the oxygen permeance is relatively constant at 2x10⁻⁸ mol/m2Pas until a relative humidity of 60% was reached. Beyond this, a sharp drop in oxygen permeance is observed. This difference can be attributed to the fact that MCM-48 type materials have a more uniform and narrow pore size distribution than -alumina. Therefore capillary condensation in MCM-48 occurs in most of the pores at the same relative 51
humidity, filling the majority of the pores. This results in a sharp decrease in oxygen permeance as seen in Figure 2.7. In the case of Al-MCM-48 membranes, a maximum separation factor of 142 is achieved. This value is higher than the highest separation factor of 135 reported by Cooper and Lin for the three time CVD modified -alumina membrane. As seen previously, the drop in oxygen permeance for Al-MCM-48 was more pronounced at relative humidities of 60% and higher. The higher separation factor is due to the more hydrophilic pore surface and narrower pore size distribution of Al-MCM-48 than the CVD modified -alumina membranes. Table 2.1: Properties of MCM-48, Al-MCM-48 and γ-alumina membrane at maximum separation factor Number of CVD Modifications
Pore Size (nm)
alumina*
0
MCM48**
Membrane
Permeance (mol/m2Pas)
H2O/O2
RH% At maximum H2O/O2
Reference
O2
H2O
3.6
~2x10⁻⁸
~3x10⁻⁷
15
90
Cooper et al. 2002
0
2.3
5x10⁻⁹
1x10⁻⁷
17
90
This work
alumina*
1
2.2
~3x10⁻⁸
~3x10⁻⁷
17
75
Cooper et al. 2002
alumina*
3
1.8
~2x10⁻⁹
~3x10⁻⁷
135
100
Cooper et al. 2002
Al-MCM0 2.0 48*** Membrane Thickness * -alumina = 6 µm ** MCM-48= 25µm *** Al-MCM-48= 45µm
~4x10-
6x10⁻⁸
140
95
This work
10
52
It is observed from Table 2.1 that the water vapor permeance of the onetime CVD modified γ-alumina membrane and MCM-48 are similar in spite of the MCM-48 membrane being thicker. The water permeance in the Al-MCM-48 membrane is five times lower than the γ-alumina membrane. The can be attributed to the fact that the Al-MCM-48 membrane is about 8 times thicker than the -alumina membrane. It is expected that if the Al-MCM-48 membrane is made slightly thinner, it would result in a water permeance that is close to, if not better than, the 3 times CVD modified membrane.
The Al-MCM-48 membranes
therefore provide enhanced water vapor separation properties using less complicated synthesis procedures. 2.4. Conclusions High quality supported MCM-48 and Al-MCM-48 membranes were synthesized via the hydrothermal synthesis method on -alumina supports and tested for the separation of water vapor from oxygen. MCM–48 membranes exhibit a maximum water vapor to oxygen separation factor of 17 with a water permeance of 1x10⁻⁷ mol/m2Pas, whereas the more hydrophilic Al-MCM-48 membranes offers a water vapor to oxygen separation factor of 142 with a water permeance of 6x10⁻⁸ mol/m2Pas. These ordered mesoporous silica membranes show better water vapor to oxygen separation properties due to their smaller and more uniform pores and narrow pore size distribution than the sol-gel derived alumina membrane. Therefore these membranes offer potential for applications in air dehumidification applications. 53
Chapter 3 ORDERED MESOPOROUS SILICA FIBERS: EFFECT OF SILICA SOURCE HEIGHT AND ENVIRONMENT ON FIBER MORPHOLOGY AND FIBER LENGTH UNDER QUINCENT UNMIXED CONDITIONS 3. 1 Introduction: In the previous chapter, the synthesis of membranes with a cubic pore structure in supported morphology was discussed. These membranes, though they have an ordered pore structure, do not have straight through pores. As mentioned in Chapter 1, membranes with straight through pores are of great interest for the flux benefit and numerous application scenarios they would generate.
This
Chapter, along with the subsequent two chapters, deal with synthesis and characterization of membranes with straight though pores in embedded morphology. Recently, a novel counter diffusion self-assembly (CDSA) method for preparation of perpendicularly oriented mesoporous silica membranes was reported [Alsyouri et al., 2006]. The CDSA method is an extension of the interfacial synthesis method for synthesizing ordered mesoporous silica fibers containing a large number of ordered, 2.5 nm pores aligned helically across the fiber axis. In the CDSA method, a porous support is placed at the interface of water and silica precursor phases. The precursors are expected to inter-diffuse through the support pores and the silica is expected to condense around the diffused micelles to form fibers (which will be referred to as plugs) within the 54
pores of the support. A schematic of the interface in the interfacial method for fiber formation and the CDSA concept is shown in Figure 3.1. Since the microscopic and macroscopic ordering within the plugs in the membranes synthesized by CDSA method is dependent on the fiber formation, in order to be able to fabricate good quality membranes, it is vital to understand the various factors that affect fiber synthesis. This Chapter aims at sheading more light into factors affecting fiber formation. Specifically, the effect of silica source (TBOS) height and environment on fiber macroporous and microporous characteristics will be studied.
Silica Source
Silica Source
Support Water Phase
Water Phase
(a)
Fibers (plugs) from in support pore
(b)
Figure 3.1: Scehmatic representation of (a) interfacial method for fiber growth and (b) the CDSA concept The acid based interface synthesis of mesoporous systems were first reported by the Stucky group in 1997 [Schacht et al., 1996]. The advantage of using an acid based synthesis system was the ease with which numerous morphologies and pore connectivities could be produced. Since the initial 55
proposition, a number of different morphologies have been developed such a spheres [Ozin et al., 1997], gyroids [Yang et al., 1999], ropes [Lin et al., 2000], rods [Schmidt-Winkle et al., 1999] etc.
Of these, the synthesis of fibrous
morphology has gained particular interest, as this unique morphology offer applications such as electrophoresis, polymer synthesis, VOC removal [Chu et al., 2002] and laser materials [Marlow et al., 2000]. A number of different synthesis procedures have been developed using both acidic and basic pathways to form fibers of various pore connectivities ranging from straight through pores [Wang et al., 2003], to helixes [Yuan et al., 2010] and even hollow tubes with radial pores [Yu et al.,2008]. While most fiber synthesis procedures call for a well-mixed system, Huo et al. 1997 reported the synthesis of mesoporous silica fibers under quiescent unmixed conditions. In this method, an oil phase (consisting of a silica source and a diluting oil in some cases) was allowed to stand on a water phase (consisting of water, acid and surfactant). Over a period of time, the silica source diffused into the water phase, where it underwent hydrolysis and condensation around surfactant micelles to form fibers. These fibers formed were 100 μm - 5 cm long and had a circular cross-section ranging from 1 to 15 μm in diameter. Subsequently, the procedure for making silica fibers was extended using various different silica sources under different configurations [Kleitz et al., 2001]. It was observed that best quality silica fibers were obtained with the use of Tetrabutlyorthosilicate (TBOS) as the source. TEOS and TPOS were also noted to 56
yield fibers when a mixture of silica source and CCl4 was used. The percentage of fibers formed was, however, seen to be lower than that observed for the TBOS systems. The pore architecture studies using TEM, XRD and optical studies suggested that, for all sources, the channels wound around the fibers longitudinal axis. Alsyouri et al., [2003] also investigated the effects of growth times, acid type and concentration, and temperatures conditions on the microscopic and macroscopic properties of the fibers. It was reported that a increase in acid concentration speeds up the formation of silica and may produce amorphous, nonfibrous particles instead of ordered fibers. Under controlled conditions, the average diameter of the fibers becomes larger with a broader distribution for samples with longer growth time. Silica yield was also reported to increase linearly with growth time. So far, fiber synthesis studies have looked at the effect of the type of source (by changing the alkoxysilanes) and acid on fiber morphology. All of these studies have reported that the controlling factor for fiber formation is primarily the rate of diffusion of the source and secondly its hydrolysis and polycondensation around preexisting micelles. If diffusion was the only limiting step, than it would stand to reason, that by providing larger quantities of silica source longer fibers can be formed. This would make the tuning of the silica source concentration a very powerful tool for fiber synthesis. Yet, no studies have dealt with the effect of silica source concentration on fiber microstructure, morphology or length of fibers formed. This system is also interesting from the 57
standpoint that initially it is a two phase oil-water interface system. As the reaction progresses and the oil phase reacts completely and diffuses into the water phase, the system changes to an air-synthesis mixture interface system. This allows us to study the effect of humidity in the environment on the microstrusture and morphology of the fibers formed. In this study we investigate the effect of silica source height and the effect of the humidity of the environment on product morphology. 3.2. Experimental 3.2.1. Effect of silica source concentration, height and interface area on fiber formation Mesoporous silica fibers were synthesized using the procedure reported previously [Huo et al., 1997]. In this study, cetyltrimethylammonium bromide (CTAB) (Aldrich) was used as the surfactant and tetrabutylorthosilicate (TBOS) (Aldrich) was the silica source. In a typical synthesis procedure, the ratio of reactants used is 1.0 TBOS: 0.5 CTAB: 58.4 HCl: 2000 H2O. The surfactant was first dissolved in water, then the acid was added to the water phase. This mixture was then poured into a bottle where the silica source was added gently, without mixing, to form a thin layer on top of the water phase. The system was left undisturbed and allowed to age for 14 days. To determine the effect of silica source, the mole ratio of TBOS was varied from 0.28 to 12. The corresponding height of silica source in the bottles were 0.013 cm, 0.025 cm, 0.065 cm, 0.130
58
cm and 0.586 cm respectively. The interface area for these experiments remained constant at 15.34 cm2.
H
TBOS
Water Phase
Figure 3.2: Schematic representation of the experiments with various mole ratio of TBOS keeping the interface area constant To investigate the effect when the reaction interface area was changed, a similar experiment was conducted where the interface area was decreased to 6.35 cm2. Accordingly, the effect of various mole ratios was studied, thus showing the results for changes in both silica height as well as interface areas. For this set of experiments, the silica mole ratio was varied from 1 to 48. The height of the silica source in these experiments was 0.031 cm, 0.060 cm, 0.157 cm, 0.314 cm and 1.415 cm. A final test was then conducted in which the ratio was maintained at 1.53 TBOS: 0.5 CTAB: 58.4 HCl: 2000 H2O, but the reaction vessel diameter was varied. The interface areas used were 16.69cm2, 57.03 cm2, 83.11 cm2, and 285.02 cm2. Correspondingly, the silica source height in each vessel was 0.72 cm, 0.21cm, 0.14 cm and 0.04 cm. The system was left undisturbed and allowed to age for 7 days.
59
TBOS
H
Water Phase
Figure 3.3: Schematic representation of the experiments with various interface areas keeping mole ratio of TBOS constant The combined effect of these experiments was to study the effect of mole ratio from 0.3 to 48 and the effect of heights from 0.013 cm to 1.41 cm. This allowed for the investigation of both mole ratio and height of TBOS on fiber formation. Table 3.1 summarizes the various conditions at which fiber synthesis was studied.
60
Table 3.1: Various conditions under which synthesis of fibers is studied Volume of TBOS (mL) 0.20 0.38 1.00 2.00 9.00 0.20 0.38 1.00 2.00 9.00 12.00 12.00 12.00 12.00
Mole Ratio of TBOS 1.06 2.01 5.30 10.60 47.72 0.28 0.54 1.41 2.83 12.73 1.54 1.54 1.54 1.54
Interface Area (cm2)
6.35
15.34
16.69 57.03 83.11 285.02
Height of TBOS (H) (cm) 0.031 0.060 0.157 0.315 1.416 0.013 0.025 0.065 0.130 0.587 0.719 0.210 0.144 0.042
The products were collected, washed with water and allowed to dry at room temperature. The surfactant was then be removed by calcining the fibers at 550C for 6 hours. 3.2.2 Effect of environmental humidity To study the effect of humidity on fiber formation, the typical mole ratio for synthesis of fibers (1.0 TBOS: 0.5 CTAB: 58.4 HCl: 2000 H2O) was used. The procedure followed for fiber synthesis was the same as reported above. Once the silica source was added to the system, air with different humidities was circulated over the system at a flow rate of 8cc/min. The relative humidity of the outlet streams was measured every day using a thermohygrometer (Cole Palmer, 37950-11). The schematic for synthesis of fiber at controlled humidities is as shown in Figure 3.4. The system was allowed to stand for two weeks, at which 61
point the products were collected, washed with water, and allowed to dry at room temperature. The surfactant was removed by calcining the fibers at 550C for 6 hours.
1 4
2 3 1 Water Phase TBOS
1) 2) 3) 4)
Mass Flow Controller Bubbler Vessel for fiber growth Humidity sensor
Air
Figure 3.4: Schematic for fiber synthesis equipment at controlled humidities 3.2.3. Characterization Powder X-ray diffraction (XRD) patterns were obtained on a PANalytical X’Pert Pro Materials Research X-ray Diffractometer using CuKα radiation. XRD spectra were taken between 2θ of 1.5-10 and used to identify the phase structure and interplaner (d) spacing. Nitrogen adsorption-desorption measurements were performed on Micromeritics ASAP-2020. The samples were degassed at 200ºC for 4 hours and analyzed at 77 K. The adsorption isotherm was used to calculate the BET surface area and pore volume. The desorption isotherm was used to 62
obtain the pore size distribution from which the average pore diameter was calculated. Morphology and fiber diameter were studied by scanning electron microscopy (FEI XL30). TEM studies (JEOL JEM 2000FX) were undertaken to ascertain the presence of ordered pore channels within the products formed. TGA (TA Instruments SDT Q-600) experiments were conducted to evaluate the percentage of surfactant present in system. The measurements were carried out in air. A heating rate 1oC/min was used till the system reached 550oC and remained isothermal for 5 hours. The system was then cooled to room temperature at the rate of 1oC/min. 3.3. Results and Discussion 3.3.1. Effect of silica source ratio and height on product formation The interfacial method yields predominately three products: fibers, particulates and membranes. Based on the synthesis conditions, it is observed that the ratio of products formed varied. In the cases where the silica source height was between 0.013 cm and 0.144 cm, the water phase remains clear during the first two days. On the third day, fibers are observed to grow at the interface. As the height is increased from 0.157 cm to 0.315 cm, fibers are observed to grow at the interface only on day four. In the experiments where higher TBOS levels are used, no fibers are visible to the naked eye. In all cases, as the TBOS height increased, the thickness of the membrane layer also increased. But no correlation is observed between fiber formation and the mole ratio of reactants. It is also 63
observed that, in all cases, particulates are seen to precipitate at the bottom of the bottle on day three. The volume of precipitates (by visual inspection) was seen to increase with an increase in TBOS volume.
Another observation worth
mentioning is the length of the fibers tended to decrease with increasing silica source. The average length of the fibers observed for each of the experimental conditions is as shown in Table 3.2. The longest fibers observed have an average length of 3.5 cm when the TBOS height was 0.013 cm. The shortest fiber morphology that could be observed by the naked eye is 0.8 cm for the case when 0.587 cm of TBOS is used. The fiber lengths obtained are as listed in Table 3.2. Table 3.2: Length of fibers formed at different TBOS heights (H) and mole ratios Mole Ratio of TBOS 0.28 0.54 1.06 1.54 2.02 1.41 2.83 1.54 5.30 1.54 10.61 12.73 1.54 47.73
Height of TBOS (H) (cm) 0.013 0.025 0.031 0.042 0.060 0.065 0.130 0.144 0.157 0.210 0.315 0.587 0.719 1.416
Length of Fibers (L) (cm) 3.50 2.60 1.88 3.00 1.60 2.30 1.65 1.30 1.26 1.20 1.08 0.80 No fibers No fibers
The external morphology of the calcined products was studied using SEM. Figures 3.5a to 3.5n reveal the SEM micrographs of the fibers synthesized at 64
various silica source heights. The images are arranged in order of increasing height of TBOS. It is observed that fibers grown at lower TBOS heights have a smooth external surface, as seen in Figures 3.5a to 3.5d. These images correspond TBOS heights ranging from 0.013 cm to 0.042 cm. As the TBOS height is increased from 0.060 cm to 0.144 cm, the external morphology of the fibers is seen to become less smooth as revealed by Figures 3.5e to 3.5h. Here, there seems to be what looks like gyroids that are fused to each fiber. On further increasing the TBOS height (0.15 to 0.3 cm), the external surface reveals (Figure 3.5i to 3.5k) the presence of heavy deposits of silica on the fibers. From Figure 3.5l it is observed that, when a TBOS height of 0.587 cm is used, fibers begin to clump together with what appears to be silica that has no defined external structure. In the case where 0.719 cm and 1.416 cm of silica was used, no fibrous morphology is discernable (Figure. 3.5 m and 3.5n). For experiments when the lowest heights were used, the least amount of particulates are observed. This amount progressively increases with increase in silica height till the bulk of the material is seen to be particulate in nature. The length of the fibers, as seen from the SEM images, are not representative of the original length, as they tend to break during the collection process. Interestingly, no correlation was found between the diameter of the fibers and the height of TBOS, mole ratio or the interface area of the system.
65
a)
b)
ic 4
c )
d )
e )
f )
Figure 3.5: SEM micrographs of fibers synthesized at various TBOS heights a) 0.013 cm, b) 0.025 cm, c) 0.031 cm, d) 0.042 cm, e) 0.060 cm, f) 0.065 cm,
66
g )
h )
i)
j )
k )
l)
Figure 3.5: SEM micrographs of fibers synthesized at various TBOS heights g) 0.130 cm, h) 0.144 cm, i) 0.157 cm, j) 0.210 cm, k) 0.315 cm, l) 0.587 cm
67
n )
m )
Figure 3.5: SEM micrographs of fibers synthesized at various TBOS heights m) 0.719 cm, n) 1.416 cm The effect of mole ratio was studied by varying the ratio while keeping the interface area constant for two separate systems. The images corresponding to increased mole ratio for an interface area of 6.35 cm2 are 3.4c, 3.4e, 3.4i, 3.4k and 3.4n and for 15.35 cm2 are 3-4a, 3-4b, 3-4f, 3-4g and 3-4l. In both cases, the images seem to indicate that an increase in mole ratio resulted in fibers with less defined external morphology. However, when the SEM images from both systems are viewed together, it is clear that the external morphology progressively deteriorates as the height is increased. Therefore, it can be stipulated that the height of TBOS has a very profound effect on morphology, which is independent of the mole ratio used. To verify if this was indeed the case, the mole ratio was kept constant while the interface area was changed from 16.69 cm2, 57.03 cm2, 83.11 cm2 and 285.02 cm2. The fiber morphologies obtained in this case were also observed to change with a change in interface area. The correlation found here, again, was that, with decreasing interface area (i.e, increasing height of 68
TBOS layer), a lesser amount of fibrous products were obtained. SEM images revealed the same trend obtained for the previous two cases. At lower heights of TBOS, smoother fibers were observed. An increase in height of TBOS resulted in less smooth outer surfaces of fibers and an increase in particulate deposition. In all cases, there was no correlation found between mole ratio and morphology of the products. Therefore, it can be stated that the mole ratio of TBOS used and the interface area do not have an effect on the external morphology of the products. The results of nitrogen porosimetry studies conducted on a few chosen fiber systems is shown in Figure 3.6. The data in the figure corresponds to TBOS heights 0.031cm, 0.060 cm, 0.157cm, 0.315 cm and 1.416 cm. These points were chosen because they are distributed evenly throughout the range of heights studied and also because they correspond to the largest variation in height for a given interface area. In the first three cases, a typical type IV isotherm is observed which is characteristic of mesoporous materials with well-aligned channels [Alsyouri et al., 2003]. The first step in the adsorption isotherm is associated with the coverage of the inner surface with a monolayer of nitrogen molecules, while the second step is due to capillary condensation of nitrogen molecules in the cylindrical pores. The adsorption and desorption isotherms almost coincide with no hysteresis, which is a characteristic of mesoporous silica materials having small pore diameters. As the height of TBOS is increased, the hysteresis step is shifted further right showing the presence of larger pores. When TBOS heights of 0.315 cm and 1.416 cm were used, the hysteresis step at low relative pressures is 69
missing. This indicates the absence of cylindrical pores with a narrow pore size distribution.
On the other hand, the large hysteresis loop at higher relative
pressures indicates the presence of macropores with a wide pore size distribution [Inayat et al., 2010]. The average BJH mesopore size calculated from the desorption curve shows an increase in pore size from 2.2 nm to 3.7 nm, as shown in Table 3.3. The total surface area of the samples decreases from approximately 1500 m2/g to 369 m2/g for silica source heights between 0.031 cm and 1.416 cm. The micropore volume also decreases with increase in TBOS concentration.
500
0.031 cm 0.060 cm 0.157 cm 0.314 cm 1.415 cm
400 300
Quantity Adsorbed (cm³/g STP)
600
200 100 0 0.00
0.20
0.40
0.60
0.80
1.00
Relative Pressure (P/Po) Figure 3.6: Nitrogen adsorption-desorption isotherms for fibers synthesized at various TBOS heights
70
Table 3.3: Interplanar spacing and pore wall thickness, and N2 adsorptiondesorption results for the samples prepared at different TBOS heights TBOS Height (H) cm 0.031 0.060 0.157 0.314 1.415
Surface Area (m2/g)
Pore size (nm)
D spacing (nm)
Lattice parameter (nm)
Wall thickness (nm)
Pore Volume (cm3/g)
1529
2.2
4.12
4.75
2.49
0.65
1003 674 571 369
2.6 3.3 3.7 3.8
3.95 4.01 -
4.56 4.63 -
1.92 1.26 -
0.65 0.46 0.39 0.35
71
(b) 0.210
0.144
Intensity
0.157
0.130
0.065
0
1
2
3
4
5
6
7
8
9
10 11 12
(a) 0.060
0.031
Intensity
0.042
(100) (110)
x10
(200)
0.025 0.013
0
1
2
3
4
5
6
7
8
9
10 11 12
Figure 3.7: XRD patterns for fibers synthesized under various TBOS heights
72
Pore diameter (dp)
ao
Wall Thickness (wp) d100
Lattice Parameter (ap)= d100 x 2/√3 Wall thickness (wp)=ap-dp Figure 3.8: Evaluation of lattice parameter and wall thickness from the hexagonal pore arrangement Figures 3.7a and 3.7b show the XRD pattern for synthesized products. The XRD patterns have been arranged according to increasing TBOS height. The plots have been split into two parts, (a) and (b) to allow better visualization. The samples prepared using 0.013 cm to 0.144 cm of TBOS show the presence of three reflection peaks, indexed as (100), (110), and (200) planes. The indexed peaks verify the presence of long-range ordered within mesopores arranged inside the fiber. The structure is comparable to the p6mm hexagonal order observed in SBA-3 type material [Stempniewicz et al., 2007]. XRD patterns of samples prepared using 0.157 cm TBOS did not show the presence of any peaks indicating the absence of ordered channels with in the system. The hexagonal lattice parameter (ao), which represents the center-to-center spacing between mesopores, can be calculated from the d100 value, which is schematically shown in Figure 3.8. 73
The wall thickness (wp) for a few samples was evaluated from the lattice parameter (ao) and the pore diameter (dp) obtained from N2 sorption measurements.
The peak position, wall thickness and pore diameter are
summarized in Table 3.3. It is noticed that when 0.013 cm of TBOS is used, the XRD pattern shows the presence of an ordered structure. However, the wide (100) peak indicates a wider distribution of pore sizes. As the TBOS height is increased, the peaks become sharper and have higher intensity, showing improvement in structural ordering. This improved structure is observed between 0.025 cm and 0.06 cm of TBOS. Beyond this point, further increases in TBOS height result in progressively wider (100) peaks of diminishing peak intensity. This is indicative of a decrease in channel ordering. The XRD patterns reveal that the best channel order is seen for cases where the heights of TBOS were maintained between 0.025 cm and 0.144 cm. In the cases where more than 0.157 cm of TBOS was used, no peaks were observed. Internal structure investigation using TEM studies was conducted on samples obtained when TBOS heights of 0.031 cm, 0.060 cm, 0.157 cm, 0.315 cm and 1.416 cm were used. As with the porosimetry study, these points were chosen as they are distributed evening throughout the range of heights studied and correspond to the largest variation in height for a given interface area. TEM images (Figure 3.9a) reveal that a TBOS height of 0.031cm produced a highly ordered internal structure. The edges of the fibers are seen to have disordered worm-like structures which could be the result of rapid silica condensation. It is 74
seen that both 0.060 cm (Figure 3.9b) and 0.157cm (Figure 3.9c) of TBOS result in highly ordered parallel internal pore channels within the fiber. The TEM image of the fibers synthesized with 0.157 cm of TBOS reveal that, while the channels are aligned regularly within the fiber, this ordering does not extend all the way to the edge (Figure 3.9d). The edges of fibers look highly irregular and reveal high amounts of silica deposition with no channels running within. This lack of extended regularity is also observed in the XRD pattern, which shows a much wider peak. The results of the 0.315 cm TBOS fibers reveal the absence of extended channel ordering, though small sections of ordered channels could be seen. The TEM images for the 1.416 cm TBOS system (not included here) did not show any ordered pore channels. The TEM images also reveal that the wall thickness decreases with increasing silica source height. This was also confirmed from wall thickness data extracted from XRD and N2 sorption data.
75
b)
a)
(a)
( b)
c)
d)
Figure 3.9: TEM micrographs of fibers synthesized with a TBOS height of a) 0.031 cm, b) 0.060 cm, c) 0.157 cm and d) 0.315cm In the above experiments, four parameters have been varied viz. mole ratio, TBOS height, interface area for a given volume of TBOS and interface area for a given mole ratio. The results show that the volume and mole ratio TBOS and interface area do not have a significant impact on fiber morphology, length or long range order within the system. From the above studies it is obvious that both the macroscopic and microscopic properties of the silica fibers are influenced by 76
the increase in silica source height. It is observed that as the height increases, there is not only a change in external morphology, but also a decrease in structural ordering within the system. Futhermore, there is a decrease in percentage of fibers formed as the silica source height increases. As TBOS height is increased, the length of the fiber decreases.
Figure
3.10 is a plot of inverse length of fibers (by visual inspection in the synthesis system) versus the height of silica source used. The points in the figure represent the data while the curve represents an empirical fit to the data. The function fit to the data is shown in Equation 3.1. ⁄
(3.1)
where L is the fiber length (cm) and H is height (cm) of TBOS.
77
1.50 1/L= 1.47H
0.37
1.00 0.75
1/Length of fiber, cm
-1
1.25
Data point Emperical Model
0.50 0.25 0.00 0.0
0.1
0.2
0.3
0.4
0.5
0.6
0.7
Height of TBOS, cm Figure 3.10: Inverse length of fiber synthesized (1/L) versus Height of TBOS (H) It has been observed that increasing silica height causes a decrease of ordering within the system. This could result from two factors 1) increased condensation rate of silica due to higher concentration, without time for interaction with surfactant and restructuring or 2) non-availability surfactants at the interface. The long range ordering found in a system where a thin layer of silica is used could be easily explained by the simple reasoning that a thinner layer of TBOS would result in a larger probability of contact between the diffusing silica and surfactants. This encourages the formation of an ordered structure. However, traditionally it has been believed that the diffusion rate of the silica source and the subsequent hydrolysis and condensation rate are the rate limiting factors for fiber formation [Kleitz et al., 2001; Marlow et al., 2001]. It is also been suggested that the water phase is in excess and experiences less 78
diffusional resistances to reach the reaction interface; hence is not a limiting factor [Alsyouri et al., 2003]. If this were true, since the diffusion rate of the silica source into the water phase remains constant, using a higher volume of silica source should result in longer, thicker or a higher percentage of fibers. However, none of these effects were observed. The results obtained, however, indicate that the availability of water phase reactants could also be a limiting factor and has a significant impact on fiber formation. Furthermore, the results do not explain why longer fibers are formed with thinner silica layers. As a result, it is believed there must be other contributing factors that control fiber morphology. One of these factors could be the effect of environmental conditions, which would be significantly different for systems of various TBOS heights. The effect of evaporation on film formation for air-synthesis solution interface systems has been extensively studied [Grosso et al., 2004; Gibaud et al., 2003; Rodner et al., 2002; Brinker et al. 1990; Aksay et al., 1996], and has been shown to have a significant effect on final morphology. Yet, to our knowledge, no studies have been undertaken for interfacial fiber synthesis. The next series of experiments therefore dealt with the effect of the humidity in the reaction system. 3.3.2. Effect of humidity on product formation Two different humidity systems were studied in this section. In one system, the input humidity was maintained at 0% RH and in another the system, was maintained at 100% relative humidity. For the case where the input humidity 79
was maintained at a zero, the solution turned turbid on day 3 and by day 4, fibers were observed at the interface. In addition, heavy deposition of particles was observed at the bottom of the reaction system. On the other hand, when system was held at 100% humidity, the solution remained clear for the first two days and on the third day fibers were seen to grow at the interface. The outlet humidities for the two systems over a period of two weeks are as shown in Figure 3.11. When saturated air is used as an input, the output relative humidity steadily decreases for the first six days, indicating progressively increased uptake of water into the reaction system. The water uptake becomes constant between days six and ten, beyond which the output humidity further decreases, indicating higher uptake of water. When 0% RH air was introduced into the system, the output relative humidity progressively decreased.
This
indicates less evaporation of water from the reaction system for the first four days. Beyond day 4, there is steady rise in the amount of water leaving the reaction system. This occurs until day seven. Afterwards, the relative humidity in the output stream remained constant, as the evaporation of water into the environment reached steady state.
80
Saturated air input Dry air input
71.2 62.3 53.4 44.5
Relative Humidity in Oulet stream
35.6 26.7 17.8 8.9 0.0 0
2
4
6
8
10
12
14
16
Day
Figure 3.11: Output relative humidity in the two humidity control systems for 14 days.
81
From output data, it is obvious that the system reaches steady state in 6 days when saturated air in used as an input. Steady state is achieved in 7 days when dry air is used at an input. This difference reveals that humidity has an effect on the fiber formation process. Furthermore, fibers were observed on day 4 of the experiment with 0% relative humidity which corresponds with the lowest humidity in the system. This likely occurs because the initial step in fiber formation is hydrolysis of silica, which takes place with the consumption water [Aelion et al, 1950]. The initial four days, therefore, are thought to be the time where diffusion and reaction of TBOS is taking place, along with the consumption of water which results in lower concentrations of water at the interface. Once the hydrolysis reaction is complete, the consumption of water decreases while condensation of the silica continues. The turbid appearance at day 3 and fiber appearance at day 4 reveal that condensation is well underway by day four. [Brinker et al., 1990]. This is possibly the reason for the increased water content at the surface, leading to higher evaporation rates. Once the reaction is complete and structure has been formed, the system reaches steady state where restructuring is taking place. When a saturated air stream is used, output humidity steadily decreases for 6 days, after which, steady state is reached. The initial phase is thought to correspond to the diffusion and hydrolysis of the silica source.
During this
period, the concentration of reactants is constantly changing at the air-water interface. The interface is always at a lower partial pressure of water than the 82
input stream; thus, there is a steady uptake of water into the system. Once the silica is hydrolyzed, the main reactions that take place are the structuring and condensation of silica. Finally, the silica miscelles aggregate to from long range ordered products [Marlow and Kleitz, 2001; Atkins et al., 1994]. The last step can be considered a steady state reaction with respect to water, as the concentration should remain relatively unchanged during the restructuring process. Figure 3.12 a shows the result of fibers grown when the input humidity was maintained at 0% RH. These fibers show segments and reveal the presence of nodules. On the other hand, the products that are formed when the humidity was kept at 100% (Figure 3.12b) show some fibers and worm-like silica particles. The diameter of the fibers is seen to vary in both cases. For the system in which dry air was introduced, the diameter of the fibers ranged from 6 to 35 µm, while in saturated humidity systems, the diameters ranged from 0.2 to 13 µm.
a )
b )
Figure 3.12: SEM micrograph of products grown at (a) 0% RH and (b) 100% RH 83
The weight loss on calcination of the fibers in the two systems was estimated by TGA studies. Figure 3.13 shows the results of these studies. The final weight percentage for 0% and 100% RH inputs were 58% and 61% respectively. This corresponds to a surfactant weight percent of 42% and 39%. This shows that the concentration of surfactants in the products is higher in the case of lower humidity systems.
95 100% RH input 0% RH input 100 % RH input 0 % RH input
85 80
60
40
75 70
Weight Percentage
90
Wt Corrected Heat Flow (mW)
80
100
20
65 60
0
55 50 45 0
350
700
1050
-20 1400
Time, min Figure 3.13: TGA data showing weight loss during the calcination process of the fibers The nitrogen adsorption-desorption isotherms are typical of materials having ordered mesoporous with a uniform pore size distribution (Figure 3.14). For the sake of comparison, the nitrogen adsorption-desorption isotherm for fibers 84
synthesized under typical conditions (control) has been included. In all three cases, a typical type IV isotherm is observed which is characteristic of mesoporous materials with well-aligned channels. The adsorption and desorption isotherms almost coincide with a small hysteresis loop, which is a characteristic of mesoporous silica materials with small pore diameters. The results of the characterization from BET studies are summarized in Table 3.4. The products obtained when a saturated stream of water was input are seen to have a higher surface area (1110 m2/g) and smaller pore size (2.17 nm) than when dry air was used (1025 m2/g and 2.63 nm respectively). The control system is seen to have a pore size that is in between that obtained from 100% and 0% RH air streams and has a surface of 930 m2/g. The pore volume in the saturated air system is seen to be about half of that obtained from both the dry air and control systems. The evident lack of a defined hysteresis step in the isotherm when 0% relative humidity was used is indicative of the negligible or very low volume of defined ordered mesopores. This result is in keeping with the results obtained for thin film systems maintained at different humidities. It has been reported that high relative humidities result in poorly ordered structures within the system [FernandezMartin et al., 2004].
85
400 300 200
3
Quantity Adsorbed (cm /g STP)
500
%0 RH-Adsorption %100 RH-Adsorption Control-Adsorption
100 0 0.00
0.20
0.40
0.60
0.80
1.00
Relative Pressure (P/Po) Figure 3.14: Nitrogen adsorption- desorption isotherms for fibers synthesized at various relative humidities Table 3.4: Interplanar spacing and pore wall thickness, and N2 adsorptiondesorption results for the samples prepared at different TBOS heights
Sample
Area m2/g
Pore size (nm)
Peak position
D spacing (nm)
Lattice parameter (nm)
Wall thickness (nm)
Total pore Volume (cm3/g)
100%
1110
2.1
2.40
3.67
4.24
2.07
0.32
0%
1025
2.6
2.33
3.78
4.37
1.74
0.78
Control
931
2.5
2.26
3.90
4.50
1.92
0.77
86
(b)
(a) 100
Intensity
Intensity
100
110
110
200
200
2
3
4
5
6
7
8
9
2
10
3
4
5
6
7
8
9
10
Figure 3.15: XRD micrographs of fibers synthesized at a) 100% Relative humidity b) 0% Relative Humidity The XRD patterns of the products from both saturated streams and dry streams show ordered structure (Figure 3.15). The XRD pattern of materials from the saturated stream shows the presence of three peaks indexed as the (100), (200) and (110), indicating the presence of an SBA-3 like structure. The same peaks are observed in the control system as well. The XRD pattern in the 0% RH input fibers synthesis procedure shows the presence of the (100) and (110) peaks but (200) peak is not as discernable, showing a less ordered structure. The XRD data, in conjunction with porosimetry data, was used to calculate the pore characteristics of these samples. The pore wall thickness of the fibers synthesized in the saturated stream (2.07 nm) is seen to be higher than that observed in the case of the dry air stream (1.74 nm).
87
These results show that humidity of the environment has a significant effect on fiber morphology and pore structure. The pore structure for the system at high humidity is better defined than at lower humidity. This results from the fact that there is more time for interaction between the surfactant and hydrolyzed silica, which leads to a better ordered structure. In low humidity environments, condensation takes place too quickly to allow for restructuring [Inayat et al., 2010]. Though the surfactant concentration also increases at the interface, there is not enough time for restructuring which causes the fiber in the system to be less ordered. Therefore, humidity of the environment is an important parameter and needs to be adjusted carefully during fiber synthesis.
In doing so, enough
surfactant will be made available while allowing enough water to remain in the system to reduce the condensation rate and allow for restructuring. Another interesting observation is that the diameters of fibers formed vary quite drastically in the two systems. As reported previously, the fibers that were synthesized in an environment saturated with water vapor had diameters that ranged from 0.2 to 13 µm. The diameter of fibers formed in low humidity ranged between 6 and 35 µm. The diameter distribution of the fibers synthesized at 100% RH in this study is comparable to that observed for fibers synthesized in four days in the previous study in our laboratory [Alsyouri and Lin, 2003]. In addition, the diameter distribution for fibers synthesized in a 0% RH environment in this work resembles that of fibers synthesized for 10 days in the previous study.
88
It has been suggested [Marlow and Kleitz, 2001] that fiber formation is initiated by a circular seed which results from the restructuring of the micelles that are formed at the interface. This seed begins to grow by the addition of more micelles and silica from the oil phase. Alsyouri and Y. S. Lin [Alsyouri and Lin, 2003] proposed that these fibers actually grow by the addition of reactants at the interface, and that fibers of larger diameters are formed by aggregation of smaller fibers. The phenomenon of aggregation of small ordered particles to form larger particles before condensation is complete and the micelles are still relatively flexible is well documented for acidic systems [Baccile et al., 2008; Linden et al., 2008; Guth et al., 2007]. However, this type of study has not been attempted for fiber based systems. In mixed systems for synthesis of SBA-3 particles, it has been observed that that once hydrolysis is complete, there is phase separation into a surfactant and silica rich phase and solvent rich phase. In the first phase, further aggregation and condensation of silica is complete, leading to the final morphology of the system. It also well known that aggregation of the small particles, to form larger particles and condensation of silica to form a final rigid structure, is highly influenced by solvent concentration. This is especially true in interface systems [Cagnol et al., 2003]. By removing solvent from the reaction system once hydrolysis is complete, the system can be driven toward faster condensation, as more uncondensed species come into contact [Fernandez-Martin et al., 2004]. In the above humidity studies, it is shown that in a low humidity environment, the final morphology is not as smooth because the structure is 89
frozen. The frozen nature of the system is due to the fact that the condensation reaction of silica is complete before the silica-surfactant systems have had time to restructure [Cagnol et al., 2003]. On the other hand, in high humidity environments, the condensation reaction slows down and the micelles are unable to coagulate to form larger ordered structures due to the presence of large amounts of solvent. Consequently, poorly ordered fibers are formed. This reasoning, along with the results for fiber diameter obtained in the saturated and zero humidity environments, leads us to believe that, during the first three days of synthesis, hydrolysis and seed formation of silica-surfactant system takes place. Afterwards, the condensation step takes place to form short fibers and particles with small diameters that are still flexible because condensation is not complete. As was hypothesized previously, these small structures then aggregate to form larger diameter fibers. This is apparent from the fact that low humidity resulted in large diameter fibers while in a high humidity environment aggregation was restricted. This results in final structures that did not develop past the type of morphology typically seen at the end of four days of synthesis under control conditions.
90
(1)
(3)
(2) Silica Source
Water + Alcohol
Fibers
Surfactant Silica Source
Water Phase
Water + Alcohol
Micelle
Figure 3.16: Schematic representation of fiber formation process (1) Initial configuration showing two distinct layers, viz. the silica source phase and the water phase, (2) Inter-diffusion of silica source and water phase accompanied by evaporation of water and alcohol Figure 3.16 is a schematic representing the proposed fiber formation process, on combining the results from the height and humidity studies. At the beginning of the process, TBOS undergoes hydrolysis and diffuses into the water phase. Initially, surfactant micelles are available at the interface but are consumed by reaction to form seeds. As more silica diffuses into the system, more surfactant is consumed. These silica surfactant species then coalesce to form larger aggregates. We know that the aggregation and restricting can take place as long as silica condensation is not complete. When a thin layer of TBOS is used, the diffusion reaction is completed faster and the oil phase stops being a barrier to evaporation of water and solvents. The evaporation then drives the surfactant concentration to increase at the interface, much like that observed when low humidity environment was used. This availability of surfactant helps the fiber grow in length. Since the local concentration of water is fairly high in low TBOS 91
height systems, the silica is not driven to condensation very quickly and there is time to restructure. When silica source height used is very large, the local concentration of hydrolyzed silica just below the interface keeps increasing at a steady rate till it is very high. This drives the silica to condense faster without having time to interact with the surfactant, or the ratio of surfactant to silica is insufficient to allow order structure formation. In this system, it is believed that the surfactant diffusion rate to the interface is limiting. The oil phase present over the water phase also limits the evaporation of solvents further reducing the availability of surfactants at the interface. This could be the reason for shorter fibers with higher concentrations even when fiber formation was observed. The results of the humidity studies, when combined with the TBOS height studies, show that evaporation is an important factor to consider during fiber synthesis. From the humidity studies, we know that an increased evaporation rate causes the end products to have higher surfactant concentrations. We know that the diffusion of a thinner TBOS layer will be completed faster than a thick layer. Therefore the water phase will come into contact with the environment above the reaction system in a shorter period of time then it would for thicker TBOS layer. This results in the water phase evaporating, which produces a higher availability of surfactant at the interface. This constant supply of surfactants at the interface encourages formation of ordered structures with the end result being an increase in fiber length with decreasing TBOS height. The observations and conclusions made are in agreement with previous studies that state that fibers grow by 92
addition of surfactants and silica at the interface. It stands to reason that a higher supply of surfactants at the interface result in longer fibers under the same reaction conditions. From the above studies, it is seen that the absolute mole ratio of the reactants does not have a significant effect on fiber formation. This is because, in this type of synthesis, the reactants are not well mixed and the local ratio of reactants varies depending on a number of factors including diffusion rate of silica, diffusion rate of surfactant and evaporation rate of water. Therefore, it is useful to report the height of the TBOS source in conjunction with the concentration of the water phase. Since the diffusion rate is constant, this will define the ratio of silica in the water phase. 3.4 Conclusion Two important criteria that need to be considered while synthesizing fibers through the interfacial process are the TBOS height and evaporation rate. Both of these factors are seen to have a profound effect on fiber morphology and long range order. The length of the fiber synthesized can be tailored by fixing the height of the TBOS layer. The maximum TBOS height at which the fibers with good long range channel order can be synthesized is 0.144 cm above the solution interface. The humidity of these systems needs to be maintained at an appropriate level to result in good quality fibers. The results suggest that, along with mole ratio of reactant systems, the silica source height also needs to be reported for fiber synthesis experiments by the interfacial method. These results could also 93
lend some insight into controlling factors for ordered silica materials synthesized via systems which utilize interfacial reaction schemes.
94
Chapter 4 COUNTER DIFFUSION SELF ASSEMBLY SYNTHESIS OF ORDERED MESOPOROUS SILICA MEMBRANES IN STRAIGHT PORE SUPPORTS 4.1 Introduction In this chapter, the fabrication of ordered mesoporous membranes by counter diffusion self-assembly method is discussed. As stated in Chapter 3 this method is an extension of the interfacial method for fiber synthesis. In the previous chapter, the effect of silica source height and environment on fiber synthesis was discussed. This chapter aims at using the acquired knowledge on fiber synthesis towards fabrication of novel straight through pore ordered membranes. Numerous studies have been conducted on the synthesis of membranes with the required straight though pore ordering on various dense and porous substrates. This configuration is desirable as it will allow for better pore accessibility for use in a number of applications such as facilitated separation [Bhat et al., 2006; Salesch et al.,2002], catalysis [Taguchi and Schuth, 2002; Moelans et al., 2005], sensors [Innocenzi et al., 2001], low K dielectric materials] [Chen et al., 2005] and nanoreactors [Guliants et al.,2004]. These methods include tape casting, dip coating, and use of orienting magnetic, electric or shear fields [Zhong et al., 2003; Huang et al., 2006; Miyata et al., 2002; Yamauchi et al., 2005; Kuraoka et al., 2004; Hillhouse et al., 1997]. More involved methods, such as eutectic deposition combined with etching, use of supercritical carbon dioxide 95
to deliver the inorganic phase and making the support surface neutral to the template have also been tried [Otomo et al., 2006; Nagarajan et al., 2008; Koganti and Rankin, 2005]. Some of these methods have resulted in good quality membranes.
However, the pores of the membranes synthesized were either
randomly aligned or aligned parallel to the surface of the substrates. In some cases, ordering could be maintained only a few nanometers from the surface. Remarkable progress has been made in recent years towards making ordered mesoporous silica rods by using a two dimensional physical confinement method [Lai et al., 2008; Liang and Susha, 2004; Wu et al., 2004; Fan et al., 2008; Yamaguchi et al., 2004; Lu et al., 2004; Platschek et al., 2006]. A comprehensive review of the confinement method has been published by the Stucky group [Wu et al., 2004; Fan et al., 2008]. Most of these studies have used nonionic block copolymers as templates to successfully synthesize mesoporous silica rods with pores that run in a circular fashion.
Growth utilizing straight-pore anopore
supports has also been investigated. Yamaguchi et. al. [Yamaguchi et al., 2004] and Lu et. al. [Lu et al., 2004] have reported synthesizing mesoporous silicaanodic composite membranes having a vertical pore orientation. However these membranes suffer from certain drawbacks. Reports indicate that only 60% of the support pores are plugged and these plugs did not run the entire cross section of the support. Also, it was seen that the order in the plugs did not extend the entire length of the pores in the support. Lu et. al. have not reported any permeation data which makes it difficult to ascertain the quality for use in membrane applications. 96
Platschek et. al., [Platschek et. al., 2006] have recently demonstrated the use of both ionic surfactant (CTAB) and non-ionic surfactants, P123 or Brij56, in the formation of nanorods of various pore orientations within alumina anopore membranes. These studies were aimed at delineating the role of surfactant and EISA (Evaporation Induced Self Assembly) in the formation of long range ordered mesoporous rods. However, no permeation data is available for these studies as well, and SEM images revealed that not all of the pores of the support were plugged, making this process unfavorable for membrane synthesis. Though these methods have shown some promise, there is still a need for a technique that can synthesize good quality membranes with pores that run through the cross section of the support. As stated earlier, the CDSA method is an extension of the interfacial synthesis method for synthesizing ordered mesoporous silica fibers containing a large number of ordered, 2.5 nm pores wound helically around the longitudinal fiber axis. The optimum silica source, acid and temperature conditions for the growth of these mesoporous fibers have previously been reported [Huo et al., 1997; Alsyouri and Lin, 2003] . The effect of silica source height and humidity has been reported in the previous chapter. In the CDSA method, a porous support is placed at the interface of the water and silica precursor phases. The precursors are expected to inter-diffuse through the support pores and the silica is expected to condense around the diffused micelles to form fibers (which will be referred to
97
as plugs) within the pores of the support. A schematic of this concept is shown in the previous chapter (Figure 3.1). Initial experiments were carried out in tortuous supports of pore sizes ranging from 0.2-20 µm. The details of the experiments conducted have been reported previously [Alsyouri et al., 2006]. From these studies, it was seen that large-pored hydrophilic supports show better plugging, indicating that facilitated transport is one of the key factors for the growth of silica membranes by the CDSA approach. Hydrophobically modified supports drastically improved the quality of the membrane. This is believed to happen as a result of enhanced transport of the hydrophobic silica precursor through the pores of the support [Alsyouri and Lin, 2005]. Gas permeation data for these membranes indicated a Knudsen type permeation mechanism with a N2 permeance of 0.45x10⁻⁷ mol/m2∙Pa∙s. This confirmed the mesoporous nature of the silica membranes grown within the surface modified macroporous alumina supports. From the above results, it showed that the use of larger pore supports (> 3 µm) was highly desired.
Since our goal is to obtain straight through pores
orthogonal to the support surface, it is expected that when the surfactant is introduced inside the pores of the support, the micelles will align parallel to the support pore wall and lead to mesopores with an orientation analogous to the shape of the pore. Given the results and the objective of the work, this chapter will describe the fabrication of membranes in large, straight pore supports.
98
The present study is focused on CDSA growth of short silica fibers (plugs), in straight pore supports of varying surface chemistry (hydrophobic and hydrophilic). Track-etch polycarbonate supports were chosen since they can withstand the highly acidic synthesis conditions and have pores with desired surface chemistries and pore structure. Experiments have also been conducted to identify optimum conditions to obtain consistently good quality membranes with the desired pore structure and high surface area. The quality of the membranes synthesized and the structure and morphology of the silica plugs were studied using SEM, oxygen permeation, XRD, TEM and nitrogen adsorption/desorption isotherms. Various factors that affect the formation of ordered mesoporous plugs within the pores resulting in good quality membranes have been determined. 4.2. Experimental 4.2.1 Supports The straight pore supports used were nuclepore track-etched polycarbonate membranes (Whatman Inc., NJ). Both hydrophobic and hydrophilic membranes were used s supports in this study. The hydrophobic supports have a diameter of 13 mm, thickness of 10 µm, and pore diameter of 8 µm. The hydrophilic supports are 25 mm in diameter, 10 µm thick and have a pore diameter of 5 µm. Both the hydrophobic and the hydrophilic membrane supports have a porosity of 15%.
99
4.2.2 CDSA Growth of Mesoporous Membranes Mesoporous silica was grown in the support pores by the CDSA approach under optimum conditions that were identified for growth of silica fibers, which was also discussed in Chapter 3 [Huo et al., 1997; Alsyouri and Lin, 2003]. Tetrabutylorthosilicate (C16H36O4Si coded as TBOS) was used as the silica source and cetyltrimethylammonium bromide (C19H42NBr coded as CTAB) was used as the surfactant. CTAB, HCl and water, which constitute the water phase, were used in a molar ratio of 0.025:2.92:100 respectively. Three different synthesis conditions were used with the basic CDSA idea in mind. Here, they are referred to as Methods A, B and C.
These methods differ with respect to the
height/amount of TBOS used, as will be elucidated shortly. A Teflon holder was specially fabricated to hold the track-etch polycarbonate membrane supports. In some cases, the holder also acted as a reservoir to hold the silica source. The holder consisted of a cap where the polycarbonate support was placed and a tube that was screwed into it to hold the support in place. A schematic of the CDSA growth approach and experimental setups for the three different methods are shown in Figure 4.1. synthesis methods are described next.
100
The three
H/h >>1
H
H/h >1
H h
h
(a)
H/h ~1
H~h
(b)
Water +HCl + Surfactant
Silica Source
(c) Support
Figure 4.1: a) Schematic representation of Method A, (b) schematic representation of Method B, (c) schematic representation of Method C. Method A: The holder, with the support, was placed at the surface of the aqueous solution of H2O, CTAB, and HCl, with one surface of the support facing the solution, as shown in Figure 4.1a. TBOS was added inside the tube onto the top of the support surface. The height of TBOS in the tube above the support is denoted by the letter H and the thickness of the membrane support is denoted by the letter h, here H/h >>1 (typically about 10000). Method B: This method aims to reduce the height of TBOS used and to facilitate evaporation as it is seen to have a profound effect on fiber morphology, as seen in Chapter 3. A schematic of this method is shown in Figure 4.1b. Here, the holder was inverted so that the tube was in the water phase and acted as mechanical support to hold the polycarbonate support in place. TBOS was added to the top surface of the support as a thin layer to facilitate evaporation of the byproducts (H/h greater than 1, typically about 10). 101
Method C: The Method C aims to study the effect of support placement on membrane quality. Figure 4.1c shows a schematic of this method. In this case, the support was soaked in TBOS; hence acting as a reservoir for TBOS (H/h = 1). This was then placed at the interface where it floated for the entire duration of the experiment. Once the experiments were set up, the silica precursor and water phases with surfactant were allowed to inter-diffuse through the support for 14 days. After growth, the membranes were dried in air at room temperature and characterized. 4.2.3 Membrane Characterization Two important criteria were used in defining the quality of the membranes. The first defining criterion was the plugging of pores of the supports. A membrane was considered to be of good quality if 90% or more of its pores were plugged. The second criterion was the microstructure of the plugs. A plug was said to have the required microstructure if its pore diameter and ordering were similar to that seen in SBA-3 material. The first criterion was studied using SEM images (FEI XL30) and gas permeation tests. SEM micrographs where used as a visual tool to assess the quality and the morphology of the plugs in the support pores. Oxygen permeation experiments with constant transmembrane pressure were conducted to characterize the overall quality of the membranes. Figure 4.2 shows the schematic representation of the permeation setup used. This setup was specially built with a Wicke-Kalenbach cross flow pattern to avoid 102
removal of the silica plugs. Here 95% nitrogen and 5% oxygen was fed on the feed side and a total flow rate of 50 cc/min was maintained. Nitrogen sweep was fed on the permeate side at a flow rate of 50 cc/min. Oxygen transmembrane pressure, defined as the partial pressure difference between the feed and permeate, was 5,000 Pa. The oxygen concentration in the permeate side was analyzed using an oxygen sensor (6000 Oxygen Analyzer, Illinoise Instruments).
Figure 4.2: Schematic representation of oxygen permeation setup. It should be noted the upper limit of the gas permeance measured by the permeation apparatus under the flow conditions described above is 1.0x10⁻⁵ mol/m2∙Pa∙s (measured with an empty cell). The gas permeance for the fresh 103
polycarbonate polymer supports, due to the small support thickness and large pores, is higher than this value.
Therefore gas permeance for the polymer
support was estimated using the equimolecular counter diffusion model as show in Equation 1: F
J 1 Deff P LRT
(4.1)
where Deff is effective diffusion coefficient calculated from the ChapmanEnskong equation considering 15% porosity of the membrane, R is the universal gas constant, T is temperature and L is the thickness of the membrane (10x10-6 m).
The oxygen permeance was estimated to be 1.210-4 mol/m2∙Pa∙s
(Calculations in Appendix A), which is used as the permeance for the polymer supports before deposition of silica plugs. The second criterion, that is the microstructure of the plugs, was analyzed using XRD, nitrogen porosimetry and TEM studies.
The ordering of the
mesopores in the silica plugs was examined by XRD (Bruker D8 Focus, CuKα) on the membrane samples. Pore structure of the silica plugs was characterized by nitrogen porosimetry (Micromeritics ASAP2020). Nitrogen adsorption/desorption isotherms of mesoporous silica plugs were measured at liquid nitrogen temperature (77 K). For proper characterization of the silica plugs, they had to be extracted from the support and calcined to remove the surfactant. The support is polymeric, thus it can be removed by decomposition at high temperature. Both support decomposition and surfactant removal can be performed in a single heat treatment step. TGA (Setaram TG-92) analysis was undertaken to determine the 104
appropriate conditions for decomposition of the polymer support and surfactant. For this, the system was heated at a rate of 0.5oC/min to 600oC where it was held for 5 hours, and then cooled to room temperature at a rate of 0.5oC/min. Given that each membrane resulted in a small sample size of silica plugs which was insufficient for providing accurate characterization results, 9 to 15 membranes of each type were collected. This resulted in approximately 5 to 10 mg worth of silica plugs for nitrogen porosimetry analysis. The decomposition/calcination step, which was ascertained from TGA analysis, was performed as follows: The membranes were collected in a porcelain dish and heated to 600oC, to ensure complete surfactant removal, at ramp rate of 2ºC/min. The furnace was held at this temperature for 6 hrs to ensure complete decomposition of the polymer support and removal of the surfactant. Porosimetry studies where then conducted to analyze nature of the pores present within the plugs. TEM imaging was conducted using JOEL JEM -2000FX transmission electron microscope operated at 200 kV to identify the pore structure and orientation within the plugs. The TEM samples
where
prepared
by
dispersing
plugs,
collected,
from
the
decomposition/calcination step, in ethanol. The sample was then collected on the TEM grids for imaging.
105
4.3. Results and Discussion 4.3.1 Results of Membrane Synthesis CDSA growth by Method A and Method B As stated previously Method A involved the basic CDSA method while Method B was a modification on the method to allow evaporation. Figure 4.3 compares SEM micrographs of hydrophobic (Fig. 4.3b) and hydrophilic (Fig. 4.3c) polycarbonate supports after CDSA growth of silica plugs by Method A with that of a fresh polycarbonate support (Fig. 4.3a). As shown, silica plugs filled the pores of both supports. By using the CDSA method, we were able to grow plugs that ran the entire length of the support pores. The morphology of the plugs, as seen by SEM, was typical of that seen mesoporous silica fibers (Fig.4.3d). Figures 4.4a and 4.4b show SEM micrographs of the hydrophobic and hydrophilic supports after CDSA synthesis by Method B. Complete plugging of the pores was achieved in the hydrophobic support, whereas the hydrophilic support did not show formation of good quality plugs. There was however, a small gap (around 0.15 µm), between the plug and the pore wall in all membranes synthesized by both methods. These gaps were most likely formed due to the shrinkage of the plugs upon drying.
106
20 µm
(a)
(b)
50 µm (d) silica plug Figure 4.3:.SEM micrograph of polycarbonate track etch membrane support (a) (c)
top view of a fresh track-etch membrane support before CDSA growth, (b) top view of hydrophobic support after CDSA growth by Method A (c) top view of hydrophilic support after CDSA growth by Method A showing complete plugging, (d) cross sectional view of membrane showing silica plug running through the length of the support pore. b)
a)
50 µm
50 µm
µµµ Figure 4.4: SEM micrograph of top view ofµµm (a) hydrophobic showing complete plugging and (b) hydrophilic support showing incomplete plugging after CDSA growth by Method B. 107
Results of permeation studies are summarized in Table 4.1.
The
permeance of the as-synthesized hydrophobic membranes was 1.4x10⁻⁶ mol/m2∙Pa∙s and 1.310-6 mol/m2∙Pa∙s for Method A and Method B respectively. To verify that this is the expected permeance for the as-synthesized membrane, the theoretical permeance was calculated for a membrane that was 100% plugged with a 0.15 µm gap between the plug and pore wall. This permeance was estimated to be 9.0x10⁻⁶ mol/m2∙Pa∙s. The experimental permeance of the membrane is lower than the estimated permeance. This difference can be attributed to the fact that all of the plugs do not have exactly the same diameter. This results in gaps of various dimensions, but not exceeding 0.2 microns. Hence the two order decrease in the magnitude of permeance form the fresh support permeance indicates that all support pores were plugged. Table 4.1: Results of permeation and nitrogen porosimetry studies on hydrophobic track-etch membrane supports
Method
A B C
Fresh Support Permeance (10-6 mol/m2·Pa·s)*
O2 Permeance (10-6 mol/m2·Pa·s)
120
1.4 5.3 3.7
Wall Pore thickness Volume spacing (nm) (cm3/g)
d100 4.2 4.2
* Theoretical permeance
108
2.1 2.1
0.20 0.26 0.60
BET Surface Area (m2/g)
BJH Pore Size (nm)
312 379 990
3.1 2.7 2.7
XRD studies of the membranes synthesized by Method A showed no ordered peaks. Figure 4.5a(i) and 4.5a(ii) show the XRD patterns for the membranes in hydrophobic and hydrophilic supports synthesized by Method B. XRD peaks revealed the presence of long range order in the pores of the plug, as seen by the three peaks indexed as (100), (200) and (110) planes.
100
110
x5
200
x5
(i)
(i)
100
110
3
200
x5 2
Intensity
4
5
x5 (ii)
(ii) 6
7
2
3
4
5
6
7
(a)
(b)
Figure 4.5:XRD patterns showing an ordered mesoporous structure of plugs in the as-synthesized membrane after CDSA growth by (a) Method B and (b) Method C on (i) hydrophobic and ii) hydrophilic track-etch supports respectively.
109
.
0.5 0.0
0.0 -0.5
-0.1
220 C
-1.0
Cooling -0.2
-1.5 o
450 C -2.0
-0.3
-2.5
DTG(%/min)
Weight(mg)
o
o
550 C
-0.4
-3.0 o
375 C -3.5 0
5
10
15
20
25
30
35
40
45
-0.5 50
Time (hr)
Figure 4.6: TGA data for as-systhesised Hydrophobic polycarbonate membrane Figure 4.6 shows the results of TGA analysis on two hydrophobic membranes to find the optimum temperature for surfactant and polymer decomposition. The data given in Figure 4.6 reveals that both the polymer and the surfactant are completely decomposed at 600oC. The initial weight loss of about 2.5% begins at around 145oC, which corresponds to the glass transition temperature of the polymer. At 220oC, the surfactant begins to decompose, as indicated by the endothermic peak in the DSC curve [Araujo et al., 2001]. Previous studies have shown that beyond this stage, there is water loss due condensation of silanol groups to form siloxane bonds, which results in continued 110
weight loss until 550oC. The polymer begins to degrade at around 350oC and continues to degrade until around 550oC at which complete decomposition is achieved [Huang et al., 2006]. Beyond this temperature, the weight of the sample remained constant indicating that complete decomposition of both polymer and surfactant had taken place. There was total of 82% weight loss in the system.
111
Porosimetry studies on silica plugs removed from the supports synthesized by Method A (both on hydrophobic and hydrophilic supports) did not show a narrow pore size distribution characteristic of SBA-3 type mesoporous material. It is possible that the test sample, consisting of plugs from nine different membranes, contained a mixture of plugs which had ordered pores and those that did not exhibit any ordering, possibly resulting in the outcome for the tests conducted. On the other hand, membranes synthesized by Method B revealed a Type-IV isotherm, which is characteristic of mesoporous materials with wellaligned channels (Figure 4.7 and Figure 4.8). Plugs from both hydrophobic and hydrophilic supports revealed a narrow pore size distribution with a mean BJH diameter values, obtained from the desorption branch, being 2.7 nm and 2.6 nm respectively (inset of Figures). These values are similar to those obtained from the adsorption branch which is indicative of uniform cylindrical pore shapes. Porosimetry studies of the plugs from membranes synthesized with hydrophobic supports are presented along with permeation data in Table 4.1. The plugs had a BET surface area of 379 m2/g and pore volume of 0.26 cm3/g while the plugs from the hydrophilic membrane supports had a surface area of 836 m2/g and pore volume of 0.59 cm3/g.
112
Adsorption Desorption
150
3
Quantity Adsorbed(cm /g STP)
200
Pore Volume
100
50
0
0 0.0
0.2
2
0.4
4 6 8 10 12 14 Pore Diameter (A)
0.6
0.8
1.0
Relative pressure (P/Po)
Figure 4.7: Nitrogen adsorption/desorption isotherm of the plugs from membranes synthesized using hydrophobic supports by Method B; Inset - BJH pore size distribution.
113
300
Adroption Desoption
250
150
200
Pore Volume
3
Quantity Adsorbed (cm /g STP)
350
100 0
50 0 0.0
0.2
0.4
1
2
3
4
5
6
Pore Diameter (nm)
0.6
0.8
7
8
1.0
Relative Pressure (P/PO) Figure 4.8: Nitrogen adsorption/desorption isotherm of the plugs from membranes synthesized using hydrophilic supports by Method B; Inset - BJH pore size distribution. It was seen that membranes formed by Method A had good quality plugging, but the plugs did not show the required microstructure. Method B, on the other hand, showed good quality plugging and the plugs showed the required microstructure, indicating the reduction in TBOS height and evaporation of solvent and byproducts is key to the formation of an ordered structure as observed in Chapter 3. However, in some instances with Method B, it was observed that silica deposited or grew as particulate matter on the surface of the support and not as plugs within the pores. This was likely due to improper placement of the 114
polycarbonate support at the surface of the water phase during synthesis. This variability in results due to experimental error led to the development of Method C. CDSA growth by Method C Method C was used to ensure precise placement of the support. It was observed that membranes synthesized by Method C had a thin film on the surface of the polycarbonate support on the TBOS side. SEM micrographs (Figure 4.9a) revealed that 90% or more of the pores were plugged in the case of hydrophobic supports. On the other hand, hydrophilic supports exhibited heavy particulate deposition and no plugging, as seen in Figure 4.9b. The inset in Figure 4.9a reveals a plug that was removed by decomposing the polycarbonate support. More than 90% pores of the support were plugged as seen by SEM imaging. The presence of plugs in all of the support pores was further verified by permeation studies. Oxygen permeance of the as-synthesized membrane in a hydrophobic support was 3.710-6 mol/m2∙Pa∙s. The two order of magnitude decrease in permeance in comparison to the support shows that good quality support plugging was achieved, as discussed earlier.
115
25 µm
(a)
25 µm
2µm
(b)
Figure 4.9: SEM micrograph showing (a) good quality plugging of a polycarbonate track-etch hydrophobic support after CDSA growth by Method C, Inset- Plug extracted after polymer decomposition and (b) no plugging in the hydrophilic support after CDSA growth by Method The presence of ordered mesoporous silica in hydrophobic supports was also verified by XRD data, shown in Figure 4.5b (i). These particles deposited on hydrophilic support also showed an ordered mesoporous structure, as indicated by XRD studies (Fig. 4.5b(ii)). The presence of three peaks in the pattern verifies the presence of long range order in both systems. The intensity of the peaks for the hydrophobic support systems is seen to be lower than that of the hydrophilic system. This is believed to occur since the mesoporous material is embedded in the polymer matrix which reduces the intensity of the interfering reflected beam. Figures 4.10 and 4.11 show nitrogen sorption isotherms of the calcined silica plugs obtained from the hydrophobic and hydrophilic support respectively. Table 116
4.1 summarizes the results of the characterization studies. A narrow pore size distribution with mean BJH diameter value of 2.7 nm was obtained for the hydrophobic plugs. These plugs had a surface area of 990 m2/g and pore volume of 0.6 cm3/g. The membranes grown in hydrophilic supports, on the other hand, showed a bimodal pore size distribution with pore sizes of 2.5 and 3.9 nm, a surface area of 823 m2/g and pore volume of 0.57 cm2/g.
It is obvious that the
surface area of the plugs prepared by Method C is much larger than that for plugs synthesized by Method B. It has been previously studied that amorphous silica has a surface area in the range of 200-300 m2/g [Kresge et al., 1992]. On the other hand, mesoporous silica with SBA-3 type structures have been observed to have surface areas greater than 800 m2/g (typically 1000 m2/g) [Zhao et al., 1996]. The results obtained in Method C are typical of what is expected for SBA-3 materials. It is believed that the high surface area is achieved in Method C due the reduction in experimental variability which consistently results in highly ordered membranes. Method B, on the other hand, showed a lower BET surface area, which is indicative of a mixture of well ordered and amorphous silica.
117
330
Pore Volume
3
Quantity Adsorbed(cm /g STP)
Adsorbtion Desorbtion
220
110 0
0 0.0
0.2
0.4
2
4 6 8 10 12 14 Pore Diameter (A)
0.6
0.8
1.0
Relative Pressure (P/P0)
Figure 4.10: Nitrogen adsorption/desorption isotherm of the plugs from membranes synthesized using hydrophobic supports by Method C; Inset - BJH pore size distribution.
118
400
Adsorbtion Desorbtion
3
Quantity Adsorbed(cm /g STP)
300
100
0
Pore Volume
200
0
2
4
6
8
10
12
14
Pore Diameter (nm)
0.0
0.2
0.4
0.6
0.8
1.0
Relative pressure (P/P0)
Figure 4.11: Nitrogen adsorption/desorption isotherm of the plugs from membranes synthesized using hydrophilic supports made by Method C; Inset BJH pore size distribution
119
(c) (b)
(e)
(a)
(d)
(f) Figure 4.12: TEM image of a plug removed from a membrane synthesized on a hydrophobic support by Method C. (a) Low magnification image of the plug (b-f) High magnification images of the sections revealing well-ordered channels in the plug. Inset in the images show the corresponding diffraction patterns. TEM imaging was performed on plugs from membranes synthesized by Method C on hydrophobic supports, as these revealed the best results of all synthesis procedures evaluated. Figure 4.12a shows a low magnification image of the entire plug. Figures 4.12b – 4.12f are high magnification images of the edges 120
of the plug, which were thin and electron transparent. The inset in these images shows the corresponding diffraction pattern. Here, the image and the pattern is taken with [100] incidence, which is perpendicular to the channels. Highly organized parallel channels where observed in the high magnification TEM images. It was also revealed that the channels are tilted at an angle of about 30 degrees to the surface of the plug. The presence of highly ordered channels at both extreme ends of the plug indicates that the channels run though the length of the plug. The diffraction patterns show two distinct points that confirm long range, two fold symmetry in the system. The TEM images, combined with XRD and porosimetry studies reveal that the plugs have highly ordered pores with the required ordering; a key characteristic of SBA-3 type material. SEM and permeation studies also reveal that good plugging of the hydrophobic support has been achieved. This indicates that TBOS height, evaporation induced self-assembly and placement of support are key factors that promote good membrane formation. 4.3.2. Discussion The above studies indicate that good quality membranes with complete pore plugging can be fabricated by the CDSA method. Four variables that affect plug formation have been studied viz. surface chemistry, support position, silica source height and evaporation induced self-assembly.
It has been seen that
hydrophobic supports yield the best quality membrane. In the case of hydrophilic supports, it was seen that the plugs were not formed or those that were formed 121
were not of good quality. This can be attributed to the forces in play in the two systems. Surfactants tend to assemble on the surface of the substrate based on attractive (hydrophobic/hydrophilic and van der Waals) forces. In the case of hydrophobic surfaces, the attractive forces between the hydrophobic tail of the surfactant and the surface facilitate orientation of the surfactant in hemispherical tubes which gives rise to long range ordering. While in the case of hydrophilic surfaces, interaction of the surface is with the smaller head group which results in surfactants ordered in a tubular fashion. Because the area of contact is higher in the case of hydrophobic interaction, better ordering is achieved in the system [Aksay et al., 1996].
It is also believed that the hydrophilic surface is
preferentially wet by the water phase, which wets both the pores and surface of the supports. The silica source, having a higher concentration at the surface, preferentially condenses at the surface forming particulates. The second criterion for the formation of a good quality membrane is the position of the support. It is known that the fibers form at the interface of the oil and water phases as the reactants and the structure directing agents are all available at their optimum concentrations. If the support is not placed exactly at the interface, the reaction interface is shifted to a lower or a higher position resulting in supports that are not plugged. This is revealed by Method B, where some supports were better plugged than others. Our studies have shown that the best quality membranes are obtained by Method C. Since the alignment is not
122
done manually and the support floats on the surface, the error in positioning the support is eliminated. The third criteria for formation of a good quality membrane by the CDSA method is allowing for evaporation of solvent and by products and using less than 0.144 cm of TBOS. This result is in keeping with results obtained in Chapter 3. Numerous studies have indicated that evaporation can influence the formation of specific micelle structures [Aksay et al., 1996; Grosso et al., 2004; Gibaud et al., 2003; Rodner et al., 2002; Nakagawa et al., 2005]. The evaporation-induced selfassembly theory proposes that preferential evaporation of the solvent and alcohol byproduct from the surface induces the formation of surfactant micelles and further organization of the mesophase. The role of evaporation has been investigated in the previous chapter and has been found to affect the final morphology and channel ordering in the fiber. The reduced height of TBOS also results in a decreased local concentration of silica, which allows time for restructuring of the plug to obtain long range pore order in the system, as indicated in Chapter 3. Therefore, Method A does not result in an ordered structure. While we have been able to fabricate membranes that are well plugged and have the desired pore structure, it is seen that a gap is formed between the plug and the support in all three methods. This needs to be addressed before these membranes can used for separation purposes. Once the gaps are sealed, these membranes will offer separability of mixed gases determined primarily by the 123
Knudsen diffusion mechanism, where the selectivity is inversely proportional to the squared root of the molecular weights of the diffusing gases, due to pores in the meso-size range [Alsyouri et al., 2006]. In contrast, other microporous silica membranes such as MFI type zeolite membranes [Othman et al., 2009] exhibit better separability for gas mixtures determined by a number of different separation mechanisms including, but not limited to molecule sieving [Lin et al., 2002].
These membranes, obviously, offer separability for large molecules
including proteins of various sizes, making them attractive for liquid separation applications. Overall, it has been shown that the CDSA growth method yields good quality silica plugs in the case of hydrophobic supports by Methods B and C. Consistently good quality membranes were fabricated with Method C. Transport of precursors, placement of the support, TBOS height and evaporation of byproducts play key roles in the formation of good quality membranes. 4.4. Conclusions The counter diffusion self-assembly (CDSA) approach was shown to be effective for synthesizing mesoporous silica membranes. Results on straight pore polycarbonate track etch supports have shown that good quality membranes can be synthesized via this method. It was seen that while good quality plugging can be achieved in Method A, the desired microstructure of the plugs cannot be achieved. Method B and C, on the other hand, not only showed not only good support pore plugging, but also the required pore 124
structure in the plugs, with Method C showing higher consistency. The key factors for membrane formation were the facilitated transport of the precursors, support placement, reduced height of TBOS and evaporation of solvent and byproducts. Macroporous straight pore supports facilitate diffusion of the hydrophobic silica precursor and the amphiphilic surfactant, leading to formation of an ordered mesoporous structure within support pores. The hydrophobic supports yield better quality membranes than hydrophilic supports under the present synthesis conditions. There is however a small gap between the plugs and pore due to shrinkage on drying that is seen in all synthesis methods. Overall, this study has shown a way to synthesize good quality mesoporous silica membranes, which will lead to unprecedented applications in various industries.
125
Chapter 5 DEFECT SEALING IN CDSA MEMBRANES BY NOVEL LIQUID DEPOSITION TECHNIQUE 5.1 Introduction Oriented pore membranes can be successfully fabricated by the Counter Diffusion Self Assembly method, as reported in Chapter 4. These membranes were fabricated by growing fibers (called plugs) though the support pores. These plugs however, tended to shrink on drying, causing gaps which can be considered as defects in the membranes. A schematic representation of the plug formation and shrinking is shown in Figure 5.1. The shrinkage leads to gaps of about 0.15µm in between the plug and the support pore wall. This amounts to about 7% shrinkage in the plug. Shrinkage on drying is a common phenomenon in sol-gel derived systems and has been known to cause in defects in membranes. Sol-gel membranes undergo various steps during synthesis. The silica precursors, once they hydrolyze and condense, form a network. The voids in this network are initially filled with solvent. On removing the membrane from the synthesis solution and exposure to the atmosphere, the solvent starts to evaporate. This evaporation results in the shrinking of the network and as drying proceeds, capillary stresses exerted by the evaporating solvent increases matrix shrinkage [Brinker et al., 1990]. In some sol –gel derived systems, the shrinkage can be up to 30% [Chen et al., 1986]. In this system the shrinkage in the plug was estimated to be around 7%. These gaps need 126
to be filled if the membranes are to be used for any application. The present chapter reports a novel liquid deposition techniques that were developed to seal these gaps or defects.
Fresh Support CDSA growth CDSA growth Membrane with plug Drying Membrane with gap in between support and plug Gap (defect) Figure 5.1: Schematic showing various steps leading to formation of gap in membrane In the past two decades, there has been a great deal interest in the development of inorganic membranes. Given the robustness of inorganic membranes to high temperatures, and chemical and corrosive environments, they are expected to have certain niche applications where organic membranes fall short [Baker, 2002]. One of the main factors that limits the performance and subsequent use of inorganic membranes is the presence of defects [Fain et al., 1991; Lin et al., 2002; Vu et al., 2003; Zhang et al., 2009]. Defects can be highly detrimental to membrane performance since it reduces the selectivity of the
127
membrane due to preferential flow through the larger defect pores [Fain et al., 1991]. The cause of defects in inorganic membranes can vary based on the type of membrane. In supported membranes synthesized by sol-gel dip coating methods, one source of defects is the presence of a large pore size distribution in the porous support. This causes a disparity in capillary forces experienced by the synthesized membrane, which in turn leads to cracks. Furthermore, it is highly desirable to reduce the thickness of the selective layer of the membranes to enhance the flux. In these cases, uneven support surfaces result in defects such as pin holes [Koutsonikolas et al., 2010]. In porous membranes, another contributing factor is the synthesis chemistry. When sol-gel techniques are used, the material matrix tends to shrink on drying due to evaporation of the solvents (sometimes up to 30% shrinkage is observed), which causes cracks [Brinker et al., 1990]. The calcining process further causes shrinkage of the material due to condensation between M-OH groups [Brinker et al., 1990]. In zeolite membranes, defects are formed between grain boundaries when the material shrinks on template removal. In ordered mesoporous membranes, shrinkage of the silica matrix on drying and calcination can cause defects in membranes [Kumar et al., 2008]. A number of techniques have been developed to either try to eliminate these defects at the synthesis stage or to repair these defects in a post-synthesis step. In an effort to eliminate defects in microporous zeolites, template free methods have been utilized. In this method, a pre-prepared seed layer is dip 128
coated onto the support and this is then subjected to the synthesis solution to allow the membrane to grow in the absence of templates. This, in turn, reduces shrinkage during template removal [Pan et al., 2001]. In dip coated amorphous mesoporous membranes, multiple dipcoating techniques have been utilized to reduce defects [de Vos et al., 1998]. In mesoporous membranes, liquid extraction methods have also been used to minimize contraction of the matrix during surfactant removal. Post synthesis techniques to seal defects have also been extensively tried. Most studies have been conducted on microporous zeolite membranes to reduce mesoporous defects to below 2 nm. One widely used technique is Chemical Vapor Deposition (CVD) of silica precursors into the defect sites. These experiments can be carried out by counter diffusion or infiltration can be done from one side [Kanezashi et al., 2009]. In the counter diffusion method, silica precursors in vapor form are fed on the membrane side while water vapor is feed on the opposite side. The silica precursors and water vapor are expected to react in the defect sites, depositing silica and blocking the defects. In the one sided method, the silica precursor vapor is fed to the membrane side and is expected to infiltrate the defects where it then is deposited by cracking. These methods require a high system temperature of up to 500C. Other methods include coking, where a large molecule such a TIPB is infiltrated within the defects and is then heated to 500oC to form deposits in the defects. Patching of the defects is another viable method to remove defects [Chen et al., 2011], While these techniques have 129
been used with various degrees of effectiveness in zeolites, their use for the membrane synthesized in Chapter 4 is not possible since the polycarbonate support cannot withstand the temperatures used in these methods. As stated in previously, the defects in the membranes prepared by the CDSA method are due to shrinkage of the plugs on drying. Since the membranes cannot be heated to high temperatures, traditional methods of defect sealing in inorganic membranes cannot be used. This chapter reports on a novel liquid deposition technique that was developed to seal the defects. Here, the concept employed was to fill the defect area with microporous silica (pore size < 2 nm). The mesoporous membrane itself has a pore size of ~2.5 nm with microporous walls [Albouy et al., 2002]. Therefore, filling the gaps with microporous silica, will not lower the separation characteristics of the membrane. In this study, different configurations for defect sealing have been studied and the best sealing technique at room temperature has been identified. Defect sealing has been verified by gas permeation measurements and final membrane characteristics have also been studied. 5.2 Experimental A schematic representation of the various steps involved in defect sealing is as shown in Figure 5.2. The key steps taken for gap filling are as follows: Silica will be deposited in the gaps by reacting a liquid silica source with water. This will result in the formation of microporous silica in the gaps of the membrane and a microporous layer on the surface of the membrane. This layer 130
will need to be removed in order to expose the mesoporous plugs. Once this is removed by etching, the surfactants in the plugs will be removed by liquid extraction to open up the pore channels. 5.2.1. Sealing membrane gaps The membranes were prepared by the CDSA method as discussed in Chapter 4. The CDSA synthesized membranes with gaps were filled by silica. Two room temperature liquid deposition methods were studied in order to identify the best method to seal the gaps.
131
AS-SYNTHESIZED MEMBRANE
Gap
Support
Plug
SOAKING IN SILICA SOURCE Silica source
REACTION WITH WATER TO FORM MICROPOROUS SILICA Microporous silica
ETCHING TO REMOVE SURFACE SILICA
SURFACTANT EXTRACTION TO OPEN MESOPORES
Figure 5.2: Illustration of the entire gap sealing process, followed by etching and surfactant removal The first method studied was counter diffusion liquid deposition (CLD). In this method, as synthesized membranes, once dried, are dipped in a tertraalkoxysilane source and placed on acidified (HCl) water. This system is then left undisturbed for a predetermined period of time. The silica precursors and the water phase are expected to diffuse into the gaps and react within, leading to
132
deposition of silica within the gaps, hence, effectively sealing them. A schematic of the process used is as shown in Figure 5.3
As synthesized Membrane
Tetraalkoxysilane
Acidified water
Figure 5.3: Schematic of the counter liquid deposition step to remove gap between plug and support. The experiments were conducted at four different pH levels 0.5, 0.75, 1 and 2. Three different silica sources were used: tetramethylorthosilicate (TMOS), tetraethlyorthosilcate (TEOS) and tetrabutylorthosilicate (TBOS).
For the 0.5,
0.75 and 1 pH experiments, systems were left undisturbed for 4 days. At a pH of 2, the experiment was conducted for 2 weeks to allow sufficient time for condensation to occur since this is the isoelectric point of silica and the reactions are slowest at this pH. The second method studied was silica source infiltration and reaction with water vapor. In this method the membrane was soaked in a silica source (TMOS, TEOS or TBOS) for 4 hours. The membrane was then placed on blotting paper and pressed down to remove as much surface precursor as possible. It was then set aside to react with the water vapor in the environment for 2 days. Subsequent experiments were conducted at control humidity conditions to identify the best configuration for defect sealing. 133
H2O
Figure 5.4: Schematic of setup for infiltration followed by reaction with water vapor
5.2.2 Excess silica etching and Surfactant Removal by Extraction Any deposited silica on the membrane surface was then removed with a 20:1 water:hydrogen fluoride (HF) acid etch. During etching, the membranes were immersed in the etching solution and left for 15, 45, 60 or 75 s. The membranes were then removed and soaked in deionized water for 45 minutes to stop the etching process and remove any residual HF. The membranes were then left out dry. Once it was determined that all of the deposits on the surface were etched, the surfactant micelles that block the mesopores were removed by an extraction technique. In the acid synthesis, there is weak interaction between the surfactant and silica matrix, hence the surfactant can be removed easily by ethanol washing [Huo, et al., 1994]. Here, the membranes were soaked for 36 hours in an acidified ethanol solution (50 ml EtOH and 0.5 g of 37% HCl) to remove the surfactant. 5.2.3 Characterization Membranes where characterized at each step to ascertain membrane quality. Permeation experiments with constant transmembrane pressure were conducted to characterize the overall quality of the membranes. SF6 molecules 134
have a kinetic diameter of 5.5Å, hence they were used as an initial check to determine if there were any pores larger 5.5Å present in the system. Multicomponent O2 and He permeation measurements were conducted, during each step in the process in order to determine membrane He/O2 selectivity. The He/O2 selectivity was used as a measure to ascertain membrane quality. A schematic representation of the permeation setup used in this study is shown Figure 4.2 of Chapter 4. For the SF6 permeance measurements, 95% nitrogen and 5% SF6 were fed on the feed side. A total flow rate of 50 cc/min was maintained. Nitrogen sweep was fed on the permeate side at a flow rate of 50 cc/min. SF6 transmembrane pressure, defined as the partial pressure difference between the feed and permeate, was 5,000 Pa. For the selectivity experiments, a feed of 1:1 O2:He or 1:1 N2:He were fed at a flow rate of 50 cc/min. Argon was used as a sweep gas and fed at a flow rate of 50cc/min to the permeate side.
For each of the scheduled
experiments, the permeate and retentate flow rates were measured using a bubble flow meter, while the gas composition of the permeate was determined by running gas samples through a gas chromatographer (Agilent, 6890N) with a packed column (2836PC, Alltech) and a TCD detector.
Once the permeation
measurements had been conducted, SEM micrographs (FEI XL-30) were then used as a visual tool to ascertain the quality of the membranes in each step.
135
5.3 Results and Discussion 5.3.1 Results of Gap Sealing Studies The as-synthesized membranes have a SF6 permeance of 1.49x10⁻⁶ mol/m2Pas and a He:O2 selectivity of 1.09. Figure 5.5 shows an SEM micrograph of an as-synthesized (plugged) membrane showing gaps in between the plug and support. Two methods to seal the gaps by silica were studied. The effectiveness of the sealing techniques is discussed next.
Figure 5.5: As-synthesized membrane showing the presence of gaps between plug and support Counter diffusion liquid deposition (CLD) The SF6 permeation results of the membranes prepared by this method are as shown in Table 5.1. The reduction in selectivity for each of the different precursors and pH is shown in brackets. When TMOS is used, the permeance remains relatively constant at a value of around 5x10⁻⁷ mol/m2·Pa·s. TEOS systems show a steady decrease in permeance with increase in pH. In TBOS 136
systems, permeance is seen to vary between pH = 0.5 and pH = 1 and then increases drastically when pH = 2 was used. It is observed that most of the permeances lie in the 5x10⁻⁷, mol/m2Pas. range. This amounts to a reduction in permeance ranging from 2 to 4 times the original amount. The three anomalies seen are when TEOS was used with a pH of 0.5 and 2 and TBOS under pH of 2 was used. Table 5.1: SF6 permeance for membranes synthesized with different precursors at various pH
Sample pH 0.5 pH 0.75 pH 1 pH 2
Permeance x 10-7, mol/m2Pas. , (In brackets reduction in permeance from as-synthesized membrane) TMOS TEOS TBOS 5.53 (2.69) 9.24 (1.61) 5.43 (2.74) 5.50 (2.70) 8.35 (1.78) 6.9 (2.16) 4.68 (3.19) 6.96 (2.13) 3.73 (3.99) 6.8 (2.18) 1.71 (8.69) 2.1 (1.22)
In order to determine if this reduction in permeance was due to deposition of amorphous silica on the surface or within the gaps, SEM studies were conducted. Figure 5.6 shows low and high magnification images of membranes after secondary growth using TMOS as the precursor. As seen from the images, a rather thick silica layer can be seen on the membrane surface. The image at higher magnification indicates that there is some deposition within the gap, as revealed by a thin ring of silica that is seen around the plug. There seems to be considerable stress at the edge of the pore, as indicated by the cracking in the image. SEM images of secondary growth conducted with TEOS as the precursor 137
at 0.5 pH is seen in Figure 5.7. The images indicate that a thinner layer of silica has been deposited in this case. The sealing procedure seems to have resulted in more deposition within gaps between the plug and support than on the support surface.
Figure 5.6: Membranes after secondary with TMOS and acid at pH 0.5 at low and high magnification
Figure 5.7: Membranes after secondary with TEOS and acid at pH 0.5 at low and high magnification Figure 5.8 shows the results of the CLD technique using TBOS as a precursor at pH 0.5. It is observed that there is a thin sheet of silica around each plug in the support. These images seem to indicate that there is some deposition of silica within the gap between plug and support. However, for the most part, the 138
images from all three methods seem to indicate that the gaps are not completely filled via the CLD technique.
Figure 5.8: Membranes after secondary with TBOS and acid at pH 0.5 at low and high magnification Permeance measurements, in conjunction with the SEM studies, reveal that all three methods did not lead to complete filling of the gaps. The three anomalies in the permeance data can be explained by the differences in reaction kinetics of the three systems. It is well known that the rate of hydrolysis is significantly impacted by the type of alkoxysilane used. The reaction rate is considerably slowed down for systems with longer the alkyl chain lengths [Aelion et al., 1950]. The hydrolysis rate constant k for TMOS is 0.19 l/mols[H+]-1 and 0.051 and 0.019 l/mols[H+]-1 for TEOS and TBOS respectively [Chen et al., 1986]. The pH also has a very important role to play in sol-gel kinetics. It has been reported that the gel time increases with increases in pH, reaching a
139
maximum at a pH of 2. This is the isoelectric point of silica. At this pH, gelation is very slow [Coltrain et al., 1989]. From permeation data, it is observed that TMOS as a precursor resulted in membranes whose quality did not fluctuate much with pH. In this case, very thick deposition of silica is observed on the surface. This is likely due to the fact that the rate of reaction is very fast and the pH effect is not observable. On the other hand, TBOS has a very slow reaction rate. Because of the slow reaction rate, the effect of pH is not discernable until pH 2 is used. At this pH, the reaction rate is slowed down to the extent where the reaction almost ceases. This results in membranes with little improvement post CLD. Of the three precursors, TEOS shows the most change in gap sealing quality with pH. At low pH, it is believed that the reaction time and gel time are so fast, that hardly any TEOS is deposited in the gaps. Instead, it precipitates into the water phase. The SEM images support this belief as no film is observed. At pH 2, the condensation rate of TEOS is believed to be reduced sufficiently to cause deposition within the gaps and limit precipitation. Though this method resulted in the best sealing, the permeance was still high, indicating the gaps are not completely sealed. The other method attempted was silica source infiltration followed by reaction with water vapor. As explained earlier, in this system, the membrane was soaked in a silica source and allowed to react with water vapor instead of water. Initial experiments consisted of using three precursors TMOS, TEOS and TBOS to identify the best silica precursor for this method. The results of SF6 140
permeation measurements for membranes sealed with different silica sources at ambient conditions is shown in Table 5.2
It is observed that TBOS gives best
results with an SF6 permeance below the detection limit of the GC (which is ~1010
mol/m2·Pa·s). This low permeance value indicates that amorphous silica is
deposited in the gaps in the membrane. This also shows that the deposited silica is microporous in nature with a pore size of less than 5.5 Å.
The SF6 permeance
value for TMOS sealed membranes is 7.92 x 10⁻⁹ mol/m2·Pa·s. This is a three times decrease in permeance from the as-synthesized membrane which indicates that the gaps are well sealed. However, leaving the TMOS soaked membranes in a Petri dish caused them to adhere to the plastic, thus making these membranes difficult to remove.
This makes TMOS less attractive than TBOS. The SF6
permeance in the TEOS system was the highest, measuring 3.45x10⁻⁷mol/m2Pas. The higher permeance in TEOS and TMOS systems can be attributed to the higher shrinkage of these systems than TBOS upon gelation. TEOS shrinkage is on average seen to be higher than TMOS which leads to the higher permeances between the two [Chen et al., 1986]. Therefore, based on the above results, TBOS was chosen as the best silica precursor for sealing the gaps. This leads to the idea that, if the silica source was allowed to infiltrate the defects and then the reaction was allowed to progress from the surface into the defect sites, better quality plugging could be achieved.
141
Table 5.2: SF6 permeance after gap sealing with different silica precursors SF6 permeance (mol/m2·Pa·s) 7.92 x 10⁻⁹ 3.45 x 10⁻⁷ < 1 x 10⁻¹⁰
Silica Precursor TMOS TEOS TBOS
To determine the optimal conditions for sealing, the effect of humidity was also studied. The results of these studies are summarized in Table 5.3. Table 5.3: SF6 permeance for membranes sealed at different humidities Percentage relative humidity 10 25 70 100
SF6 permeance (mol/m2Pas) < 1x10⁻¹⁰ < 1x10⁻¹⁰ 7.04x10⁻⁷ 1.12x10⁻⁶
Reduction in permeance ≥ 15000 ≥ 15000 2.11 1.33
The SF6 permeance of the sealed membranes increases with rising relative humidity. It is a well understood phenomenon that silica gels tend to crack and shrink due to capillary stresses involved during the drying process [Brinker et al., 1990]. It is believed that, in low humidity environments, less water condenses into the system. Hence, stresses are lower, causing less shrinkage and cracking of the deposited silica. It was determined from these experiments that the second method of gap sealing at low humidities results in good quality sealing of gaps. An SEM micrograph of a membrane sealed at 10% RH is shown Figure 5.9.
The
micrograph shows a number of plugs that have been sealed by the infiltration
142
technique. A thin film of silica is seen on top of the membrane that would need to be removed by etching.
Figure 5.9: Top view of a membrane with the gaps sealed by infiltration method at 10% RH 5.3.2 Characteristics of Membranes with Sealed Gaps The second method of sealing the membranes described in 5.3.1. results not only in infiltration of the defects but also deposition of an amorphous thin film of silica on the surface which needs to be etched away (Figure 5.10). The cross sectional micrograph with the plug removed indicates that the film is about 2 microns thick.
143
a)
b)
Figure 5.10: a) Cross sectional view of the membrane after gap filling. The plug is removed in this image to make visualization easy. b) The amorphous silica deposits have been outlined for easy visualization Initially, an ammonium hydroxide (30% NH4OH), hydrogen peroxide (30% H2O2) and D.I water etch was used at a ratio of 5:1:1. With this etchant, the support was preferentially attacked, leaving very wide gaps and compromising the integrity of the membrane. To overcome these issues, HF etching was undertaken. Initially 1:10 (HF:H2O) was used. This resulted in a very fast etch rate that led to etching of the plugs in addition to the silica films. To lower the rate of etch, a 1:20 HF:H2O solution was tried. The quality of the membranes, post etching for different times, was first tested using SF6 permeance, the results of which are shown in Table 5.4. Table 5.4: SF6 permeance post HF etching with 1:20 (HF: H2O) solution. Etch time, s SF6 permeance, mol/m2Pas 15 2.99 x 10⁻⁸ 45 4.04 x 10⁻⁸ 60 8.94 x 10⁻⁷ 75 8.80 x 10⁻⁷ *unetched membrane has a permeance of < 1 x10⁻¹⁰ (Under detection limit) 144
It is observed that the permeance of the membranes increase with increasing etch time. Beyond 45 seconds, the plug and the microporous silica in the wall is attacked. This eventually leads to defects in the membrane. SEM images of a plug etched for 45 s (Figure 5.11) reveals an amorphous silica collarlike structure between the plug and the support which is effectively sealing the gap. a)
b)
Plug
Microporous silica 5 Figure 5.11: SEM micrograph showing a plug within a support pore a) with the gap sealed before etching, b) with microporous silica filling the gap between plug and support post etching Once the membrane was etched, the surfactant was removed by liquid extraction. The membranes, post-extraction, have an SF6 permeance of 1.17x10⁻⁶ mol/m2∙Pa∙s. This is an order of magnitude higher than the permeance of the etched membrane. This is a strong indication that the surfactant has been completely removed.
145
Gas permeation through membranes can be described by a simplified version of the Dusty-Gas model [Lin and Burggraaf, 1993]:
Pf Pp F 2
(5.1)
where F is permeance, and Pf and Pp represent the feed and permeate pressures. Here, Knudsen diffusion and viscous flow are represented respectively by and in Equation 5.1. The values of each of which can be calculated from the following equations [Lin and Burggraaf, 1993]:
1 rp 1.06 L RTM w
(5.2)
1 rp 0.125 L RT
(5.3)
2
where L is the membrane thickness, is the porosity, is pore tortuosity, is viscosity and Mw molecular weight of the permeating species, rp is pore radius, T is the temperature of the system and R is the universal gas constant. As seen from Equation 5.1, viscous flow though a membrane is a function of the pressure drop between the feed and permeate side. This is the predominate flow observed in macroporous systems. When this type of flow is prevalent, the selectivity of the system is dependent on the difference in viscosity of the flowing gas. Since the viscosity of most gases lie within a narrow range, the selectivity of the membrane is greatly reduced and is dependent on the ratio of the feed gases. For a feed of 50:50 O2:He, one could expect a selectivity of close to 1 if viscous flow was dominant. 146
Knudsen flow is predominately observed in mesoporous systems. From Equation 5.2, it can be seen that the permeance is an inverse function of molecular weight of the diffusing gas. When this type of flow is dominant (as it is in mesoporous systems), the selectivity of the membrane system is expected to be equal to the inverse ratio of the square roots of molecular weights of the permeating gases. Table 5.5 summarizes the SF6 and multicomponent permeation data for the membranes at various stages. A four order magnitude decrease in SF6 permeance is observed on first sealing the defects. This decrease in permeation shows that the pores are predominantly microporous in nature with a majority of the pores being less than 5.5 Å in diameter. The N2 and O2 permeance dropped by an order of magnitude to 1.94x10⁻⁷ mol/m2∙Pa∙s and 1.61x10⁻⁷ mol/m2∙Pa∙s respectively. The initial He/O2 selectivity of the as-synthesized membrane was measured to be 1.09 indicating that the flow is predominately viscous in nature. On sealing the gaps, selectivity rose to 3.96. This selectivity is higher than the ideal Knudsen selectivity for He/O2 which is 2.83. The higher selectivity value is typical of a microporous system, where molecular sieving is the dominant separation mechanism. On etching, the SF6 permeance increases to about 4x10⁻⁸ mol/m2∙Pa∙s. This increase is probably due to the removal of the two micron thick microporous membrane on the support. The permeance of other gases also experienced a
147
marginal increase, but the selectivity still remains much higher than Knudsen selectivity, signifying that the membrane is still microporous. Once the surfactant is extracted, a remarkable increase in SF6 permeance is observed (1.17 x10⁻⁶ mol/m2∙Pa∙s) due to the opening up of the mesopores. The O2 and N2 permeance also increased by less than an order of magnitude to 2.00x10⁻⁶ and 1.65x10⁻⁶ mol/m2∙Pa∙s respectively.
A reduction in the He/O2
selectivity (3.30) is observed. This selectivity, though lower than previously seen, is still higher than Knudsen selectivity. This result is expected as the system is now made of both microporous and mesoporous pores. The microporosity in the system comes from the microporous sealed areas and the walls of the pore channels in the plugs. The selectivity, therefore, is expected to be a compound selectivity which is higher than the Knudsen selectivity. It is estimated that the gap that existed between the plug and the support pore wall in the as-synthesized membrane constitutes about 7% of the area available for permeance in the membrane. This gap is now filled with microporous silica. The remaining 93% of the area is occupied by the plug, which has been reported to have a microporosity of 30% that comes from the amorphous walls [Albouy et al., 2002]. Taking these values into account, the predicted selectivity comes to 3.35. (The calculations to determine the selectivity of the membrane are shown in Appendix B). This value is very close to the experimentally obtained value of 3.30. This shows that the membrane that is obtained is of good quality. 148
Table5.5: Permeance and selectivity data for as-synthesized, sealed, etched and extracted membrane Permeance, mol/m2∙Pa∙s
Selectivity
Membrane
SF6
N2
O2
He/O2
He/N2
Assynthesized Sealed
1.49x10⁻⁶
2.41x10⁻⁶
1.93x10⁻⁶
1.09
-
< 1.00x10⁻¹⁰
1.94x10⁻⁷
1.61x10⁻⁷
3.96
3.76
Etched
4.04x10⁻⁸
3.69x10⁻⁷
2.61x10⁻⁷
4.33
4.31
Extracted 1.17x10⁻⁶ 2.00x10⁻⁶ Knudsen selectivity for He/O2 is 2.83 Knudsen selectivity for He/N2 is 2.64
1.65x10⁻⁶
3.30
3.44
The above results reveal that good quality membranes have been synthesized by the CDSA method and any defects in the membranes between the plug and support walls (or any empty support pores) are now sealed with microporous silica, leading to a defect free membrane. Table 5.6 compares the N2 permeances obtained in this work with those previously published in literature. It is observed that most of the membranes fabricated by various techniques have permeances on the order of 10-7-10-8 mol/m2∙Pa∙s. The nitrogen permeance in this work is an ordered of magnitude higher. This believed to be because of the absence of a thick, macroporous support. In this work, the membrane was embedded in a polymeric film of only 10 m in thickness. This results in higher permeance, as no added resistance from the support is experienced during permeation. Similar permeance values obtained when ordered mesopores were grown within an anopore membrane corroborate this result [Yoo et al., 2006].
149
Table 5.6: Comparison of nitrogen permeance of mesoporous silica membranes prepared in this work with other preparation methods
Membrane synthesis method
N2 permeance, mol/m2∙Pa∙s
Reference
1.5x10⁻⁷
McCool et al., 2003
1.4x10⁻⁷
Sakamoto et al.,2007
2.8x10⁻⁸
Seshadri et al.,2010
8.5x10⁻⁸
Kumar et al.,2006
Spin coating
4.1x10⁻⁸
Sakamoto et al., 2007
Dip coating
2.5x10⁻⁷
McCool et al., 2003
Dip coating +Evaporation Induced self assembly
2.0x10⁻⁶
Yoo et al., 2006
Aerosol assisted deposition
9.0x10⁻⁷
Xomeritakis et al., 2003
0.45x10⁻⁷
Alsyouri et al., 2006
1.65 x10⁻⁶
This work
Hydrothermal synthesis
Counter Diffusion Self Assembly on alpha alumina supports Counter Diffusion Self Assembly in polycarbonate support
150
Comparison of the two mechanisms for defect sealing The first method for defect sealing with a two phase system did not lead to good quality sealing. Results suggested that deposition of microporous silica is highly dependent on the contact point between the silica and water phase. In some cases, the reaction proceeds so rapidly that the precipitation of silica into the liquid phase occurs, whereas in other cases, deposition takes place on the surface with minimal gap filling. This idea is depicted in Figure 5.12. As shown in the figure, the reaction can take place on the surface depositing a layer of silica or the reaction can take place just inside the gap on either side of the membrane. The microporous silica can also precipitate into the water phase which does not result in any gap filling. This implies that the supply of reactants to the site of the defects is crucial and very difficult to control with a two phase system.
Silica Source
Water
Figure 5.12: Schematic showing the different points at which the gap can be filled to seal defects In the second method of sealing where the membrane was soaked in silica source and allowed to react with water vapor, good quality, reproducible sealing 151
was obtained. An important idea that was focused on here, is having the silica source penetrate all the defects and excluding any other phases (like the water phase), in bulk quantities, in the system. This methodology forced the silica source to be the only wetting phase in the system and allowed no preferential wetting by the water phase or silica precipitation into a bulk water phase. The mechanism for the reaction is as follows. Initially, the as-synthesized membrane was allowed to soak in silica source. It was then left in a low humidity environment so the reaction could proceed. The silica source present within the defects reacted with the water vapor in the environment allowing it to hydrolyze and condense to from microporous silica. Microporous silica is initially believed to be formed on the surface. In time, water molecules penetrate into the system through these pores to from microporous silica deeper within the system. The reaction interface continues to penetrate deeper and deeper until the entire silica source is reacted, leaving only microporous silica within the defects. This is schematically depicted in Figure 5.13 The second important criterion for sealing was humidity in the environment. It was determined that for good quality seals, the relative humidity in the environment needed to be less that 25%. This prevents condensation or absorption of excess unreacted water, while allowing reaction to take place. This eliminated any stresses that the system experienced on drying and reduced defects in the microporous silica.
152
SILICA SOURCE SOAK Silica source
REACTION WITH WATER VAPOR TO FORM MICROPOROUS SILICA Microporous silica on reaction with water vapor
REACTION PROPOGATION INTO THE INNNER PARTS TO FORM MICROPOROUS SILICA IN GAPS Microporous silica
Figure 5.13: Illustration of the entire gap sealing process in the source infiltration and reaction with water vapor method 5.4 Conclusions This chapter dealt with sealing the gaps that were present in the CDSA method by room temperature liquid deposition techniques. Two techniques were studied for gap sealing. In the first method, a two phase system was used. The assynthesized membrane that was soaked in a silica precursor and allowed to stand on an acidified water phase. Three different precursors were studied at different pH conditions. This method did not yield good quality sealing. The second method, a liquid deposition technique, has been successfully developed for defect sealing in membranes. In this method, the membranes were allowed to soak in a 153
silica source and then reacted with water vapor in a low humidity environment. The key factor that influences the quality of the seal is found to be the availability of the silica source at the point of the defect. This can be controlled by making the silica source the only bulk phase available. The second important factor is to maintain low humidities to ensure no condensation of water, which could lead to stresses and defects when drying the sealed membrane. Using the second approach, defects in membranes were successfully sealed, as revealed by the high selectivity factors for He:O2 and low SF6 permeance. Once surfactant was removed by extraction, the membrane showed a N2 permeance of 2.00x10⁻⁶ mol/m2∙Pa∙s. The high selectivity of the membrane indicated that the defects have been removed and good quality membranes have been synthesized. The liquid deposition technique has been seen to be a very effective way for defect sealing in CDSA membranes, and this approach could possibly be used in other systems with equal success.
154
Chapter 6 SUMMARY AND RECOMMENDATIONS 6.1 Summary Ordered mesoporous materials have exciting prospects as membrane materials due their highly tunable pore sizes, large surface areas and well defined pore structures. The present challenges, however, include synthesizing these materials into membrane morphologies. These membranes can be fabricated in two different morphologies, either as supported or as embedded membranes. In supported membranes, challenges are the synthesis of defect free membranes, and synthesis of high selectivity and flux membranes. One potential area where these membranes can be utilized is in vapor-gas separation systems, as they are expected to provide high selectivities due to capillary condensation. In the area of embedded membrane morphology, the challenge is to fabricate membranes with straight through pores which would lead to use in a number of applications. The present work has tackled the synthesis of novel membranes in both supported and embedded morphologies. Chapter 2 has dealt with the synthesis of supported MCM-48 membranes and Al-MCM-48 membranes via the hydrothermal synthesis method. MCM–48 membranes exhibit a maximum water vapor to oxygen separation factor of 17 with a water permeance of 1×10⁻⁷ mol/m2Pas. The incorporation of aluminum into MCM-48 to fabricate Al-MCM-48 membranes resulted in a separation factor of 142. This is a nearly eight times increase in separation factor. However, a 1.5 times decrease in permeance is observed. This could be attributed to the increased 155
thickness of the Al-MCM-48 membrane, which is twice as thick as the MCM-48 membrane. The selectivity of the Al-MCM-48 membrane was found to be comparable to that offered by a three times CVD modified sol-gel derived alumina membrane, making these particular membranes a good alternative to traditional sol-gel derived membranes for water vapor separation. Chapters 3-5 aimed at synthesizing ordered mesoporous membranes with oriented pores in the embedded morphology. In Chapter 3, synthesis of ordered mesoporous silica materials in a quiescent two-phase acidic system is presented. The effect of the height of tetrabutylorthosilicate (TBOS) and humidity on fiber morphology and microporous structure was evaluated. Both of these factors are seen to have a profound effect on fiber morphology and long range order. The length of the fiber can be tailored by fixing the height of the TBOS layer. The maximum TBOS height at which the fibers with good long range channel order can be synthesized is around 0.144 cm above the solution interface. The humidity of the system had a greater effect on product morphology than on micropore structure. The results suggest that, along with mole ratio of reactant systems, the silica source height also needs to be reported for fiber synthesis experiments by the interfacial method. Results from both source height and humidity studies indicate that condensation rate of the silica has a very profound effect on final product morphology. Both of these parameters need to be controlled for good quality fiber synthesis.
156
The synthesis of ordered mesoporous membranes with controlled pore orientation was addressed in Chapter 4. The counter diffusion self-assembly (CDSA) approach was shown to be effective in synthesizing mesoporous silica membranes. Results on straight pore polycarbonate track-etch supports have shown that good quality membranes can be synthesized via this method. The key factors for membrane formation were the facilitated transport of the precursors, support placement, TBOS height and evaporation of the solvent and byproducts. Macroporous straight pore supports facilitate the diffusion of the hydrophobic silica precursor and the amphiphilic surfactant, leading to the formation of an ordered mesoporous structure within support pores. Hydrophobic supports yield better quality membranes than hydrophilic supports under the present synthesis conditions. There is, however, a small gap between the plugs and support due to shrinkage on drying that is seen in all synthesis methods. The sealing of the gaps in the membranes synthesized by the CDSA method was addressed in Chapter 5. In this chapter, a novel defect sealing liquid deposition technique has been successfully developed. In this method, the membranes were allowed to soak in a silica source. Once removed, from the source, the membranes reacted with water vapor in a low humidity environment. The key factor that influences the quality of the seal is the availability of the silica source at the point of the defect. This can be controlled by making the silica source the only bulk phase available. The second important factor is to maintain low humidities to ensure no condensation of water on or within the membranes. 157
The presence of water could lead to stresses and defects when drying the sealed membrane. Using this approach, defects in membranes were successfully sealed as revealed by high selectivity factors for He:O2 and low SF6 permeance. Any microporous silica that had been deposited on the surface was then removed by wet etching using a hydrofluoric acid (1:20 HF:H2O) solution for 45 s. Once the surfactant was removed by extraction, the membrane showed a N2 permeance of 2.00 x10⁻⁶ mol/m2∙Pa∙s. The high selectivity of the membrane indicated that the defects have been removed and good quality membranes have been synthesized. The liquid deposition technique has been seen to be a very effective way for defect sealing in CDSA membranes and this approach could possibly be used in other systems with equal success. 6.2 Future recommendation Based on the results in this dissertation the following recommendations are suggested for future research. Water vapor/oxygen separation The incorporation of aluminum in the MCM-48 membrane matrix has been shown to enhance selectivity by almost eight-fold as reported in Chapter 2. However, the permeance of these membranes is too low to be competitive. To enhance the performance, either the film thickness or support resistance must be decreased. Various strategies can be used to make thinner membranes. Since membranes are fabricated by deposition of ordered mesopores onto the membrane, one strategy could be to lower the volume of the synthesis solution. 158
Other techniques such as spin and dip-coating could also be utilized as these techniques, on average, produce thinner membranes. To decrease support resistance, an asymmetric -alumina membrane support could be utilized. This composite support consists of layers made by A13 (large particle size), followed by A-15 (intermediate particle size) and then A16 (small particle size). These powders could be coated in successive layers by either cold pressing each subsequent layer or by dip coating successive layers of A-15 and A-16 onto an A-13 support. This type of support would minimize flow resistance of gases through the pores. Fiber synthesis Mesoporous silica fibers produced in this work by quiescent interfacial methods could only be synthesized with a narrow range of TBOS heights. This implies that, though the rate of hydrolysis and diffusion in the system is fairly low, at higher local silica concentrations, the condensation rate exceeds the rate of diffusion of the surfactant to the interface. This would imply that by using higher surfactant concentrations or additives that retard condensation, fibers could be synthesized at higher TBOS heights. Systematic studies can be conducted to study the effect of changing surfactant concentration and condensation retarding additives on fiber formation for larger silica heights. The studies presented in this work also indicate that humidity has a profound effect on fiber morphology. A systematic study can also be conducted to identify the range of humidities at which fibers with a smooth external morphology can be obtained. Studies also 159
need to be undertaken to understand the formation mechanism of the fibers. Furthermore, additional work should be done to study the internal pore ordering of the fiber at various stages of synthesis and under various synthesis conditions to understand the formation process. Membrane synthesis by CDSA method The CDSA method has been shown to be an extremely successful technique to form oriented pore membranes. However, the synthesis times for these membranes is very long and can take as long as 2 weeks. Attempts should be made toward using other silica sources (such as TEOS) which are known to produce fibers in a shorter period of time. These sources, however, do not yield fiber morphology with as much fidelity as TBOS systems. Therefore, efforts will need to be undertaken to optimizes fiber synthesis using other sources first before they can be applied to the CDSA method. The support material (polycarbonate) used in the present study restricts the use of these membranes to room temperatures. Straight pore membrane supports such as capillary glass arrays or silicon wafers with ordered pores need to utilized to extend the applicability of these membranes to higher temperature processes. Lastly, the pore channels in these membranes run helically around the fiber axis. Attempts should be made to fabricate straight pore membranes using this technique.
160
Membrane defect sealing The method of defect sealing presented in this dissertation is seen to be highly effective and is not energy intensive. However, improvements can still be made. Incorporating acidic vapors into the system would speed the reaction that seals the gaps. This procedure could also be extended to other membrane systems. For sealing microporous defects, smaller precursor molecules could be utilized.
161
REFERENCES Aelion R., Loebel A. & Eirich F. (1950) The hydrolysis and polycondensation of tetra alkoxysilanes, Recueil des Travaux Chimiques des Pays-Bas, 69, 61– 75. Aksay, I.A., Trau, M., Manne, S., Honma, I., Yao, N., Zhou, L., Fenter, P., Eisenberger, P. M. & Gruner, S.M. (1996) Biomimetic pathways for assembling inorganic thin films, Science, 273, 892-898. Albouy, P., & Ayral A. (2002) Coupling X-ray Scattering and Nitrogen Adsorption: An Interesting Approach for the Characterization of Ordered Mesoporous Materials. Application to Hexagonal Silica, Chemistry of Materials, 14, 3391-3397 Alsyouri, H.M. & Lin, Y.S. (2003) Effects of Synthesis Conditions on Macroscopic and Microscopic Properties of Ordered Mesoporous Silica Fibers, Chemistry of Materials, 15, 2033- 2039. Alsyouri, H.M. (2004) Synthesis of ordered mesoporous silica and alumina with controlled macroscopic morphologies, Ph.D. Dissertation, University of Cincinnati, Cincinnati, OH. Alsyouri, H.M. & Lin, Y.S. (2005) Gas Diffusion and Microstructural Properties of Ordered Mesoporous Silica Fibers, Journal of Physical Chemistry B, 109, 13623-13629. Alsyouri, H.M., Li, D., Lin, Y.S., Ye, Z. & Zhu, S.P (2006) Counter diffusion self-assembly synthesis of nanostructured silica membranes, Journal of Membrane Science, 282, 266- 275. Arabi, M. K. A. & Reddy, K. V. (2003) Performance evaluation of desalination processes based on the humidification/dehumidification cycle with different carrier gases, Desalination, 156, 28 l-293. Araki, S., Satoh, T., Doi, H., Yano, H., Miyake, Y. (2009) Properties of aminofunctionalized silica membranes for the dehydration of water/ethanol mixtures, Desalination Water Treatment, 7, 12-17. Araujo, S.A., Ionashiro, M., Fernandes Jr., V.J. & Araujo, A.S. (2001) Thermogravimetric Investigations During the Synthesis of Silica-based MCM-41, Journal of Thermal Analysis and Calorimetry, 64, 801-805.
162
Asaeda, M., Dlnh Du, L. & Ikeda, K. (1986) Experimental Studies Of Dehumidification Of Air By An Improved Ceramic Membrane, Journal of Chemical Engineering of Japan, 19, 238-240. Atkins P.W., Physical Chemistry, Oxfrod, 1994. Baccile N, Teixeira C. V., Amenitsch H., Villain F., Lindén M. and Babonneau F. (2008) Time-Resolved in Situ Raman and Small-Angle X-ray Diffraction Experiments: From Silica-Precursor Hydrolysis to Development of Mesoscopic Order in SBA-3 Surfactant-Templated Silica, Chemistry of Materials, 20, 1161–1172. Bachari, K., Touileb, A. (2009) Iron-modified mesoporous SBA-15 silica: Preparation and characterization studies, Solid State Sciences, 11, 15491555. Baker, R. W. (2002) Future Directions of Membrane Gas Separation Technology Industrial and Engineering Chemistry Research, 41,1393–1411 Beck, J.S., Vartuli J.C., Roth W.J., M.E. Leonowizc, Kresge C.T., Shmitt K.D., Chu C.T., Olson D.H., Shepard E.W., McCullen S.B., Higgins J.B., & Schlenker J.L. (1992) New Family Of Mesoporous Molecular-Sieves Prepared With Liquid-Crystal Templates, Journal of American Chemical Society, 114 ,10834-10843. Bhat, S.D., Naidu, B.V.K., Shanbhag, G.V., Halligudi, S.B., Sairam, M. & Aminabhavi, T.M.. (2006). Monodispersed MCM-41 large particles by modified pseudomorphic transformation: Direct diamine functionalization and application in protein bioseparation, Sepration Purification Technology, 49, 56-63. Boffa, V., Elshof, J. & Blank, D. (2007) Preparation of templated mesoporous silica membranes on macroporous α-alumina supports via direct coating of thixotropic polymeric sols, Microporous and Mesoporous Materials, 100, 173-182. Boissi`ere, C., Martines , M.U., Larbot, A. & Prouzet, E., (2005) On the specific filtration mechanism of a mesoporous silica membrane, prepared with non-connecting parallel pores, Journal of Membrane Science, 251,17–28 Bonne, U., Deetz, D. W., Lai, J. H. J., Odde, D. J. & Zook, J. D. (1990) US Patent Number 4900448, Membrane dehumidification.
163
Bredesen, R., Jordal, K. & Bolland, A. (2004) High-temperature membranes in power generation with CO2 capture, Journal of Chemical Engineering and Processing, 43, 1129-1158. Brinker J. & Scherer G. (1990) Sol-Gel Science: The Physics and Chemistry of Sol-Gel Processing, Academic Press Inc., San Diego. Brinker, C. J., Lu, Y. , Sellinger, A. & Fan, H. (1999) Evaporation-Induced SelfAssembly: Nanostructures Made Easy, Advanced Materials, 11, 579-585. Burkett, S., Sims, S., Mann, S. (1996) Synthesis of hybrid inorganic–organic mesoporous silica by co-condensation of siloxane and organosiloxane precursors, Chemical Communications, 1367-1368. Cagnol F., Grosso D., Soler-Illia G. J.de A. A., Crepaldi E. L., Babonneau F., Amenitsch H. & Sanchez C. (2003) Humidity-controlled mesostructuration in CTAB-templated silica thin film processing. The existence of a modulable steady state, Journal of Material Chemistry, 13, 61–66. Chen, J.Y., Pan, F.M. , Chang, L. , Cho, A.T. & Chao, J. (2005) Thermal stability of trimethylsilylated mesoporous silica thin films as the ultralow-k dielectric for copper interconnects, Journal of Vacuum Science and Technology, 23, 2034-2040. Chen, K.C., Tsuchiya, T., & Mackenzie, J.D. (1986) Sol-gel processing of silica: I. The role of the starting compounds, Journal of Non-Crystalline Solids, 81, 227-237. Chen, Z., Yin,D., Li, Y., Yang,J., Lu, J., Zhang J., & Wang , J. (2011) Functional defect-patching of a zeolite membrane for the dehydration of acetic acid by pervaporation, Journal of Membrane Science, 369 ,506-513. Chowdhury, S. , Peters, A., Blank, D. & Elshof, J. (2006) Influence of porous substrate on mesopore structure and water permeability of surfactant templated mesoporous silica membranes, Journal of Membrane Science, 279, 276-281. Chowdhury, S., Schmuhl, R., Keizer, K., Elshof, J. & Blank, D. (2003) Pore size and surface chemistry effects on the transport of hydrophobic and hydrophilic solvents through mesoporous γ-alumina and silica MCM-48, Journal of Membrane Science, 225, 177-186.
164
Chu Y.H., Kim H.J., Song K.Y., Shul Y.G., Jung K.T., Lee K. & Han M.H. (2002) Preparation of Mesoporous Silica Fiber Matrix for VOC Removal, Catalysis Today, 74, 249-256. Coltrain, B. K., Melpolder, S. M. & Salva, J. M. (1989) Proceedings of the IVth International Conference on Ultrastructure Processing of Ceramics, Glasses, and Composites, D. R. UhlmannD. R. Ulrich, Wiley, New York. Cooper, C.A. & Lin, Y.S. (2002) Microstructural and gas separation properties of CVD modified mesoporous g-alumina membranes, Journal of Membrane Science, 195, 35–50. Danumah, Ch., Vauderuil, S., Bonneviot, L., Bousmina, M., Giasson, S.,Kaliaguine, S. (2001) Synthesis of macrostructured MCM-48 molecular sieves, Microporous and Mesoporous Materials, 44–45, 241-247. de Vos, R. M., & Verweij,H. (1998) Improved performance of silica membranes for gas separation, Journal of Membrane Science, 143, 37-51. Edler, K. & Roser, S. (2001) Growth and characterization of mesoporous silica films, International Reviews in Physical Chemistry 20, 387-466. El-dessouky, H. T., Ettouney, H. M. & Bouhamra, W. (2000) A novel air conditioning system: Membrane air drying and evaporative cooling, Chemical Engineering Research and Design, 78, 999-1009. Elkamel, A. & Noble, R. D. (1992) A statistical mechanics approach to the separation of methane and nitrogen using capillary condensation in a microporous membrane, Journal of Membrane Science, 65, 163-172. Fain, D.E. (1991) Technical and economic aspects and prospects for gas separation with inorganic membranes, Inorganic Membranes ICIM 2, 327336. Fan, J., Boettcher, S.W, Tsung, C.-K. , Shi, Q., Schierhorn, M. & Stucky, G.D. (2008) Field-Directed and Confined Molecular Assembly of Mesostructured Materials: Basic Principles and New Opportunities, Chemistry of Materials, 20 909-921. Farooq, F. A., Mukhtar, H. , Man, Z. & Dutta, B. K. (2007) Predicting Separation of Lower Hydrocarbon from Natural Gas by a Nano-Porous Membrane using Capillary Condensation, Chemical Engineering and Technology, 30, 1266-1273. 165
Feng, P., Bu, X. & Pine, D. (2000) Control of Pore Sizes in Mesoporous Silica Templated by Liquid Crystals in Block Copolymer-Cosurfactant-Water Systems, Langmuir, 16, 5304-5310. Feng, X., Fryxell, G., Wang, L.Q., Kim, A., Liu, J., Kemner, K. (1997) Functionalized Monolayers on Ordered Mesoporous Supports, Science, 276, 923-926. Fernandez-Martin C., Edler K. J. & Roser S. J. (2004) Humidity and temperature effects on CTAB-templated mesophase silicate films at the air-liquid interface, Langmuir, 20, 10679–10684. Fosmoe, A., Hench, L.L. (1992) Gas permeability in porous gel silica: L.L. Hench, J.K. West (Eds.), Chemical Processing of Advanced Materials, Wiley, New York. Galarneau, A., Cangiotti, M., di Renzo, F., Fajula, F. & Ottaviani , M. F. (2006) Synthesis of Micelle Templated Silico-Aluminas with Different Alumina Contents, Journal of Physical Chemistry B, 110, 4058-4065. Gibaud, A., Grosso, D., Smarsly, B., Baptiste, A., Bardeau, J.F. , Babonneau, F. , Doshi, D.A. , Chen, Z. , Brinker, J. & Sanchez, C. (2003) EvaporationControlled Self-Assembly of Silica Surfactant Mesophases, Journal of Physical Chemistry, 107, 6114- 6118. Go´ra-Marek , K. & Datka, J. (2006) IR studies of OH groups in mesoporous aluminosilicates, Applied Catalysis A: General 302, 104–109. Grosso, D., Cagnol, F. , de A.A. Soler-Illia, G.J. , Crepaldi, E.L. , Amenitsch, H. , Brunet-Bruneau, A., Bourgeois, A. & Sanchez, C., (2004) Fundamentals of Mesostructuring Through Evaporation-Induced Self-Assembly, Advanced Functional Materials, 14, 309-322. Guliants, V.V., Carreon, M.A. & Lin, Y.S., (2004) Ordered mesoporous and macroporous inorganic films and membranes, Journal of Membrane Science, 235, 53-72. Guth J.-L. , Mesa M. & Sierra L. (2007) Formation mechanism of SBA-3, SBA15 and SBA-16 type mesoporous silica in acidic solutions, Studies in Surface Science and Catalysis, 170, 1850-1855. Han, Y., Kim, J.M., Stucky, G. D. (2000) Preparation of Noble Metal Nanowires Using Hexagonal Mesoporous Silica SBA-15, Chemistry of Materials, 12, 2068-2069. 166
. Higgins, S., Kennard, R., Hill, N., DiCarlo, J. & DeSisto, W. J. (2006) Preparation and characterization of non-ionic block co-polymer templated mesoporous silica membranes, Journal of Membrane Science, 279, 669– 674. Higgins, S., DeSisto, W., Ruthven, D. (2009) Diffusive transport through mesoporous silica membranes, Microporous and Mesoporous Materials, 117, 268-277. Hillhouse, H.W., Okubo, T., van Egmond, J.W. & Tsapatsis M. (1997) Preparation of Supported Mesoporous Silica Layers in a Continuous Flow Cell, Chemistry of Materials, 9, 1505-1507. Hoffmann F., Cornelius, M., Morell, J., Fröba, M (2006) Silica-BasedMesoporous Organic–Inorganic Hybrid Materials, Angewandte Chemie International Edition, 45, 3216–3251 Huang, L., Poh, C. , Ng, S. C., Hidajat, K. & Kawi, S. (2005) Preparation of Supported Mesoporous Thin Films Concerning Template Removal by Supercritical Fluid Extraction, Langmuir, 21, 1171-1174. Huang, L., Huang, Q., Xiao, H. & Eic, M. (2008) Al-MCM-48 as a potential hydrotreating catalyst support: I – Synthesis and adsorption study, Microporous and Mesoporous Material, 111, 404–410. Huang, L., Kawi, S., Hidajat, K. & Ng, S.C. (2006) Formation of mesoporous silica thin films on oxide substrates by casting, Microporous and Mesoporous Material, 88, 254-265. Huang, X. , Ouyang, X., Ning , F. & Wang J. (2006) Mechanistic study on flame retardance of polycarbonate with a smallamount of potassium perfluorobutane sulfonate by TGAeFTIR/XPS, Polymer Degradation and Stability, 91, 606-613. Huo, Q. , Margolese, D.I. , Ciesla, U. , Feng, P., Gier, T.E., Sieger, P., Leon, R., Petroff, P.M., Schuth, F.& Stucky, G.D. (1994) Generalized synthesis of periodic surfactant/inorganic composite materials, Nature, 368, 317-321. Huo, Q., Margolese, D. & Stucky, G.(1996) Surfactant Control of Phases in the Synthesis of Mesoporous Silica-Based Materials, Chemistry of Materials, 8, 1147-1160.
167
Huo, Q., Margolese, D.I., Ciesla, U., Demuth, D.G., Feng, P., Gier, T.E., Sieger, P., Firouzi, A., Chmelka, B.F., Schuth, F. & Stucky, G.D., (1994) Organization of Organic Molecules with Inorganic Molecular Species into Nanocomposite Biphase Arrays, Chemistry of Materials, 6, 1176-1191. Huo, Q.S. , Zhao, D.Y. , J.L. Feng, K. Weston, S.K. Buratto, G.D. Stucky, S. Schacht, F. Schuth (1997) Room temperature growth of mesoporous silica fibers: A new high-surface-area optical waveguide, Advanced Material, 9, 974-978. Inagaki, S. & Fukushima, Y. (1998) Adsorption of water vapor and hydrophobicity of ordered mesoporous silica, FSM-16, Microporous and Mesoporous Material, 21, 667-672. Inayat A., Kuhnt A., Schwieger W., Einicke W., Kullmann J. & Enke D. (2010) Effect of excess silicate on the structure formation and textural properties of MTS materials, Journal of Porous Materials, in press, 1- 11. Innocenzi, P., Martucci, A. , Guglielmi, M. , Bearzotti, A. , Traversa, E., Pivin & J.C. (2001), Mesoporous silica thin films for alcohol sensors ,Journal of European Ceramic Society, 21, 1985-1988. Itoh, T., Shimomura, T., Hasegawa, Y., Mizuguchi, J. , Hanaoka, T., Hayashi, A., Yamaguchi A., Teramae, N., Onob M. & Mizukamia, F. (2011) Assembly of an artificial biomembrane by encapsulation of an enzyme, formaldehyde dehydrogenase, into the nanoporous-walled silica nanotube–inorganic composite membrane Journal of Material Chemistry, 2011, 21, 251–256 Ji, H., Fan, Y., Jin,W., Chen, C., Xu, N. (2008) Synthesis of Si-MCM-48 membrane by solvent extraction of the surfactant template, Journal of Non-Crystalline Solids, 354, 2010-2016. Kageyama K., Tamazawa J. & Aida T..(1999) Extrusion polymerization: Catalyzed Synthesis of Crystalline Linear Polyethylene Nanofibers within a Mesoporous Silica, Science, 285, 2113-2115. Kanezashi, M., O’Brien, J. & Lin Y.S. (2006) Template-free synthesis of MFItype zeolite membranes: Permeation characteristics and thermal stability improvement of membrane structure, Journal of Membrane Science, 286, 213-222.
168
Kanezashi, M., & Lin, Y. S. (2009) Gas Permeation and Diffusion Characteristics of MFI-Type Zeolite Membranes at High Temperatures, Journal of Physical Chemistry C, 113, 3767–3774. Katiyar, A. & Pinto, N. G. (2006) Visualization of Size-Selective Protein Separations on Spherical Mesoporous Silicates, Small, 2, 644–648. Kleitz, F., Marlow, F., Stucky, G.D. & Schuth, F. (2001) Mesoporous Silica Fibers: Synthesis, Internal Structure, and Growth Kinetics, Chemistry of Materials, 13, 3587- 3595. Klotz, M. , Ayral, A. , Guizard, C. & Cot, L. (2000) Synthesis conditions for hexagonal mesoporous silica layers, Journal of Materials Chemistry, 10, 663-669. Ko Y.S. & Woo S.I. (2001) Copolymerization of Ethylene and α-Olefin using Et(Ind)2ZrCl2 Entrapped inside the Regular and Small Pores of MCM41Macromolecular Chemistry and Physics, 202, 739-744. Koganti, V.R. & Rankin, S.E. (2005) Synthesis of Surfactant-Templated Silica Films with Orthogonally Aligned Hexagonal Mesophase, Journal of Physical Chemistry, 109 3279- 3283. Koros, W. J., Ma, Y. H., & Shimidzu T. (1996) Terminology for membranes and membrane processes (IUPAC Recommendations 1996), Pure & Applied Chemistry, 68, 1479 – 1489. Kosslick, H., Lischke, G., Landmesser, H., Parlitz, B., Storek, W. & Fricke, R. (1998) Acidity and Catalytic Behavior of Substituted MCM-48, Journal of Catalysis, 176, 102-114. Kresge, C., Leonowicz, M., Roth, W., Vartuli & J. Beck, J. (1992) Ordered mesoporous molecular sieves synthesized by a liquid-crystal template mechanism, Nature, 359, 710-712. Kumar, P., Ida, J. , Kim, S. , Guliants, V. & Lin, Y.S (2006) Ordered mesoporous membranes: Effects of support and surfactant removal conditions on membrane quality, Journal of Membrane Science, 279, 539-547. Kumar, P., Ida, J., & Guliants, V. (2008a.) High flux mesoporous MCM-48 membranes: Effects of support and synthesis conditions on membrane permeance and quality, Microporous and Mesoporous Materials, 110, 595599. 169
Kumar, P., Kim, S., Ida, J.& Guliants, V.V. (2008b.) PolyethyleneimineModified MCM-48 Membranes: Effect of Water Vapor and Feed Concentration on N2/CO2 Selectivity, Industrial & Engineering Chemistry Research, 47, 201-208 201 Kumar, P., & Vadim V. Guliants, V.V. (2010) Periodic mesoporous organic– inorganic hybrid materials: Applications in membrane separations and adsorption , Microporous and Mesoporous Materials, 132, 1-14 Kuraoka, K., Tanaka, Y., Yamashita, M. & Yazawa, T. (2004) Preparation of a membrane with aligned nanopores using an organic–inorganic hybrid technique, Chemical Communications, 10, 1198-1199. Lai, P., Hu, M.Z, Shib, D. & Bloma, D. (2008) STEM characterization on silica nanowires with new mesopore structures by space-confined self-assembly within nano-scale channels, Chemical Communications, 11, 1338- 1348. Li, A., Wei, X., Lin, Y.S. & Su, D. (2008) Synthesis of ordered mesoporous silica membranes containing iron oxide nanocrystallites, Journal of Membrane Science, 312, 186-192. Li, K. (2007) Ceramic Membranes for Separation and Reaction, Wiley, New York. Liang, Z. & Susha, A.S. (2004) Mesostructured Silica Tubes and Rods by Templating Porous Membranes, Chemistry A European Journal, 10, 49104914. Lin H.-P., Mou C.-Y. & Liu S.-B. (2000) Formation of Mesoporous Silica Nanotubes, Advanced Materials, 12, 103-106. Lin, Y.S. & Burggraaf, A.J. (1991) Preparation and characterization of hightemperature thermally stable alumina composite membrane, Journal American Ceramic Society, 74, 219-223. Lin, Y.S. & Burggraaf, A.J. (1993) Experimental studies on pore size change of porous ceramic membranes after modification, Journal of Membrane Science, 79, 65-82. Lin Y.S. (2001), Microporous and dense inorganic membranes: Current Status and Prospective, Separation and Purification Technology, 25, 39-55. Lin, Y.S. Kumakiri, I., Nair, B.N., Alsyouri, H. (2002) Microporous inorganic membranes Separation Purification Methods, 31, 229-379. 170
Lin, Y., Li, H. , Liu, C. , Xing, W. & Ji, X. (2008) Surface-modified Nafion membranes with mesoporous SiO2 layers via a facile dip-coating approach for direct methanol fuel cells, Journal of Power Sources, 185, 904-908. Linden M., Babonneau F., Heinz Amenitsch H., Baccile N., Riley A. & Tolbert S. (2008) On the mechanism of formation of SBA-1 and SBA-3 as studied by in situ synchrotron XRD, Studies in Surface Science and Catalysis, 174, 103-108. Liu, C., Wang, L., Ren, W., Rong, Z., Wang, X., Wang, J. (2007) Synthesis and characterization of a mesoporous silica (MCM-48) membrane on a largepore α-Al2O3 ceramic tube, Microporous and Mesoporous Materials, 106, 35-39. Looveren L.K., Geysen D.F., Vercruysse K.A., Wouters B.H., Grobet P.J.& Jacobs P.A., (1998) Methylaluminoxane MCM-41 as Support in the Cooligomerization of Ethylene withPropene with [C2H4(1-Ind)2]Zr(CH3)2, Angewandte Chemie International Edition, 37, 517-520. Lu, Q., Gao, F. , Komarneni, S. , Mallouk, T. E. (2004) Ordered SBA-15 Nanorod Arrays Inside A Porous Alumina Membrane, Journal of the American Chemical Society, 126, 8650-8651. Lu, Y., Ganguli, R., Drewien, C. A., Anderson, M. T., Brinker, C. J., Gong, W., Guo, Y., Soyez, H., Dunn, B., Huang, M. H. & Zink, J. I (1997) Continuous formation of supported cubic and hexagonalmesoporous films by sol–gel dip-coating, Nature, 389, 364-368. Lü, Y., Lu, G., Wang, Y., Guo, Y, Guo, Y., Zhang, Z., Wang, Y. & Liu, X. (2007) Functionalization of Cubic Ia3d Mesoporous Silica for Immobilization of Penicillin G Acylase, Advanced Functional Material, 17, 2160–2166 Marlow F., Zhao D., Stucky G.D. (2000) Doped Mesoporous Silica Fibers: The Internal Structure, Microporous and Mesoporous Material, 39, 37-42. McCool, B., Hill, N., DiCarlo, J. & DeSisto, W.J. (2003) Synthesis and Characterization of Mesoporous Silica Membranes via Dip-coating and Hydrothermal Deposition Techniques, Journal of Membrane Science, 218, 55-67.
171
McCool, B. A. & DeSisto, W. J. (2005) Amino-Functionalized Silica Membranes for Enhanced Carbon Dioxide Permeation, Advanced Functional Materials,15, 1635–1640. Mekawy, M. M., Yamaguchi, A., El-Safty, S. A., Itoh, T.& Teramae N. (2011) Mesoporous silica hybrid membranes for precise size-exclusive separation of silver nanoparticles, Journal of Colloid and Interface Science 355, 348– 358. Miyata, H., Noma, T., Watanabe, M. & Kuroda, K. (2002) Preparation of Mesoporous Silica Films with Fully Aligned Large Mesochannels Using Nonionic Surfactants, Chemistry of Materials, 14, 766-772. Moelans, D., Cool, P. , Baeyens, J. & Vansant, E. F. (2005) Using mesoporous silica materials to immobilise biocatalysis-enzymes, Catalysis Communication, 6, 307-311. Morimoto, T., Nagao, M. & Imai, J. (1971) Adsorption of water on SiO2, Al2 O3, and SiO2·Al2O3. The Relation between the amounts of physisorbed and chemisorbed water bull, The Chemical Society of Japan, 44, 1282–1288. Mulder, M. (1991) Basic Principles of Membrane Technology, Kluwer Academic Publishers, Dordrecht, Netherlands. Nagarajan, S., Li, M., Pai, R.A., Bosworth, J.K., Busch, P., Smilgies, D.-M. , Ober, C.K., Russell, T.P. & Watkins, J.J. (2008) An Efficient Route to Mesoporous Silica Films with Perpendicular Nanochannels, Advanced Materials, 20, 246-251. Nakagawa, K. , Matsuyama, H. , Maki, T. , Teramoto, M. & Kubota, N. (2005) Preparation of mesoporous silica membrane by solvent evaporation method for filtration application, Separation Purification Technology, 44, 145-151. Naono, H., Fujiwara, R. & Yagi M. (1980) Determination of physisorbed and chemisorbed waters on silica gel and porous silica glass by means of desorption isotherms of water vapor, Journal of Colloid and Interface Science 76, 74–82. Nishiyama, N., Koide, A., Egashira, Y. & Ueyama, K. (1998) Mesoporous MCM48 membrane synthesized on a porous stainless steel support, Chemical Communications, 2147-2148. 172
Nishiyama, N., Park, D.-H. , Koide, A., Egashira, Y. & Ueyama, K. (2001) A mesoporous silica (MCM-48) membrane: preparation and characterization, Journal of Membrane Science, 182, 235-244. Oh, J. S., Shim, W. G., Lee, J. W. , Kim, J. H., Moon, H. & Seo, G. (2003) Adsorption Equilibrium of Water Vapor on Mesoporous Materials, Journal of Chemical Engineering, 48, 1458-1462. Ohashi, F., Maeda, M., Inukai, K., Suzuki, M. & Tomura, S. (1999) Study on intelligent humidity control materials: water vapor adsorption properties of mesostructured silica derived from amorphous fumed silica, Journal of Membrane Science, 34, 1341-1346. Othman, M.R, Tan, S.C. & Bhatia, S., (2009) Separability of carbon dioxide from methane using MFI zeolite–silica film deposited on gamma-alumina support Microporous Mesoporous Material, 121, 138-144. Otomo, M., Wang, S., Takahashi, H. & Nagamoto, H. (2006) Microstructure development of mesoporous silica thin films with pore channels aligned perpendicularly to electrode surfaces and application to proton conducting composite electrolyte membranes, Journal of Membrane Science, 279, 256-265. Oye, G., Sjoblom, J. & Stocker, M. (1999) Synthesis and characterization of siliceous and aluminum-containing mesoporous materials from different surfactant solutions Microporous and Mesoporous Material, 27, 171-180. Ozin, G. A., Yang, H., Sokolov, I. & Coombs, N. (1997) Shell mimetics, Advanced Materials, 9, 662-667. Pan, M., Cooper, C., Lin, Y.S. & Meng, G.Y. (1999) CVD modification and vapor/gas separation properties of nanoporous alumina membranes, Journal of Membrane Science, 158, 235-241. Pan. M. & Lin Y. S. (2001) Template-free secondary growth synthesis of MFI type zeolite membranes, Microporous and Mesoporous Materials, 43, 319327. Park, D. H., Nishiyama, N., Egashira, Y. & Ueyama, K. (2001) Enhancement of hydrothermal stability and hydrophobicity of a silica MCM-48 membrane by silylation, Industrial and Engineering Chemistry Research, 40, 61056110.
173
Park, D. H., Nishiyama, N., Egashira, Y. & Ueyama, K. (2003) Separation of organic/water mixtures with silylated MCM-48 silica membranes, Microporous and Mesoporous Materials, 66, 69-76. Peinemann, K., Nowak, S., Albrecht, W., Hilke, R. & Just, R. (2006) Hollow fiber membrane contactor for air humidity control: Modules and membranes, Journal of Membrane Science, 276, 241-251. Platschek, B., Kohn, R., Doblinger, M. & Bein, T. (2008) In Situ GISAXS Study of the Formation of Mesostructured Phases within the Pores of Anodic Alumina Membranes, Langmuir, 24, 5018-5023. Platschek, B., Petkov, N. & Bein, T., (2006) Tuning the Structure and Orientation of Hexagonally Ordered Mesoporous Channels in Anodic Alumina Membrane Hosts: A 2D Small-Angle X-ray Scattering Study, Angewandte Chemie International Edition, 45 1134 –1138. Platschek, B., Kohn, R. , Doblinger, M. & Bein, T. (2008) In Situ GISAXS Study of the Formation of Mesostructured Phases within the Pores of Anodic Alumina Membranes. Langmuir 24, 5018-5023. Rodner, S.C. , Wedin, P. & Bergstrom, L. (2002) Effect of Electrolyte and Evaporation Rate on the Structural Features of Dried Silica Monolayer Films, Langmuir, 18, 9327-9333. Russo, P.A., Ribeiro Carrott , M.M.L., Carrott , P.J.M., Lopes, J.M., Ribeiro , F. R. , Rocha, J. (2008) Structure and catalytic activity of Al-MCM-48 materials synthesized at room temperature: Influence of the aluminum source and calcination conditions, Microporous Mesoporous Material, 114, 293–302. Sakamoto, K.Y., Nagata, K., Yogo, K., Yamada, K. (2007) Preparation and CO 2 separation properties of amine-modified mesoporous silica membranes, Microporous and Mesoporous Materials, 101, 303-311. Salesch, T. , Bachmann, S. , Brugger, S. , Rabelo-Schaefer, R. , Albert, K. , Steinbrecher, S. Plies, E., Mehdi, A., Rey, C. , Corriu, R.J.P. & Lindner, E. (2002) New Inorganic–Organic Hybrid Materials for HPLC Separation Obtained by Direct Synthesis in the Presence of a Surfactant, Advanced Functional Material, 12, 134-142. Sanchez Marcano, J.G. & Tsotsis, T. T. (2002) Catalytic Membranes and Membrane Reactors, Wiley-VCH, Weinheim. 174
Sano, T., S. Ejiri, S., Yamada, K. , Kawakami, Y. , & Yanagishita, H. (1997) Separation of acetic acid-water mixtures by pervaporation through silicalite membrane, Journal of Membrane Science, 123, 225-233. Schacht S., Huo Q., Voigt-Martin I.G., Stucky G.D. (1996) Oil-Water Interface Templating of Mesoporous Macroscale Structures, Science, 273, 768-771. Schmidt-Winkle P., Yang P., Margolese D.I., Chmelka B.F. & Stcuky G.D. (1999) Fluoride-Induced Hierarchical Ordering of Mesoporous Silica in Aqueous Acid-Syntheses, Advanced Materials, 11, 303-307. Schmuhl, R., Chowdhury, S., Elshof, J., Berg, A. & Blank, D. (2004) Nanostructured Ion-Selective MCM-48 Membranes, Journal of Sol-Gel Science and Technology, 31, 249-252. Seshadri, S. K., Alsyouri H. M. & Lin, Y.S. (2010) Counter diffusion self assembly synthesis of ordered mesoporous silica membranes in straight pore supports, Microporous and Mesoporous Materials, 129, 228-237. Sijbesma, H., Nymeijer, K., van Marwij, R., Heijboer, R., Potreck, J. & Wessling, M. (2008) Flue gas dehydration using polymer membranes, Journal of Membrane Science, 313, 263–276. Sloot, H.J., Smolders, C.A., van Swaaij, W.P.M. & Versteeg G.F. (1992) Surface diffusion of hydrogen sulfide and sulfur dioxide in alumina membranes in the continuum regime, Journal of Membrane Science, 74, 263-278. Soler-Illia, G., Crepaldi, E., Grosso, D. & Sanchez, C. (2003) Block copolymertemplated mesoporous oxides, Current Opinion in Colloid and Interface Science, 8, 109-126. Soler-Illia, G., Sanchez, C., Lebeau, B. & Patarin, J. (2002) Chemical strategies to design textured materials: From microporous and mesoporous oxides to nanonetworks and hierarchical structures, Chemical Reviews, 102, 40934138. Sperry, D.P., Falconer, J.L & Noble, R.D (1991) Methanol-hydrogen separation by capillary condensation in inorganic membranes, Journal of Membrane Science, 60, 185-193. Stempniewicz M., Rohwerder M. & Marlow F. (2007) Release from Silica SBA3-like Mesoporous Fibers: Cross-Wall Transport and External Diffusion Barrier, ChemPhysChem, 8, 188–194. 175
Taguchi, A.& Schu¨th, F. (2005) Ordered mesoporous materials in catalysis Microporous and Mesoporous Materials, 77, 1–45. Tokay, B. , Falconer, J.L. & Noble, R.D. (2009) Alcohol and water adsorption and capillary condensation in MFI zeolite membranes, Journal of Membrane Science, 334, 23-29. Tudor J. & O’Hare D. (1997) Stereospecific Propene Polymerisation Catalysis using an Organometallic Modified Mesoporous Silicate, Chemical Communications, 603-604. Uchytil, P., Petrickovic, R., Thomas, S. & Seidel-Morgenstern, A. (2003) Influence of capillary condensation effects on mass transport through porous membranes, Separation and Purification Technology, 33, 273-281. Uhlhorn, R.J.R., Keizer K. & Burggraaf A.J. (1992) Gas transport and separation with ceramic membranes. Part I. Multilayer diffusion and capillary condensation, Journal of Membrane Science, 66, 259-269. Vu, D.Q., Koros, W.J., & Miller, S.J. (2003) Mixed matrix membranes using carbon molecular sieves, I. Preparation and experimental results, Journal of Membrane Science, 211, 311–334. Wang J., Zhang J., Asoo B. Y. & Stucky G. D. (2003) Structure-Selective Synthesis of Mesostructured/Mesoporous Silica Nanofibers, Journal of the American Chemical Society, 125, 13966-13967. Wang, J., Wang, W., Sun, P., Yuan, Z., Jin, Q , Ding, D. & Chen, T. (2007) Observation of hollow helical fibers of MCM-41, Material Letters, 61, 4492-4495. Wu, Y., Cheng, G., Katsov, K. , Sides, S.W. , Wang, J., Tang, J., Fredrickson, G.H. , Moskovits, M. & Stucky, G.D. (2004) Composite mesostructures by nano-confinement, Nature Materials, 3, 816-822. Xu, R., Pang, W., Yu, J., Huo, Q. & Chen, J. (2007) Chemistry of Zeolites and Related Porous Materials: Synthesis and Structure, Weily and Sons. Yacou, C., Ayral, A., Giroir-Fendler, A., Fontaine M. & Julbe A. (2009) Hierarchical porous silica membranes with dispersed Pt nanoparticles, Microporous and Mesoporous Material, 126, 222-227. Yamaguchi, A. , Uejo, F. , Yoda, T. , Uchida, T. , Tanamura, Y. , Yamashita, T. , Teramae, N. (2004) Self-Assembly Of A Silica–Surfactant 176
Nanocomposite In A Porous Alumina Membrane, Nature Materials, 3, 337-341. Yamauchi, Y., Sawada, M. , Noma, T., Ito, H. , Furumi, S., Sakka, Y. & Kuroda, K. (2005) Orientation of mesochannels in continuous mesoporous silica films by a high magnetic field, Journal of Materials Chemistry, 15, 11371140. Yamaguchi, A , Kaneda, H. , Fu, W., Teramae, N. (2008) Structural Control of Surfactant-Templated Mesoporous Silica Formed Inside Columnar Alumina Pores, Advanced Materials, 20, 1034–1037. Yan, Y., Davis, M.E., & Gavalas G. R., (1997) Preparation of highly selective zeolite ZSM-5 membranes by a post-synthetic coking treatment, Journal of Membrane Science, 123, 95-103. Yang, H., Ozin, G.A. & Kresge, C.T. (1998) The Role of Defects in the Formation of Mesoporous Silica Fibers, Films, and Curved Shapes, Advanced Materials, 10, 883- 887. Yang S.M., Yang H., Coombs N., Sokolov I., Kresge C.T. & Ozin G.A. (1999) Morphokinetics: Growth of mesoporous silica curved shapes, Advanced Materials, 11, 52-55. Yoo, S., Ford, D. & Shantz, D. (2006) Synthesis and Characterization of Uniform Alumina-Mesoporous Silica Hybrid Membranes, Langmuir, 22, 18391845. Yu Y. , Qiu H., Wu X., Li H., Li Y., Sakamoto Y., Inoue Y., Sakamoto K., Terasaki O. & Che S. (2008) Synthesis and Characterization of Silica Nanotubes with Radially Oriented Mesopores, Advanced Functional Materials 18, 541–550. Yuan P., Zhao L., Liu N.,Wei G., Wang Y., Auchterlonie G. J. ,Drennan J., Lu G. Q. & Jin Zou J. (2010) Evolution of Helical Mesostructures, Chemistry A European Journal, 16, 1629–1637. Zhang, L., Park, I., Shqau, K., Ho, W.S. W., & Verweij, H. (2009) Supported inorganic membranes: Promises and challenge, JOM Journal of the Minerals Metals and Materials Society, 61, 61-71. Zhang, L. V. (2006) Energy performance of independent air dehumidification systems with energy recovery measures, Energy, 31, 1228-1242. 177
Zhang,
L.Z. (2006) Mass Diffusion in a Hydrophobic Membrane Humidification/Dehumidification Process: The Effects of Membrane Characteristics, Separation Science and Technology, 41, 1565–1582.
Zhao, X.S. , Lu, G.Q. & Millar, G.J. (1996). MCM-41 Advances in Mesoporous Molecular Sieve, Industrial and Engineering Chemistry Research, 35, 2075-2090. Zhao D., Yang P., Margolese D. I., Chmelka B. F. & Stucky G. D. (1998) Synthesis of continuous mesoporous silica thin films with threedimensional accessible pore structures, Chemical Communications, 2499– 2500. Zhong, S.H., Li, C.F. , Li, Q. & Xiao, X.F. (2003), Supported mesoporous SiO2 membrane synthesized by sol_/gel template technology, Separation and Purification Technology, 32, 17-22. Zhou, S., Birbeck, T. & Jonqueres, M. A (2004) US Patent Number 6,705,092 B1, Vapor membrane Dehumidification for air cycle environment control system.
178
APPENDIX A THEORETICAL PERMEANCE OF SUPPORT AND UPPER LIMIT OF MEMBRANE CELL
179
Mean free path of oxygen. The mean free path is calculated using the following equation:
16 5Pm
RT 2m
Where, = viscosity, Pm = mean pressure and m is the molecular weight of oxygen, R is the gas constant and T is the system temperature in Kelvin.
16 20.63x10 6 5 101325 Kn
8.314 298 2 32
rp
= 2.29x10⁻⁹ m
5.72x10 4
rp in the above equation is the average pore radius of the membrane. For bulk diffusion Kn < 0.01. For Knudsen-type diffusion, Kn > 10. Since Kn is 5.72x10⁴
the diffusion of oxygen through the pores is predominantly bulk diffusion.
Calculation of the diffusivity of oxygen in a system with nitrogen (D AB) using the Chapman–Enskong equation:
D AB
1 1 0.0018583 T 3 MA MB 2 P AB AB
Where A is O2 and B is N2, is collision diameter in Å, is collision integral for diffusion and is a function of the dimensionless parameter
.T . AB
and AB are Lenard-Jones parameters determined from AB = 0.5( A B ) and
AB = A B . [Bird et al., 2005]. In this case A = 3.433, B = 3.667, A/ = 113 180
and B/ = 99.8. The next step is the use the values to determine the LeonardJones parameters.
AB = 113x99.8 106.19
AB 0.5 x(3.433 3.667) 3.55 .T 2.80 AB AB 0.9682 From this, the following value for DAB is determined from the previous equation: DAB=0.202 cm2/s The effective diffusion coefficient for a fresh membrane is given by: De ff D AB
where ε is membrane porosity and τ is tortuosity.
For the poly carbonate
membrane = 15% and since the pores are considered as “straight-through” τ = 1. The effective diffusion coefficient is calculated below: Deff = 0.03 cm2/s =3x10⁻⁶ m2/s For equimolecular counter diffusion: F
J 1 Deff P LRT
Where L is membrane thickness, R is universal gas constant and T is temperature in Kelvin F 3x10 6
1 10 x10 x8.314 x298 6
For a fresh membrane, the permeance is 1.2x10⁻⁴ mol/m2·Pa·s. 181
Permeation flux for empty cell with no membrane For permeation cell without a membrane
(see figure below) and
assuming no mixing, the empty volume between two gas flows in the permeation cell can be assumed as a membrane of 100% porosity that is 0.5 mm thick. Since bulk diffusion is predominant in this case, the diffusivity in this system would be the same as above. Under such conditions, the theoretical permeance for the empty cell can be determined.
Membrane, 15% porosity, 10 um thick, within the empty cell
Empty cell, 100% porosity, 0.5 mm thick, same area as membrane
F(empty cell) =F(membrane)x(100%/15%)/(0.5x10-3/10x10-6) = 1.2x10-4x 0.12=2.2x10⁻⁵ mol/m2.Pa.s In other words, the permeance for the empty cell is 5 times smaller than the permeance for the membrane. This is due to small thickness and large pore size of the membrane.
182
When comparing this to experimental results, the theoretical permeance for the empty cell is about 2-3 times smaller than the measured permeance for the empty cell. This makes sense, as in the real cell, the fluid flow (depending on the flow rate and cell configuration) might have a mixing effect (or convection flow effect) that enhances the gas permeance. The membrane permeance is about 10 times smaller than the predicted membrane permeance, and very close to the predicted permeance for the empty permeation cell. This is because diffusion through permeation cell is rate-limiting step. Placing a membrane in the cell might minimize mixing (and convection flow), making the permeation through cell closer to the diffusion during stagnant flow. Thus, the measured membrane permeance is not accurate, and therefore, it is better to use the estimate for the theoretical permeance of the fresh membrane. In summary, the current permeation cell design and flow configuration will give a maximum permeance of 2.2x10⁻⁵ mol/m2.Pa.s. It is not accurate to use the setup to measure permeance of membranes with permeance larger than 1x10⁻⁵ mol/m2.Pa.s. To ensure accurate characterization of the membranes, this system can only be used to measure the membranes with permeance smaller than 0.5x10⁻⁵ mol/m2.Pa.s.
183
APPENDIX B THEORETICAL PERMEANCE CALCULATION FOR AS-SYNTHESIZED MEMBRANE WITH GAPS
184
The area of membrane available for permeation (A) is defined as the total area times the porosity of the membrane. For the polycarbonate membranes, the membrane porosity is 15% and the total area is 0.461 cm2 (when taking into account the o-rings). From this, the total area for permeation is 0.069 cm2. The total area of one pore
and the pore radius (rp) is 8 µm.
From this, the area of one pore is 5.026x10⁻⁷cm2. Each pore as a gap that can be described as a 0.15 µm ring around the plug. There area of this gap needs to determined. The area of the gap is
. Here, rpl is radius of the
plug, this making Ag = 3.697x10⁻⁸ cm2 The percentage of gaps in the membrane is
⁄
= 7.3 %. From
calculations done prior, it is known that the fresh support has a permeation of 1.2x10⁻⁴ mol/m2·Pa·s.
Therefore, theroretical expected permeance value for
assynthesied membrane is as follows: =
185
Theoretical separation value for defect sealed membrane The steps presented here will allow for the determination of the theoretical separation factor for a membrane with sealed defects. microporositytotal = microporositydefect sealing + microporosityplug walls The microporosity that is a result of defect sealing is the same as the initial gap percentage, which is 7%. The area occupied by plug is equal to (100-7)% = 93%. The microporosity from the plugs is = 30% of 93% = 0.3x0.93 = 0.28. When adding this to the 7% microrporosity from defect sealing, the total microporosity in the membrane is = (28+7)% = 35%. Assuming that the selectivity of gases from the micropores within the plugs is equal to micropore selectivity of the defect sealed area, then the selectivity of the system can be calculated. System Selectivity = 65% mesoporous selectivity + 35% micropoous selectivity From these calculations, the theoretical system selectivity is found to be = 0.65x2.83 + 0.35x4.33 = 3.35.
186
APPENDIX C PREPARATION OF MESOPOROUS SILICA FIBERS
187
Mesoporous Silica Fibers (MSF) is prepared using Tetrabutylorthosilica (TBOS, Aldrich) as silica source, Cetyltrimethylammonium bromide (CTAB, Aldrich) as template, Hydrochloric acid (HCl: 12.1M), Mesoporous Silica Fibers (MSF) is prepared using the following molar ratio at 27 ºC for 414 days: 1 TBOS: 0.5 CTAB: 58.4 HCl: 2000 H2O
1.
Dissolve 3.99 g of CTAB in 590 ml water under 150 rpm magnetic stirring for 15 min to form a white solution. Subsequently add 238 ml of HCl (6M) slowly under mixing until the solution becomes clear.
2.
Stop mixing and add 7.92 ml TBOS (Aldrich) on the top of the CTAB-H2OHCl mixture as thin liquid layer.
3.
Seal the beaker with Para film. This is a important step to obtain good quality fibers.
4.
Age the mixture for more than 4 days without stirring. The fibers usually start to grow after two days from the organic/water interface towards the water phase. More aging time will give more fibers with better structure. Growth for 14 days will give fibers with a typical XRD pattern.
5.
After aging, fibers will be clearly grown with very thin (hardly seen) film at the organic/water interface and some precipitated solids at the bottom of the beaker. The fibers are carefully collected either by using pipette or direct pouring into another beaker. 188
6.
Wash the product several times by distilled water using vacuum filter. The product is then dried in air at room temperature overnight.
7.
Calcine the product at 550 oC for 6 hours using 1 oC/min heating and cooling rates.
189
APPENDIX D PREPARATION OF ALPHA-ALUMINA SUPPORTS
190
1. Measure out 21g of alumina (A15 and A16) powder using microbalance. 2. Add 10 wt% of distilled water (A16). a. For 21 g of powder add 2.1 g of H2O. 3. Mix in mortar until mixture becomes homogeneous. a. Want consistency of a fine powder. 4. Add 2.1 g of mixture into the mold. a. Caution: Make sure the mold is free of any debris. b. Shake mold with powder inside to ensure that uniform surfaces are formed and the voids are filled. 5. Proceed with pressing procedure (Carver): a. Press with 20,000 lbf for 5 min. i.
Be sure to raise the pressure slowly b. Flip apparatus and add large hemispherical ring to the top. c. Slowly raise the pressure supporting the main part of the mold. d. Separate the center mold from the ring.
i.
Be very careful with this step. 6. Carefully remove the disk and place in Petri dish. 7. Be sure to clean all parts of the mold to make sure it is free from debris prior to beginning the next disk. 8. Dry all disks in oven at 40 C for two days in a moist environment. a. Add a beaker of water in the oven. 191
9. Sinter all disks in a programmable furnace with the following procedure:
Step 1 2 3 4 5 6
Rate (C/hr)
Tsp (C)
thold (hr)
60 96 96 60 60
600 1260 200 1150 200
0.1 0.1 0.1 30 0.1 End
10. Polish surface of membrane disks using polisher (Metaserve 2000) at around 300-400 n/min by sandpaper (SiC paper #500, #800, #1200). 11. Dry the polished disks for two days at 40ºC.
192
APPENDIX E PREPARATION OF MCM-48 MEMBRANES
193
The molar composition of the gel used to synthesize the membrane as 1.0 TEOS:0.65 CTMABr:0.50 NaOH:62 H2O. 1. Cover porous -alumina supports one side with Teflon tape to prevent growth of the membrane on that particular side. 2.
Placed support in 11.2 mL of tetraethylorthosilicate (TEOS, 98%, Sigma Aldrich) for 30 min.
3. Mix 1.098g NaOH (97+% reagent grade, Sigma Aldrich) and 56 mL of deionized water add 12.00 g of CTMABr (Sigma Aldrich) and stirred for 10 min. 4.
Combined the above solution with TEOS a
5. Stir the resulting gel solution and support for 1.5 h. 6. Transfer disk Teflon autoclave. 7. Pour gel solution over the membrane before sealing the autoclave. 8. Maintain the system at a temperature of 100°C for 4 days. 9. Remove membrane and wash gently to remove excess deposited silica. 10. Remove surfactant by extraction using an EtOH/HCl solution containing 250 ml EtOH and 3.5 g of 37% HCl, kept at 110°C for 24 h in a Soxhlet extraction apparatus
194
APPENDIX F PREPARATION OF AL-MCM-48 MEMBRANES
195
This procedure is for preparing Al-MCM-48 membrane with a Si/Al ratio of 30 The final gel composition is 1.0
CTAB: 2.5 TEOS: 1.5 NaOH:0.04 AlS:244 H2O.
1. Cover the support with Teflon tape on one side and place in 21.3 g of TEOS for 30 min. 2. Dissolve 14.9 g of CTAB in 180.2 g of distilled water and 2.48 g of NaOH and heat to a temperature of 36oC. 3. Combine this with TEOS and stir for 5 min and 1.1 g of aluminum sulfate (AlS, 98+%, Sigma Aldrich).Stir solution for 55 min a 4. Transfer gel to Teflon lined autoclave. Place in an oven at 100oC for 3 days. 5. Remove surfactant by extraction using an EtOH/HCl solution containing 250 ml EtOH and 3.5 g of 37% HCl, kept at 110°C for 24 h in a Soxhlet extraction apparatus
196
APPENDIX G MEMBRANE SYNTHESIS BY COUNTER DIFFUSION SELF ASSEMBLY (CDSA) METHOD
197
Membranes are Synthesized by Counter Diffusion Self Assembly using polycarbonate track etch membranes from Whatman. The hydrophobic membranes having a diameter of 13 mm, thickness of 10 µm, and pore diameter of 8 µm (Whatman) is used.
The following molar ratio is used for the liquid
phase: 0.5 CTAB: 58.4 HCl: 2000 H2O 1. Pour 150 ml of the water phase is poured into a 200 ml beaker. 2. Soak the membrane in TBOS for about 30 minutes. 3. Gently place membrane over the water phase 4. Pour a 1 to 2 ml of TBOS over this to make a thin layer on the water surface. Make sure that height this layer does not exceed 1 mm. 5. Seal the system using parafilm. 6. Allow the plug to grow for 1 to 2 weeks. 7. Remove and dry in humidity chamber 8. Extract surfactant by soaking membrane in 50 ml EtOH and 0.7 g of 37% HCl for 48 hours, to ensure complete extraction. Do not carry out this step without defect sealing first.
198
APPENDIX H PROCEDURE FOR DEFECT SEALING AND POST SEALING SILICA ETCH
199
1. Soak the membrane in Tetrabutylorthosilica (TBOS, Aldrich) for four hours to over night 2. Place on blotting paper and press gently to remove any excess TBOS on the surface 3. Place the membrane in a low humidity environment < 25% for 2 to 4 days for the effects to be sealed. 4. For etching make a solution of HF:H2O ( 1:20) in a plastic container ( Important ! See safety guidelines at the end of procedure) 5. Carefully pour about 50 ml of etching solution into a beaker. 6. Using plastic tweezers immerse the membrane into the solution and keep in place for 45 s. Care must be taken to not over etch the membrane as this will result in creating defects 7. Remove the membrane rinse with DI water and place in DI water for 45 minutes 8. Place the membrane in the humidity chamber over night for drying Safety precautions
HF is highly hazardous chemicals and needs proper protective gear (acid gloves, shield, acid lab coat etc.) to be used.
HF safety training must be undertaken before handling.
All procedures must be conducted in the hood including washing with DI water
All containers used should be plastic including waste containers 200
APPENDIX I STEADY STATE SINGLE GAS PERMEATION
201
1. Make sure that the helium cylinder (2) or whatever gas you plan to use is properly attached and the pressure is set to no higher than 40 psi. Note: The numbers in ( ) refer to locations in Figure I.1 2. Put the membrane in the permeation cell (7). Be sure to tighten the cell such that the o-rings within seal the membrane properly. However, sealing too tight can also cause the membrane to break, so find the correct balance between the two. 3. Close valve B fully and open valves A and C fully. 4. Check for leakage of the gas at all tube connections. This can be done by using a soap solution (or Snoop) and placing a few drops at each point of connection. If no bubbles form, there is no significant leak. 5. Set the mass flow controller to the appropriate flow rate. A13 -alumina membranes will require high flow rates (100 mL/min). A15 and A16 alumina membranes use lower flow rates (10-20 mL/min). 6. Flip the switch on the pressure sensor (5) to the up position marked as 2 on the box. This reading tells us the P (gauge pressure difference) across the membrane. If this reading is below 2.5 psi, continue to step 7. If the value shown is above 2.5 psi, skip to step 19. 7. The position marked 1 on the pressure sensor (5) gives the gauge upstream pressure (Ph) 8. Let the system equilibrate for about an hour or until there is no noticeable change in the system’s conditions for an extended period of time. 202
9. Measure the flow rate of helium in the system three times with a bubble flow meter (8). 10. Record P and Ph. 11. Close valve C ten turns and repeat steps 8-10. 12. Close valve C one turn and repeat steps 8-10. 13. Close valve C one turn and repeat steps 8-10. 14. Close valve C one-half turn and repeat steps 8-10. 15. Close valve C one-half turn and repeat steps 8-10. 16. Close valve C one-quarter turn and repeat steps 8-10. 17. Close valve C one-quarter turn and repeat steps 8-10. 18. When you are done, turn the helium cylinder (2) off and remove the membrane from the permeation cell. 19. Open valves A and B to vent the system so the pressure sensor will not be damaged (especially important for those testing membranes with a small pore size). 20. After venting, close valve A, then do the same to valve B. 21. Set the mass flow controller to channel 1 and set the value to 20%. 22. Let the system equilibrate for about an hour or until there is no noticeable change in the system’s conditions for an extended period of time. 23. Measure the flow rate of helium in the system THREE times with a bubble flow meter (8)
203
24. Measure P and Ph by flipping from position 1 to position 2 on the pressure sensor (5). 25. Repeat steps 22-24 with the mass flow controller on channel 1 for values of 40%, 60%, 80% and 100%. 26. When you are done, turn the helium cylinder (2) off and remove the membrane from the permeation cell.
Figure I.1 Steady state permeation diagram
204
APPENDIX J UNSTEADY STATE SINGLE GAS PERMEATION
205
1. Mount the membrane in the stainless steel permeation cell (PC). Be sure that each side of the membrane is sealed with a rubber (Viton, Buna etc.) o-ring. A schematic of the unsteady state system can be found in Figure J.1. 2. Completely seal the membrane by tightening the bolts around the edges.. However, do not tighten the cell so much that is causes your membrane to break 3. Evacuate the system with the vacuum pump. Leave the vacuum pump on until the pressure in the system reaches a minimum value. At this point, close the valves to seal the system under the vacuum 4. Once finished using the vacuum pump, turn it off. Leaving it on can cause the pump to either overheat or emit fumes into the surrounding area. 5. Before gathering permeance data, it is a good idea to check and make sure that there is no leak within the permeation cell by isolating the permeation cell. Let the system set for a couple of minutes and monitor the pressure readout (PR). If the pressure does not change or the change is very minimal, then there is no leak and you can proceed to check the permeance of the membrane. 6. Open the valve which will allow helium gas to enter the system. Increase or decrease the pressure in the system by adjusting the flow rate of helium in the system. Monitor the upstream pressure gauge until the pressure in the system has reached the desired value. 7. On the computer that is attached to the unsteady state system, open Labview. 206
8. Type in a name that you want to save the file as. Keep in mind, it is usually a good idea to indicate some important parameters in the test file, such as the permeating gas, the gauge pressure of the system and the temperature at which the test was conducted. 9. Indicate the desired time step for data collection 10. Click and after about 1 second, open the valve to let the helium gas permeation through the membrane. Allow the system to take data for as long as it is necessary to gain an accurate measure of dP/dt, which is the slope of the line in the Labview window. Stop collecting data by clicking the red stop sign in the Labview window. 11. Export the data to a program, such as Excel, and graph it. Fit a line to the data and get the slope. As mentioned previously, the slope of this line is the dP/dt. Be sure to remember that dP/dt from this data is in units of mmHg/s. 12. Using the following equation, one can solve for the permeance of the membrane:
Vc dP Q dt S R T ( Ph Pl ) where Q is the permeance (usually in moles/m2Pas), dP/dt is change in pressure versus time, Vc is volume of the cylinder (in this case, the cylinder is 1L or 10-3m3), S is the area of the membrane, R is the gas constant and T is temperature. Ph and Pl represent the up and downstream pressures. In this case, downstream pressure is assumed to be 0 (vacuum). 207
13. After completing all of the necessary experiments, be sure to relieve the pressure on the system. To do this, shut off the helium to the system and open all valves to the atmosphere.
Figure J.1 Unsteady state helium permeation diagram
208
APPENDIX K SINGLE AND MULTICOMPONENT GAS PERMEATION
209
1. Before starting the experiment check that the flow rates on the feed and sweep side are equal to ensure that there will be no total pressure across the membrane 2. Mount the membrane in the stainless steel permeation cell (PC). Be sure that each side of the membrane is sealed with a rubber (Viton) o-ring.
A
schematic of the multicomponent set up can be found in Figure J.1. 3. Completely seal the membrane by tightening the bolts around the edges. 4. Make sure that all the valves (marked 2) in the schematic are closed before attaching the membrane cell to the system. 5. Ensure that the right gases are connected to the system and all the cylinders are at the same pressure. 6. Once the permeation cell is connected to the system. Open all valves simultaneously. This is done to ensure that no pressure drop is created with in the system, that would cause channeling. 7. Check the rotameter readouts to ensure that the flow rates on both the sweep and feed side are equal. 8. Allow the steam to reach steady state. ( This will take one to two hours depending on the gas used) 9. Measure and record the flow rate on feed and sweep side using bubble flow meter. 10. Collect gas sample from permeation apparatus at the feed and sweep side and inject sample into GC to determine composition. 210
11. To measure oxygen concentration oxygen sensor can be used.
Figure K.1: Schematic representation of permeation setup
211 Buy SmartDraw!- purchased copies print this document without a watermark . Visit www.smartdraw.com or call 1-800-768-3729.
APPENDIX L MULTICOMPONENT GAS PERMEATION SETUP FOR OXYGEN/WATER VAPOR SEPARATION STUDIES
212
1. Seal membrane in permeation cell with appropriate o-rings with membrane layer should be facing upstream. 2. Make sure the gases are flowing before connecting the membrane to set up to ensure no surge occurs on starting the flow which carries water into the permeation cell. 3. Set flow rate of given gas though mass flow controllers to fix the appropriate dry and saturated air feed rates to ensure the desired humidity is obtained. 4. Allow the system to reach steady state. This will take about one hour. 5. Measure the humidity using the humidity meter 6. Change input humidity by changing the flow rates of dry and saturated air. Make sure the total flow rate is kept constant 7. Measure the flow rate once steady state is reached with a bubble flow meter 8. Measure the oxygen concentration in the feed and sweep stream using oxygen sensor.
213
9
Air + water vapor
7 3
5
4
8 9
3
Air + water vapor
Air + water vapor 8
5
5
6
1
10
2
1. Nitrogen, 2. Air, 3. Mass flow controllers, 4. Valve, 5. Three way valve, 6. Bubbler 7. Membrane, 8. Membrane Cell, 9. Oxygen/Humidity sensor holder, 10. Sensor
Figure L.1: Multicomponent membrane separation schematic for water vapor/oxygen separation tests
214