(2015). [5] Attarad Ali, Hira Zafar, Muhamad Zia, Ihsanul Haq, Abdul Rehman Phull, Joham Sarfraz Ali and Altaf Hussain, Nanotechnol. Sci Appl. 9:49â67 (2016).
© 2018 JETIR May 2018, Volume 5, Issue 5
www.jetir.org (ISSN-2349-5162)
Synthesis and Dielectric Studies of Magnetite Nanoparticles M. Madankumar1, D. Sivakumar1, 2, S. Premkumar1, M Manivannan3 M. Mohamed Rafi 1, K. Prem Nazeer1*, A. Ayisha Begam4 1
PG & Research Department of Physics, Islamiah college, Vaniyambadi -635 752, Tamilnadu, India Department of Physics, Sree Krishna College of Engineering, Unai, Anaicut -632 101, Tamilnadu, India 3 Department of Physics, Sacred Heart College (Autonomous) Tirupattur-635601, Tamilnadu, India 4 Department of Physics, Avinashilingam Institute for Home Science and Higher Education, Coimbatore – 641 043, Tamilnadu, India. 2
ABSTRACT: The magnetite nanoparticles for various pH were successfully synthesized by co-precipitation method. The high optical transmittance and the presence of ferric association in the synthesized product are evident from FTIR spectroscopic technique. The structure of pristine Fe3O4 nanoparticles is investigated by powder XRD pattern and morphology is visualized by SEM analysis. Dielectric behaviours of the magnetite nanoparticle were investigated to determine current conduction mechanisms and the development of the conductive network within the nanoparticle as a function of frequency and pH concentration. Dielectric studies show an increase in migration and polarization of mobile carriers with increase in pH. The electric modulus studies reveal the non-Debye type behavior of the sample. Keywords; Fe3O4, co-precipitation, magnetite nanoparticles, dielectric studies
1. INTRODUCTION Nanoscience and nanoengineering are the todays emerging fields which lead to unprecedented understanding and control over the fundamental building blocks of all physical matter. The word nano means “dwarf” in Greek language which is used as a prefix for any unit like a second or a meter and it means a billionth of that unit. Nanotechnology makes microelectronics to be mere hints of what will come from engineering that begins on the even smaller scales of nanostructures [1]. Despite its increasing prominence in the scientific, regulatory and public spheres, there is still no single definition of “nanotechnology”. In essence, nanotechnology refers to the production, manipulation and use of materials at the scale of 100 nanometers or less. At this scale, materials behave unexpectedly, exhibiting properties that differ physically, chemically and biologically from their larger counterparts [2]. Although much of nanotechnology is still in the research and development phase, nanomaterial’s are expected to be used in a wide variety of applications ranging from biomedical drug delivery to electronics, pollution remediation and less toxic modes of manufacturing. Many scientists and policy-makers see nanotechnology as the wave of the future and as a result investment in nanotechnology has continued to increase. At present, innovation in nanotechnology applications is proceeding ahead of related policy and regulation, raising concerns that ethical, environmental, economic, legal, social and toxicological research is lagging behind [3, 4]. Iron oxide nanoparticles (NPs) have attracted much consideration due to their unique properties, such as superparamagnetism, surface-tovolume ratio, greater surface area, and easy separation methodology. Various physical, chemical, and biological methods have been adopted to synthesize magnetic NPs with suitable surface chemistry. This review summarizes the methods for the preparation of iron oxide NPs, size and morphology control, and magnetic properties with recent bioengineering, commercial, and industrial applications. Iron oxides exhibit great potential in the fields of life sciences such as biomedicine, agriculture, and environment. Nontoxic conduct and biocompatible applications of magnetic NPs can be enriched further by special surface coating with organic or inorganic molecules, including surfactants, drugs, proteins, starches, enzymes, antibodies, nucleotides, nonionic detergents, and polyelectrolytes. Magnetic NPs can also be directed to an organ, tissue, or tumor using an external magnetic field for hyper thermic treatment of patients. Keeping in mind the current interest in iron NPs, this review is designed to report recent information from synthesis to characterization, and applications of iron NPs [5]. Co precipitation is an excellent choice when higher purity and better stoichiometric control are required. However, co precipitation can produce wide particle size distributions with mean sizes ranging from submicron to tens of microns if the necessary precautions are not taken. Milling the calcined powder is sometimes required to achieve the desired particle size, and contributes to decreased purity. Calcination temperatures are usually lower for coprecipitation than the mixed oxide methods, and the product is more easily milled to finer particle sizes. Formation of coprecipitated powder is generally more tedious than mixed oxide methods because the slow precipitation and sometimes rigorous washing steps increase synthesis time. Synthesis from metal alkoxide precursors produces very fine particles on the order of 50–1000 Å with very narrow particle size distributions. The particles are stoichiometric on a very fine level and have a high purity with most contamination being silicon from glassware. The main disadvantage of metal alkoxide methods is the most techniques are costly, time consuming, and produce a low product yield. Second phases are not a problem with metal alkoxide techniques when inert atmosphere and boiled distilled water are used during all processing steps. The method developed by Pechini (1967) includes the advantage of producing a polymer matrix that can be formed into thin films and other unique shapes by plastic forming techniques and subsequently thermally converted to electro ceramics [6]. In this present work describes the dielectric behavior of the pristine Fe3O4 NPs for the different pH values (i.e pH 8, 9, 10 & 11). The changes in electrochemical properties, including impedance (Z' and Z''), dielectric constant (εr), loss factor (tan d) and electrical conductivity (ζ) of the pure Fe3O4 NPs are described. The ac and dc conductivity plots were plotted for different pH values. XRD peaks for grain size calculation, FT-IR plot for the functional groups and SEM images for the different pH values were described. 2. MATERIALS AND METHODS The starting materials ferric chloride hexahydrate (FeCl 3·6H2O), ferrous sulfate heptahydrate (FeSO4·7H2O), ammonia (NH3), and ethanol (C2H6O) were obtained from Fisher scientific, India. The purity of the reactant chemicals was ≥ 99.9%. JETIR1805567
Journal of Emerging Technologies and Innovative Research (JETIR) www.jetir.org
886
© 2018 JETIR May 2018, Volume 5, Issue 5
www.jetir.org (ISSN-2349-5162)
To synthesize SPIONs, 1.49 g of FeCl3·6H2O and 0.765 g of FeSO4·7H2O were mixed and heated at 60°C under a nitrogen atmosphere. 10 M ammonia solution was then added drop wise to the parent solution until the pH became 10. The resultant solution was maintained at 60°C for 2 h, and centrifuged at 15,000 rpm for 10 min. The sediment particles were thoroughly washed with distilled water three times to remove the byproducts. Thereafter, the particles were washed several times with ethanol. The product was finally dried in an oven at 100°C for 3 h. The detailed synthesis procedure of Fe3O4 nanoparticles is shown in the flow chart.
3. RESULT AND DISCUSSIONS: 3.1 X-Ray powder diffraction analysis In order to analyze the structure of synthesized samples, X-ray diffraction was employed using Rigaku X-ray diffractometer with CuKα (=1.5405Å) radiation at room temperature in the range of 5 to 80°. Figure 1 shows the XRD pattern of Fe3O4 for various pH values. Six characteristic peaks at 30.460°, 35.690°, 43.240°, 53.898°, 57.227° and 63.006° degrees were corresponding to the (220), (311), (400), (422), (511) and (440) crystal planes of a pure Fe 3O4 with a spinal structure (JCPDS No. 85-1436). The peaks indicate that Fe3O4 with a spinal structure and no characteristic peak of impurities are detected in the XRD pattern reported by sivakumar et al (2018). Therefore, it was confirmed that the crystalline structure of obtained magnetite nanoparticles, agreed with the structure of an inverse spinel type oxide. The average sizes were determined from the FWHM of the XRD peaks using Debye Scherrer equation. The average grain size was calculated using the formula [7]
DN
k Cos
Here, DN is the crystallite mean size, k is a shape function for which a value of 0.9 is used, λ is the wavelength of the radiation, β the full width at half maximum (FWHM) in radians in the 2θ scale, and θ the Bragg angle. The calculated average particle size of Fe 3O4 NPs is 16 nm.
JETIR1805567
Journal of Emerging Technologies and Innovative Research (JETIR) www.jetir.org
887
© 2018 JETIR May 2018, Volume 5, Issue 5
www.jetir.org (ISSN-2349-5162)
Fig.1 Powder X-ray diffraction pattern of Fe3O4 for various pH values 3.2 FTIR analysis Fourier Transform Infrared spectroscopy is used to identify the functional groups and modes of vibration of the synthesized pure Fe3O4 nanoparticles using a Perkin Elmer spectrometer in the range 400-4000 cm-1 with a resolution of 4 cm-1. The dried sample was placed on a silicon substrate transparent to infrared, and spectra were measured according to the transmittance method. It can be seen that the characteristic absorption of Fe-O bond is at 580 cm-1 and 634 cm-1. The absorptions at 1399 cm-1 is a characteristic peak of the COO-Fe bond, which may be due to the reaction of hydroxide radical groups on the surface of Fe3O4 [8]. The peaks at 2855 cm-1 and 2924 cm-1 are from the vibration of in long alkyl chain -CH2 and -CH3. Furthermore, the characteristic peak of -OH bond at 3378 cm-1 is obviously enhanced. The peaks at 581 cm-1 and 628 cm-1 in confirm the existence of Fe-O bond.
Fig.2 FT-IR spectrum of the Fe3O4 for various pH values JETIR1805567
Journal of Emerging Technologies and Innovative Research (JETIR) www.jetir.org
888
© 2018 JETIR May 2018, Volume 5, Issue 5
www.jetir.org (ISSN-2349-5162)
Table 1 Vibrational assignment of Fe3O4 nanoparticles. Wavenumber (cm-1)
Vibrational assignment
580, 634
Fe-O bond
1399
COO-Fe bond
2855, 2924
long alkyl chain -CH2 and -CH3
3378
-OH bond
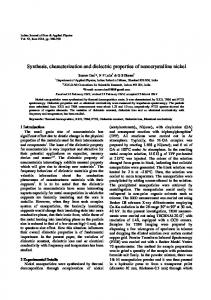
3.2 SEM analysis The morphology of the product was examined by scanning electron microscope using VEGAS3 TE SCAN and the images recorded for the samples were prepared by co-precipitation method. Fig.3 shows the SEM images for different magnification of Fe3O4 and homogenous in size distribution with strong agglomeration. From the analysis, a Fe3O4 nanoparticles which has a spherical like particle shape with the average particle size of 16.25 nm excluding agglomerate particles, and there are some rough porous on the surface of the particles [9].
pH-8
pH-9
pH-10
pH-11
Fig.3 shows the SEM images of the Fe3O4 nanoparticles 3.4 Dielectric analysis Frequency dependence of the real part of dielectric constant (ε) of the sample is measured at room temperature using PSM 1735 N4L. The dielectric constant shows dispersion at low frequencies which is a typical character of dielectric materials. There are four types of polarization viz. (a) electronic, (b) ionic, (c) dipolar and (d) interfacial polarization, contributing to the total polarization of a dielectric material. Interfacial polarization contributes only in the lower frequency range. The dielectric constant of the Fe3O4 nanoparticles was calculated by following the relation by equation,
JETIR1805567
Journal of Emerging Technologies and Innovative Research (JETIR) www.jetir.org
889
© 2018 JETIR May 2018, Volume 5, Issue 5
www.jetir.org (ISSN-2349-5162)
cpd A o
Were, ε, cp, d, A and εo are the dielectric constant, capacitance value, thickness, Area of the specimen under investigation and permittivity of free space (8.854×10⁻¹² F/m) respectively. The dielectric constant of Fe3O4 nanoparticles is decreases as the frequencies increases and it almost remains constant at higher frequencies. Figure shows the frequency dependence dielectric constant of Fe 3O4 as a function of frequency at room temperature. The decrease in ε' with increasing frequency may be attributed to polarization decreasing with increasing frequency before reaching a constant value when the electron hopping cannot follow the alternative field beyond a certain frequency. The variation of dielectric loss as a function of frequency at ambient temperatures is shown in fig.4 (b). It is seen that the tanδ curve reaches a maximum at middle frequency range and then decreases at high frequencies. The tan δ vs. frequency curve exhibits a distinct relaxation appears which shifts towards lower frequencies as increasing pH level. At higher frequencies however the electron-exchange between Fe3+ and O4- ions cannot follow the alternation of the applied electric field. Hence tanδ fall to smaller values. The observed peak in the measured frequency region gives the relaxation peak of the material. Therefore, relaxation behavior arises whenever two phases with different electrical conductivities are in contact.
(a
(b)
Fig.4 (a&b) Variation of dielectric constant and loss of Fe3O4 as a function of frequency for various pH JETIR1805567
Journal of Emerging Technologies and Innovative Research (JETIR) www.jetir.org
890
© 2018 JETIR May 2018, Volume 5, Issue 5
www.jetir.org (ISSN-2349-5162)
(c)
Fig.4(c) Frequency dependence real part of impedance of Fe3O4 for various pH
(d)
Fig. 4 (d) Frequency dependence imaginary part of impedance of Fe3O4 for various pH
JETIR1805567
Journal of Emerging Technologies and Innovative Research (JETIR) www.jetir.org
891
© 2018 JETIR May 2018, Volume 5, Issue 5
www.jetir.org (ISSN-2349-5162)
e)
Fig.4(e) Cole-Cole spectrum of Fe3O4 for various pH Complex impedance data, Z can be represented by its real, Z' and imaginary, Z''. The expression of real (Z') and imaginary (Z'') components of impedance related to the equivalent circuit are
Z ' Z cos( ) Z '' Z sin( ) The variations of real Z' and imaginary part of Z” of electrical impedance as a function of frequency for different pH are depicted in Fig 4 (c &d). The amplitude of Z' is higher in the low frequency region and it decreases monotonically with increase in frequency. In addition, the magnitude of Z' decreases with the rise in pH. This trend of Z' may be due to increase in ac conductivity with pH and frequency. This may be due to the release of space charge polarization as a result of the lowering of the barrier properties of the materials at higher pH. Fig 4(e) shows the complex impedance spectra of Fe3O4 for some representative pH concentrations. The change in pH ensures a distinct effect on the characteristics impedance spectrum of the material, these spectra show a circle-arc as a non-ideal that is attributed to the bulk boundary properties. The Nyquist plots of the Fe3O4, as shown in Fig. exhibited a single semicircle shape indicating the presence of polarization with a single relaxation time [10]. The radius of the semicircle represents the nanocomposite resistance, while the center of the semicircle represents the distance between nanofiller particles [11].
f)
Fig. 4(f) Frequency dependence real part of permittivity of Fe 3O4 for various pH JETIR1805567
Journal of Emerging Technologies and Innovative Research (JETIR) www.jetir.org
892
© 2018 JETIR May 2018, Volume 5, Issue 5
www.jetir.org (ISSN-2349-5162)
g)
Fig. 4(g) Frequency dependence imaginary part of permittivity of Fe 3O4 for various pH The dielectric relaxation is described by a non-Debye model which gives the frequency dependent complex permittivity in the form: ε* = ε'-jε''. Where ε' and ε'' are the real and imaginary parts of the dielectric constant respectively, j 2 = -1.
Z '' co ( Z '2 Z ''2 ) '
Z' '' co ( Z '2 Z ''2 ) where ω = 2πf is the angular frequency and co is the geometrical capacitance. These relations offer wide scope for a graphical analysis of the various parameters under different conditions of pH or frequency. In Fig. 4(f & g) illustrate the frequency dependence of dielectric complex permittivity (ε' and ε'') at various pH. The dielectric constant is the ratio of the capacitance of a set of electrodes with the dielectric material between them to the capacitance of the same electrodes with vacuum between them [12]. The dielectric constant increases with the increase in pH because of the total polarization that arises from the dipole orientation and the trapped charge carrier’s density due to the increase in the dissociation of ion aggregates. In fact, higher dielectric constants at low frequencies depend on ionic vibration of movement, ion–ion orientation, and space charge effects, suggest the existence of electrode polarization and space charge effects have occurred confirming non-Debye dependence. The values of ε' decreases gradually with increasing frequency and shows dispersive behavior at low frequencies. The high values of ε', observed at low frequencies, are related to the accumulation of charges at the interface between the sample and electrodes [13]. Electric modulus Electric modulus for determining the aspects of electrical transport phenomena of the Fe 3O4 was analyzed at ambient temperature. The real and imaginary parts of electric modulus were obtained from the real and imaginary parts of the measured impedance data by using the following equation, [
]
[ ] The real part of the electric modulus and the imaginary part of electric modulus vs. frequency plots of Fe3O4 at ambient temperature for different pH are shown in fig. 5 (a &b) respectively. The observed long tail at low frequencies is attributable to the large value of electrode polarization capacitance. For all the pH, the increase gradually at high frequencies and it can be observed that the electric modulus spectra exhibit overlapped peaks, which reflect the grain and grain boundary contributions. The decrease in M' value at high pH is due to the decrease of resistance of the sample and increase in electrode polarization [14, 15].
JETIR1805567
Journal of Emerging Technologies and Innovative Research (JETIR) www.jetir.org
893
© 2018 JETIR May 2018, Volume 5, Issue 5
www.jetir.org (ISSN-2349-5162)
(a)
Fig. 5(a) Frequency dependence real part of electric modulus of Fe 3O4 for various pH
(b)
Fig.5(b) Frequency dependence imaginary part of electric modulus of Fe 3O4 for various pH Fig 5(b) shows the variation of imaginary part of electric modulus with frequency at selected pH. At high pH the peaks are asymmetric and broad which indicate the distribution of relaxation times. However at low pH the peaks disappeared possibly due to the frequency limitation. The Argand plots at various pH for the Fe3O4 is shown in Fig. The Argand plots exhibit incomplete semicircular arc, which indicates the non-Debye type relaxation process. Thus the non-Debye behavior is due to the fact that in real material there are more than one type of polarization mechanism and a lot of interactions between ions and dipoles that resulted in a distribution of relaxation time.
JETIR1805567
Journal of Emerging Technologies and Innovative Research (JETIR) www.jetir.org
894
© 2018 JETIR May 2018, Volume 5, Issue 5
www.jetir.org (ISSN-2349-5162)
Fig. 6 Electric modulus plots imaginary M″ vs. real M' at various pH for the Fe3O4 nanoparticles
(a)
Fig. 7 (a) Variation of resistivity of Fe3O4 as function of frequency for various pH
JETIR1805567
Journal of Emerging Technologies and Innovative Research (JETIR) www.jetir.org
895
© 2018 JETIR May 2018, Volume 5, Issue 5
www.jetir.org (ISSN-2349-5162)
(b)
Fig. 7(b) Variation of DC conductivity of Fe3O4 as function of frequency for various pH The measured value of the electrical resistivity and conductivity at various pH are shown in figure. The Fe3O4 samples exhibit an increase in electrical conductivity with increase in pH. The electrical conductivity (DC) (ζ) for the sample was calculated using the following relation,
where ζ = electrical conductivity of the sample, R is the resistance of the sample, L the thickness and A the area of the sample. The electrical conductivity of Fe3O4 is improved with increase in the pH. This improvement is due to (i) the better structural ordering that may have taken place at the higher pH. (ii) The higher concentration of the charge carriers. The resultant increase in the conduction process may be due to the reorientation of atomic sites and enhancement of short-range translational motion of charge carriers hopping with increase in frequency and pH [16]. Lattice water and oxygen vacancies present in Fe3O4 NPs play a vital role in mobilizing charge carriers [17]. 4. Conclusions: The Fe3O4 nanoparticles for various pH were successfully synthesized by co-precipitation method. The X-ray diffraction results showed the good crystallinity of the samples and the cubic structure of Fe 3O4 nanoparticle was confirmed. The average crystallite size estimated from XRD results using Scherrer formula is around 16 nm for all the samples. The functional groups were estimated by FTIR analysis. The SEM results revealed that there is no change in morphology. Dielectric behaviours of the Fe3O4 nanoparticle were investigated to determine current conduction mechanisms and the development of the conductive network within the nanoparticle as a function of frequency and pH concentration. Dielectric studies show an increase in migration and polarization of mobile carriers with increase in pH. The electric modulus studies reveal the non-Debye type behavior of the sample. REFERENCE [1] J. Dutta & H. Hofmann, Nanomaterials, 7-13 (2005). [2] Mahnaz Mahdavi, Mansor B Ahmad, Md J Haron, Farideh Namvar, Behzad Nadi, Mohamad Zaki Ab Rahman and Jamileh Amin, Molecules 18,7533-7548 (2013). [3] K. Tharani, L.C. Nehru, Int. Adv. Res. Phy. Sci., August (2015). [4] M. Mohamed Rafi, K. Syed Zameer Ahmed, K. Prem Nazeer, D. Siva Kumar, M. Thamilselvan, Appl Nanosci 5:515–520 (2015). [5] Attarad Ali, Hira Zafar, Muhamad Zia, Ihsanul Haq, Abdul Rehman Phull, Joham Sarfraz Ali and Altaf Hussain, Nanotechnol Sci Appl. 9:49–67 (2016). [6] J.H. Adaira, E. Suvacib, in Encyclopedia of Mater.: Sci. Tech., 2001 [7] Javier A. Lopez, Ferney González, Flavio A. Bonilla, Gustavo Zambrano, Maria E. Gómez, Rev. LatinAm. Metal. Mat. 30 (1) 60-66 (2010). [8] R.Y.Hong, S.Z.Zhang, G.Q.Di, H.Z.Li, Y.Zheng, J.Dinge, D.G.Weif, Mater Res Bull 43 2457-2468 (2008). [9] JingxingYang, XuweiYang, HuaYang, J.alloy, compound. 512, 190-194 (2012). [10] Deng Xu V. Sridhar S. P. Mahapatra Jin Kuk Kim, J. Appl. Poly. Sci. 111 1358–1368 (2009). [11] B P Sahoo, K Naskar, A Dubey, Ram N. P. Choudhary, D K Tripathy, J. Mater. Sci. 48 702–713 (2013). [12] Mohammed H Al-Saleh, Haya K Al-Anid, Yazan A Husain, Hasan M El-Ghanem and Saadi Abdul Jawad, J. Phys. D: Appl. Phys. 46 385305, (2013). [13] A. Karmakar, A. Ghosh, Current Applied Physics 12, 539-543 (2012). [14] Shujahadeen B. Aziz, Adv. Mater Sci. Eng., 2527013, 1-11 (2016). JETIR1805567
Journal of Emerging Technologies and Innovative Research (JETIR) www.jetir.org
896
© 2018 JETIR May 2018, Volume 5, Issue 5
www.jetir.org (ISSN-2349-5162)
[15] B.Nageswara Rao, O.Padmaraj, D.Narsimulu, M.Venkateswarlu, N.Satyanarayana, Ceramics Int. Part B, 41(10) 14070-14077 (2015). [16] S. Kalaiarasi, M. Jose, Appl. Phys. A 123:512, 1-10 (2017). [17] D. Sivakumar, K. Chandra Babu Naidu, K. Prem Nazeer, M. Mohamed Rafi, G. Ramesh kumar, B. Sathyaseelan, G. Killivalavan, and A. Ayisha Begam. Journal of the Korean Ceramic Society [2018].
JETIR1805567
Journal of Emerging Technologies and Innovative Research (JETIR) www.jetir.org
897