J Mol Model (2014) 20:2526 DOI 10.1007/s00894-014-2526-8
ORIGINAL PAPER
Synthesis, characterization, and computational study of a new dimethoxy-chalcone Ricardo R. Ternavisk & Ademir J. Camargo & Francisco B. C. Machado & José A. F. F. Rocco & Gilberto L. B. Aquino & Valter H. C. Silva & Hamilton B. Napolitano
Received: 30 April 2014 / Accepted: 10 November 2014 / Published online: 25 November 2014 # Springer-Verlag Berlin Heidelberg 2014
Abstract Chalcones are an important class of medicinal compounds and are known for taking part in various biological activities as in anti-inflammatory, anti-leishmania, antimitotic, and antiviral. Chemically, chalcones consist of open-chain flavonoids in which the two aromatic rings are joined by a three-carbon α,β-unsaturated carbonyl system. The wide action spectrum has attracted our attention to synthesize, crystallize, and characterize the dimethoxy-chalcone C18H18O3. Aiming to understand the process of crystal lattice stabilization, a combination of technique has been used including Xray diffraction, infrared spectroscopy and computational molecular modeling. The theoretical calculations were carried out by the density functional method (DFT) with the M06-2X functional, with the 6-311+G(d,p) basis set. The vibrational wavenumbers were calculated and the scaled values were compared with experimental FT-IR spectrum. The intermolecular interactions were quantified and intercontacts in the crystal structure were analyzed using Hirshfeld surfaces. Bond distances and angles described by the X-ray diffraction and theoretical calculation are very similar. The C-H….O contacts contributing to assemble the supramolecular architecture are also responsible for the molecular structure assembly. This paper belongs to Topical Collection Brazilian Symposium of Theoretical Chemistry (SBQT2013) R. R. Ternavisk : A. J. Camargo : G. L. B. Aquino : V. H. C. Silva : H. B. Napolitano (*) Ciências Exatas e Tecnológicas, Universidade Estadual de Goiás, CP459, 75001-970 Anápolis, GO, Brazil e-mail:
[email protected] F. B. C. Machado : J. A. F. F. Rocco Departamento de Química, Instituto Tecnológico de Aeronáutica, 12228-900 São José dos Campos, SP, Brazil V. H. C. Silva Faculdade de Tecnologia SENAI Roberto Mange, 75113-630 Anápolis, GO, Brazil
Keywords DFT . Dimethoxy-chalcone . Infrared spectroscopy . X-ray diffraction
Introduction Chalcones are considered key precursors for flavonoid and isoflavonoid syntheses. It can be obtained from natural sources or synthetic route. The basic structure of chalcones consists of the two aromatic rings joined by a three-carbon α,β-unsaturated carbonyl system [1, 2]. Chalcones have received great attention due to their relatively simple synthesis process, simple structure, and a range of pharmacological activities have been reported such as: anticancer [3], antileishmanial and antimalarial [4], antiviral [5], and other bioactivities etc. [1]. Dimethoxy and trimethoxy chalcone derivatives have been reported in the literature as effective antiinflammatory agents [6]. The chalcones versatility are attributed to the α,β unsaturated ketone moiety, the conjugated double bonds and the completely delocalized pi electron system on both aromatic rings. The large range of pharmacological properties of chalcones is intrinsically linked to the substitution pattern of the two aromatic rings [7]. Fundamental properties of the material such as stability, solubility, color, strength and furthermore, pharmacological/technological application are related with the molecular arrangement in the crystal lattice [8, 9]. In view of the numerous important biological activities of chalcones, as described before, there is considerable interest in the scientific community in synthesizing new chalcone derivatives suitable for biological applications. Bearing this in mind, this paper presents the results of the synthesis, structural characterization, and M06-2X/6-311+G(d,p) calculations of (E)-3-(3,5-dimethoxyphenyl)-1-(4-methylphenyl)prop-2-en1-one (C18H18O3). In order to understand the nature of crystal packing and to describe the molecular sites where
2526, Page 2 of 11
J Mol Model (2014) 20:2526
least-squares on F2 using SHELXL97 [12]. The hydrogen atoms on the carbon atoms were positioned geometrically and refined applying the riding model [C-H 0.93 Å for C sp2 and C-H 0.96 Å for C sp3] with Uiso(H)=1.2Ueq(C) for C sp2 and Uiso(H)=1.5Ueq(C) for C sp3. The crystallographic data of C18H18O3 are a=16.848(2) Å, b=11.539(2) Å, c=8.089(2) Å, β =103.507(5)°, cell volume V=1529.18(6) Å3, monoclinic space group P21/c, goodness of fit 1.020, and R=0.048 (Table 1). The cell refinements were carried out using the software Collect [13] and Scalepack software [14]. Data reduction was carried out using the software Denzo-SMN and Scalepack software [14]. Molecular representation, tables and pictures were generated by WinGX [15], ORTEP-3 [16], and MERCURY 2.2 [17] programs. The intermolecular interactions of the title compound are quantified using PARST of WingX packing and intercontacts in the crystal structure are analyzed using Hirshfeld surfaces. The Hirshfeld surfaces [18, 19] and the associated 2D fingerprint plots were calculated using Crystal Explorer [20]. This approach is a graphical tool for visualization and understanding of intermolecular interactions [20]. The experimental absorption spectrum in the solid state was observed in the region (4000–400 cm−1) obtained in a spectrophotometer FT-NIR/MIR PerkinElmer Frontier, the sample was screened in potassium bromide (KBr) and the main absorbent groups were characterized. The experimental infrared spectrum of C18H18O3 is presented in Fig. 4(a).
electrophilic and nucleophilic reactions can take place and the hydrogen-bonding interactions, the molecular electrostatic potential mapping was performed on title compound at the same level of theory. The M06-2X/6-311+G(d,p) calculations of the vibrational modes were carried out in order to support the spectrum assignment of the (E)-3-(3,5-dimethoxyphenyl)1-(4-methylphenyl)prop-2-en-1-one. Finally, the computations of the geometric and electronic properties presented here are very important to shed light on the understanding of the structure-activity relationship [10] for this new compound.
Experimental and computational procedures Synthesis and crystallization In a 25 mL flask were added 0.3003 g (2.24 mmol) of 4methylacetophenone 2 and cooled in an ice bath. Then, 9 ml of a solution of NaOH (50 %w/v) was added, and then 0.41 g (2.24 mmol) of 3,5-dimethoxybenzaldehyde 3 was added (Scheme 1). The resulting solution was stirred at room temperature for 24 h, after this time the medium reaction was poured into ice water and neutralized with 50 % HCl solution. The resulting precipitate was filtered, washed with water and purified by recrystallization from methanol. The solid obtained showed yellow coloration: mp.: 85.2–87.6 ° C. 1H-NMR (500 MHz) (CDCl3):δ (ppm) 2,46 (s, 3 H, CH3Ph) 3,86 (s, 6 H, OCH3Ph) 6,55 (t, 1H, PhCH, J=2,4 Hz) 6,80 (d, 2H, PhCH, J=2,4 Hz) 7.33 (d, 2 H, PhOCH3J=8.4 Hz) 7.50 (d, 1H, CHCO, J=15.6 Hz) 7.73 (d, 1H, CHPh, J=15.6 Hz) 7.95 (d, 2H, PhOCH 3 , J = 8.4 Hz). 13 C-NMR (125 MHz) (CDCl 3 ):δ 21,53 CH 3 Ph 55,66 (OCH 3 Ph) Anel Ph. (102,85; 106,52; 128,85; 129,50; 135,78; 137,11; 161,26) olefin. (122,88; 144,48) 190,28 (C=O). IR (KBr) cm−1: 2940; 1657 (C=O); 1593; 1426. The compound C18H8O3(1) was crystallized from methanol in 5 days by the slow evaporation technique.
Computational procedures The start geometry used in the calculations was taken directly from the x-ray data and it was fully optimized without constraint using the density functional theory (DFT) as implemented in the Gaussian 09 package of programs [21, 22]. The hybrid metaGGA exchange correlation functional M06-2X [23] was employed throughout the calculations. This functional is parameterized for nonmetals and it is recommended for applications involving main group thermochemistry, kinetics, non covalent interactions, and electronic excitation energies [23, 24]. The extended Gaussian basis set 6-311+G(d,p) of Pople and coworkers [25, 26] was used for all the computations. To confirm if the fully optimized geometry found in a local minimum, analytic harmonic frequency calculations were carried out at the same level of theory. The absence of imaginary frequencies shows that the optimized structure is really in a local minimum. The assignments of the vibrational modes were supported by the
Crystallographic and infrared spectroscopy characterization The X-ray diffraction data for the title compound were collected at room temperature using a KAPPA-CCD diffratometer [11] with graphite-monochromated MoKα radiation (λ=0.71073 Å). The structure (Fig. 1) was solved by direct methods and anisotropically refined with full-matrix
O
O
Scheme 1 Synthesis of dimethoxy-chalcone C18H18O3
O
O O
H MeoH/NaOH50%
+
0°C - T.a / 24h O
2
3
O
1
J Mol Model (2014) 20:2526
Page 3 of 11, 2526
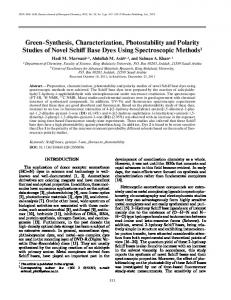
Fig. 1 The ORTEP diagram of ellipsoids at 30 % probability level with the atomic numbering scheme for C18H18O3. All bonds are in the normal range and hydrogen atoms are shown as spheres of arbitrary radii
animation option of Gassview [24], which is a graphical interface for Gaussian program that can provide us with a visual representation of the shape of the vibrational modes.
In order to investigate the reactive site of the (E)-3-(3,5dimethoxyphenyl)-1-(4-methylphenyl)prop-2-en-1-one compound the molecular electrostatic potential (MEP) was evaluated at the M06-2X/6-311+G(d,p) level of theory. The mapping of the molecular electrostatic potential around a molecule was obtained using the equation [27]:
Z X ZA V ðr Þ ¼ − jRA −rj
Table 1
Crystal data and structure refinement for C18H18O3
Formula weight Temperature Wavelength Crystal system Space group Unit cell dimensions
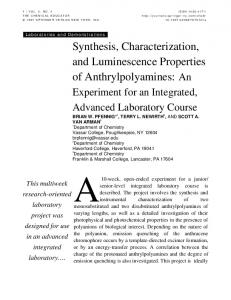
Fig. 2 Hirshfeld surfaces indicating intermolecular contacts for C18H18O3. Dotted lines represent hydrogen bonds
ρðr0 Þ 0 dr ; jr0 −rj
Volume Z, calculated density Absorption coefficient F(000) Reflections collected/unique Refinement method Goodness-of-fit on F2 Final R indices [I >2σ(I)] R indices (all data)
282.32 u.a. 293 K 0.71073 Å Monoclinic P21/c a =16.8489(4) Å b =11.5390(3) Å c =8.0891(2) Å β=103.506(2)0 1529.18 Å3 4, 1.29 mg/m3 0.083 mm−1 600.0 30,952/3127 Direct methods 1.020 0.048 0.0744
2526, Page 4 of 11
J Mol Model (2014) 20:2526
where V(r) stands for the electrostatic potential at point r created by nuclei and electrons of the molecular system, ZA is the charge of nucleus A located at RA, ρ(r′) is the electronic density, and r′ is the integration variable. The MEP mapping is a very powerful tool to describe molecular sites of electrophilic attack, nucleophilic reactions, and hydrogen bonding interaction. In addition, the molecular electrostatic potential map is commonly used to describe drug-receptor and enzymesubstrate interactions, because it is the driving force that acts on long distance.
Results and discussion Crystallographic structure The dimethoxy-chalcone C18H18O3 crystallizes in the centrosymmetric space group P21/c. The molecule is a chalcone with 3,5-dimethoxyphenyl and 4-methylphenyl rings bonded at the opposite ends of a –CO–CH=CH– group. The ellipsoid Table 2 The calculated and experimental geometric parameters for C18H18O3
displacement plot with the numbering scheme is presented in Fig. 1. X-ray geometry parameters (bond lengths, bond angles, and torsion angles) were compared with fully optimized geometric parameters, and the results are very similar. The most notable discrepancies are observed for C4-O1 and C5-C18 bonds [1.228(2) Å and 1.214 Å / 1.377(2) Å and 1.391 Å, respectively] and C4-C7-C6 angle [121.5(1)° and 120.04°, respectively]. The differences occur because the Xray results belong to the solid phase while optimized geometry was carried out at free molecule in vacuum. The benzene rings 1 and 2 are planar with a mean deviation of 0.0095 Å and 0.0054 Å respectively. The planes between the two benzene rings form a dihedral angle of 28.45(4)° for packing and 12.86° for the M06-2X/6-311+G (p,d) optimized structure. The torsion angles for –C6=C7–C4–C3 are −175.33°, −179.22° and 167.58°, 177.09° for –C10–C6=C7–C4, respectively. The optimized and experimental geometry are presented in Table 2. The potential intermolecular interactions of the title compound are visualized using Hirshfeld surface analysis. This
Bond distances (°Ǻ)
X-ray
DFT
Bond angles (°)
X-ray
DFT
C3-C5 C3-C17 C3-C4 C4-O1 C4-C7 C5-C18 C6-C7 C6-C10 C9-C14 C9-C10 C10-C15 C11-C12 C11-C14
1.387(2) 1.397(2) 1.486(2) 1.228(2) 1.477(3) 1.377(2) 1.327(3) 1.465(2) 1.377(2) 1.406(2) 1.393(2) 1.377(3) 1.394(2)
1.394 1.398 1.498 1.214 1.488 1.391 1.338 1.468 1.384 1.408 1.386 1.384 1.403
C12-O2-C20 C4-C3-C5 C4-C3-C17 C5-C3-C17 O1-C4-C3 O1-C4-C7 C3-C4-C7 C3-C5-C18 C7-C6-C10 C4-C7-C6 C14-O8-C21 C10-C9-C14 C6-C10-C15
117.8(1) 123.4(1) 118.9(1) 117.6(1) 120.1(1) 120.4(1) 119.4(1) 121.2(1) 127.2(1) 121.5(1) 117.9(1) 118.7(1) 118.1(1)
117.7 122.8 118.2 118.9 120.3 121.5 118.1 120.4 126.8 120.1 117.8 119.1 118.1
C12-O2 C12-C15 C13-C18 C13-C16 C13-C19 C14-O8 C16-C17 C20-O2 C21-O8
1.365(2) 1.393(2) 1.387(3) 1.387(2) 1.505(2) 1.366(2) 1.372(2) 1.425(3) 1.425(2)
1.355 1.401 1.393 1.399 1.506 1.357 1.384 1.413 1.412
C9-C10-C15 C12-C11-C14 O2-C12-C11 O2-C12-C15 C11-C12-C15 C16-C13-C18 C16-C13-C19 C18-C13-C19 O8-C14-C9 O8-C14-C11 C9-C14-C11 C10-C15-C12 C13-C16-C17 C3-C17-C16 C5-C18-C13
120.1(1) 119.5(1) 124.5(1) 115.3(1) 120.2(1) 117.5(1) 121.6(2) 120.9(2) 124.3(1) 114.4(1) 121.3(1) 120.1(1) 121.8(1) 120.7(2) 121.2(1)
120.1 119.2 124.1 115.6 120.2 118.4 120.3 121.3 124.3 114.5 121.1 120.1 120.9 120.4 120.9
J Mol Model (2014) 20:2526
Page 5 of 11, 2526
(a)
(b) C….H
approach is a graphical tool for visualization and understanding of intermolecular interactions. The intermolecular contacts are estimated using WingX. The chart indicates the contribution of intercontacts to the Hirshfeld surfaces. The Hirshfeld surface is a measurement of the space occupied by a given molecule in the crystal and summarizes information from all interactions and molecular contacts simultaneously [19]. The two-dimensional fingerprint plots are derived from the Hirshfeld surface, which provide a summary of the frequency of each combination of de (i.e., the distance from the surface to the nearest atom in the molecule itself) and di (i.e., distance from the surface to the nearest atom in another molecule) across the surface of a molecule. Two-dimensional fingerprint plots were generated by using the di and de pairs measured on each individual spot of the calculated Hirshfeld surface. This information shows not only the set of present interactions, but also the relative area of the surface corresponding to each interaction. Blue color corresponds to the low frequency of occurrence of (de, di) pair, while red points indicate the high frequency of the surface points with that (de, di) combination. These intercontacts are highlighted by conventional mapping of dnorm (i.e., the normalized contact distance) on molecular Hirshfeld surfaces are shown in Fig. 2. The red spots over the surface indicate the intercontacts involved in the hydrogen bonds. Furthermore, intercontacts were plotted with fingerprint plots in Fig. 3. The intercontacts C…H (Fig. 3(b)) showing presence of O…H contact with the two characteristic wings, intercontacts O…H (Fig. 3(c)) showing two narrow pointed wings provide evidence for C-H…O non-classical hydrogen [17]. The non-classical hydrogen bonds are presented in Table 3. The electrostatic potential surface shows that the regions close to the oxygen atoms have negative charge density. However, the region close to the hydrogen H9, H7, and H5 atoms present high concentration of positive charges. This region is the most provable place to occur interactions like the ones involved in packing. The Hirshfeld surface analysis, with finger plots and electrostatic potential map, reveals the intermolecular contacts and distribution of electrostatic potential of the title compound. It helps to understand the molecules packing and the crystal stabilization. Infrared spectrum
(c) O….H Fig. 3 a Fingerprint of the C18H18O3. b C…H, c O…H. The outline of the full fingerprint is shown in gray. di the closest internal distance from a given point on the Hirshfeld surface and de is the closest external contacts
The vibrational frequencies (theoretical and experimental) in the infrared range, are in good agreement, from which it was possible to characterize the main absorbent groups. The observed discrepancies are due to the fact that calculations were made for a free molecule in a vacuum, while experiments were carried out in a solid sample. The calculated vibrational frequencies for the optimized geometries and the proposed vibrational assignments as well as IR intensities are given in Table 4. The spectrum is presented in Fig. 4. It is well known
2526, Page 6 of 11 Table 3 Non-classical hydrogen bond for C18H18O3
J Mol Model (2014) 20:2526
D-H … A (Ǻ)
D-H (Ǻ)
H-A (Ǻ)
D-A (Ǻ)
D-H …A (°)
Symmetry codes
C9-H9 …O1 C7-H7 …O1 C5-H5 …O1 C21-H21 …O1 C20-H20 …O2
0.930(1) 0.930(1) 0.930(2) 0.960(2) 0.960(2)
2.528(1) 2.571(1) 2.800(1) 2.7321) 2.701(1)
3.456(2) 3.472(2) 3.588(2) 3.388(2) 3.658(2)
175.82(1) 163.26(1) 143.14(1) 126.17(2) 173.23(2)
x,-y+1/2+1,+z-1/2 x,-y+1/2+1,+z-1/2 x,-y+1/2+1,+z-1/2 x,-y+1/2+1,+z-1/2 x-1/2,-y+1/2,z
that the DFT calculations overestimate the vibrational frequencies systematically [28], and the use of a proper scaling
factor for M06-2X, equal to 0.947 [29] provides more reliable values to compare to the experimental data. The heteroaromatic structure shows the presence of CH stretching vibrations in the 3000–3175 cm−1 range, which is the characteristic region for the identification of CH stretching vibrations [30]. In this region, the bands are not affected appreciably by the nature of the substituents. The ring CC stretching vibrations occur in the region 1321–1686 cm−1 [30, 31]. The CC stretching modes for the R1 and R2 rings are observed at 1527 and 1686 cm−1. The ring stretching vibrations, which are highly characteristic of the aromatic ring itself, are very important in the spectrum of benzene and its derivatives. The prominent band between 1625 and 1650 cm−1 is characteristic of the α, β-unsaturated carbonyl group of a chalcone. In the present work, the calculated values are 1701 cm−1 for unscaled and 1611 cm−1 for scaled frequency. The band in 1792 cm−1 is characteristic of the C=O stretching mode [30]. Frontier molecular orbitals
Fig. 4 The experimental (a), theoretical (b), and overlap (c) of infrared spectrum of C18H18O3
The highest occupied molecular orbital (HOMO) and the lowest unoccupied molecular orbital (LUMO) energies are directly related to the ability to donate and accept electrons. The LUMO energy is directly related with the molecular electron affinity and characterizes the susceptibility of the molecule toward an attack by a nucleophile. Both the HOMO and the LUMO energies are important in radical reactions [32]. The energy difference between HOMO and LUMO is an important chemical stability index [33]. A large HOMO-LUMO gap implies high stability with respect to chemical reaction [34]. They are also used to describe chemical softness and hardness. Figure 5 shows a graphical representation of the distribution and energy levels for HOMO and LUMO orbitals computed at the M06-2X/6-311+G(d,p) level of theory for (E)3-(3,5-dimethoxyphenyl)-1-(4-methylphenyl)prop-2-en-1one compound. The plot of the frontier molecular orbital helps us to have a better understanding of the nature of the chemical bond scheme [35]. As can be seen in Fig. 5, the HOMO (−8.7828 eV) orbital is localized entirely on the R1 ring (dimethoxyphenyl group), while the LUMO (−6.4783 eV) orbital is spread out throughout the molecule, except for the
J Mol Model (2014) 20:2526 Table 4 Mode no.
Page 7 of 11, 2526
Vibrational assignments, experimental and calculated wave numbers in cm−1 of C18H18O3 at M062X/6-311+G(d,p) Unscaled freq.
Scaled freq.a
IInfrared
1 2 3 4 5 6 7 8 9 10 11 12 13 14 15 16 17
10 32 40 58 84 91 97 102 109 167 170 204 211 215 244 273 282
9 30 38 54 80 86 91 96 104 158 161 193 199 204 231 259 267
18 19 20 21 22 23 24 25 26 27 28 29 30 31 32 33 34 35 36
290 291 330 359 382 414 439 463 491 532 550 584 598 629 640 649 657 682 708
275 275 313 340 362 392 416 438 465 504 521 553 566 596 606 614 622 646 670
0.7 0.5 0.2 4.2 0.1 0.6 2.9 11.1 8.8 2.8 9.1 12.9 34.3 0.2 0.5 0.5 16.7 20.9 3.0
37 38 39 40 41 42 43 44 45 46 47 48 49
756 811 832 845 855 871 876 883 913 975 988 1008 1010
716 768 788 800 809 825 829 836 865 923 936 955 957
13.4 10.1 33.7 26.9 37.3 6.2 8.0 8.1 2.7 24.8 0.2 7.9 2.3
FT-IRb
IR assigments Γ CCCCR2 +ΓCCCCR1 Γ CC-CCR2 +Γ CC-CCR1 Γ CCCCR2 ΓCH3-O+ΓCCCC ΓCH3-O+ C6H6 + C7H7 Γ CH3-O8 Γ CH3-O+t CH3-C Γ CH3-O2 +t CH3-C t CH3-C ΓCH3-O8 + C6H6 + C7H7 Γ CH3-O t CH3-O2 t CH3-O8 +ΓCCC Γ CH3-O ΓCCCC+Γ CH3-O tCH3-O2 tCH3-O+ΓCCCC
0.82 0.2 0.2 0.3 1.2 5.5 0.2 2.4 1.0 0.5 1.2 1.0 0.6 1.6 6.1 1.7 1.5
472(vw)
528(w)
607(w)
739(s)
814(m)
845(w)
Γ CCCCR1 +tCH3-O2 +tCH3-O8 tCH3-O2 +tCH3-O8 Γ COC+ΓCOC r CH3 ΓCCCC+ΓCOC CCCCR2 β CCCR2 +β COCR1 β CCCR1 + CCCR2 β CCCR1 +ΓCCCCR2 Γ CCCR1 +β CCCR2 R1 deformation C15H15 + C9H9 +Γ CCR1 β CCCR2 +r C=O C15H15 + C9H9 Γ R1+R2 deformation R2 deformation R2 and R1 deformation CHR1 R2 deformation C5H5 + C17H17 + CCR2 R2 deformation+ν C13-C19 CH CHR2 + C7H7+ C6H6 C11H11 CHR2 C15H15 + C16H16 + C17H17 νC4-C3 C18H18 + C17H17 C15H15 + C16H16 + C7H7 ν C-O-C CHR1 ω CH3–C+R1 deformation ω CH3–C
2526, Page 8 of 11
J Mol Model (2014) 20:2526
Table 4 (continued) Scaled freq.a
IInfrared
Mode no.
Unscaled freq.
50 51 52
1013 1018 1027
959 964 973
0.1 5.4 31.6
53 54 55 56 57 58 59 60 61 62 63 64 65 66 67 68 69 70
1038 1067 1068 1115 1123 1142 1180 1187 1188 1206 1209 1222 1245 1251 1257 1279 1321 1327
983 1010 1012 1056 1064 1082 1118 1124 1125 1142 1145 1157 1179 1185 1190 1211 1251 1257
32.1 19.8 87.1 36.9 22.0 4.7 1.0 1.0 4.2 83.1 49.0 15.9 44.3 181.1 147.7 8.8 519.0 6.9
71 72 73 74 75 76 77 78 79 80 81 82 83 84 85 86 87 88 89
1339 1342 1360 1419 1421 1448 1474 1490 1493 1504 1504 1508 1509 1513 1520 1527 1560 1649 1668
1268 1271 1288 1343 1345 1371 1396 1411 1414 1424 1425 1428 1429 1433 1439 1446 1477 1562 1580
4.5 2.7 104.0 2.6 81.5 13.0 50.4 11.0 7.9 14.6 10.9 41.5 45.9 15.0 39.0 44.1 0.9 4.9 279.1
90 91 92 93 94 95 96 97 98
1674 1686 1701 1792 3033 3035 3063 3101 3101
1585 1596 1611 1697 2872 2874 2900 2937 2937
313.7 75.8 273.3 168.4 41.6 32.4 19.0 1.0 47.4
FT-IRb
IR assigments CHR2 C16H16 + C17H17 C6H6 + C7H7
979(m) 1016(w) 1038(m)
1171(s)
1221(vs)
1280(vs)
1341(m) 1512(s) 1556(vs) 1576(vs) 1611(vs) 1649(s) 2924(m)
2956(m)
R2 deformation ω CH3 – C ν C7-C4 ν C20-O2 +β CHR1 ν C21-O8 +β CHR1 β CHR2 ω CH3 – O2 ω CH3 – O8 ν C-O+ν C10-C6 ν C-O+β C9H9+ β C11H11 β CHR1 ω CH3 – O2 +ω CH3 – O8 ν C13-C19+ β C6H6 +β C7H7 β C6H6+ β C7H7 +β C9H9 +β CHR2 ω CH3–O2 +ω CH3–O8 β CHR1 β C4-C3+ β C6H6 +β C7H7 ν CCR2 +β C7H7 +β C6H6 ν CCR2 ν CCR1+ ν CCR2 β CHR2 +β C6H6 +β C7H7 ω CH3 – C ν CCR1 +ν C10- C6 +ω CH3-O ν CCR2 +β CHR2 ω CH3 ω CH3 ν sym CH3 ρ CH3 – C ρ CH3 – O2 ρ CH3 ρ CH3 ρ CH3 ρ CH3 – O2,O8 β CCR1 β CHR2 β CHR2 β CCR1 β CCR1 β CCR2 ν C=C ν C=O ν sym CH3 of CH3-O2 ν sym CH3 of CH3-O8 ν sym CH3 of CH3-C ν asym CH2 of CH3 – O2 and CH3 – O2 ν asym CH2 of CH3 – O2 and CH3 – O2
J Mol Model (2014) 20:2526
Page 9 of 11, 2526
Table 4 (continued) Mode no.
Unscaled freq.
Scaled freq.a
IInfrared
FT-IRb
99 100 101
3129 3146 3161
2963 2980 2994
6.8 9.1 15.3
ν asym CH2 of CH3 – C ν asym CH3 –C ν asym CH3–O2
102 103 104 105 106 107 108 109 110 111
3163 3174 3175 3179 3196 3203 3209 3212 3224 3233
2996 3005 3007 3010 3027 3033 3039 3042 3053 3061
0.1 16.5 8.8 8.9 1.7 0.1 3.1 5.9 0.5 3.7
ν C6H6 ν asym CH3 – O8 ν C16H16 ωC5H5 +ω C18H18 ν C5H5 +ν C7H7 +ν C18H18 ν C15H15 ν C17H17 ν C5H5 +ν C7H7 ν C11H11 ν C9H9 +ν C7H7
3215(m)
IR assigments
R1 and R2; first and second ring, ν; stretching, β; in plane bending, ; out of plane bending, ρ; scissoring, Γ; torsion, ω; wagging, r; rocking, t; twisting IR intensities, [IInfrared (K mmol−1)] a
Scale factor 0.947
b
Intensity: vs; very strong, s; strong, m; medium, w; weak, vw; very weak
H3CO and CH3 groups. These orbitals are π-bonding and πantibonding character, respectively. The high gap energy (2.3045 eV) indicate that this compound has high chemical stability and high excitation energies.
The hardness (η) of a molecule is given by [32]: η¼
E LUMO −E HOMO ; 2
where ELUMO and EHOMO are the energies of the LUMO and HOMO orbitals, respectively. The chemical hardness is directly correlated to the chemical stability. The molecules having a small or large energy gap are known as soft or hard molecules, respectively. The hard molecules are not more polarizable than the soft ones because they need a big energy to excitation [36]. The value of the energy gap between the HOMO and LUMO is 2.3045 eV and the value of hardness is
Gap = 2.3045 eV
Fig. 5 The HOMO and LUMO distribution of C18H18O3 by using M062X. Gap 2.3035 eV
Fig. 6 Potential electrostatic surface calculated at M062X/6-311+ G*.Electrostatic potential maps calculated on the Connolly surfaces of the chalcone derivatives from sub negative electrostatic potential regions are represented in red (high electronic density) while positive electrostatic potential areas are shown in dark blue (low electronic density)
2526, Page 10 of 11
1 . 1 5 2 2 e V. C o m p a r e d t o t h e ( E ) - 4 - m e t h o x y - 2 [(ptolylimino)methyl]phenol molecule [36], which is a Schiff based compound (1.842 eV), the studied molecule presents a smaller hardness.
J Mol Model (2014) 20:2526 Acknowledgments The authors would like to acknowledge the following Brazilian agencies for financial support: Conselho Nacional de Desenvolvimento Científico e Tecnológico (CNPq) and Fundação de Amparo Pesquisa do Estado de Goiás (FAPEG).
Electrostatic potential surface The MEP is associated to the electronic density and it is an important property to explain sites of reactivity as well as their interactions [37]. The negative MEP corresponds to the areas of high electron density; which are in the vicinity of the carbonyl and ethoxyl oxygen atoms (red color in Fig. 6). Thus, the MEP is also a useful property to provide the specific information about the processes of interaction of one molecule with another. Electric charges in the molecule are the driving force for electrostatic interactions [38]. The electrostatic potential surface plotted in Fig. 6 shows regions that are well distinguished. Close to the oxygen atoms there is a negative charge concentration, although close to the hydrogen atoms there is a high concentration of positive charges. This behavior contributes to link the molecules in the packing environment [38].
Conclusions The compound C18H18O3 was crystallized in the centrosymmetric space group P21/c, and the DFT analysis of optimized structural parameters showed good agreement to those observed in X-ray diffraction. The molecules are connected by C-H…O hydrogen bonds and the short contacts of the type π…π and C—O…π help the crystal packing stabilization. The Hirshfeld surface analysis with finger plots and electrostatic potential map reveals the percentage of intermolecular contacts and distribution of electrostatic potential. This diagram helps to understand the reactive behavior of the compounds. The vibrational FT-IR spectrum of molecule was recorded and assigned with the aid of the experimental and computed vibrational wavenumbers. The comparison of the predicted bands with the experimental results shows an acceptable general agreement. The frontier molecular orbital’s and potential electrostatic surface calculated are parameters that provide evidence of the lock and key mechanism on any chemical or biological process that could be of interest. Also, they showed how aromatic rings are regions more likely to interact with nearest neighbor molecule. In summary, a structural characterization of title compound was given in the present paper showing that the M06-2X hybrid density functional are able to supply a variety of very reliable molecular properties.
References 1. Rao YK, Fang SH, Tzeng YM (2009) Synthesis and biological evaluation of 3′,4′,5′-trimethoxychalcone analogues as inhibitors of nitric oxide production and tumor cell proliferation. Bioorg Med Chem 17(23):7909–7914 2. Wu J et al. (2012) Synthesis and crystal structure of chalcones as well as on cytotoxicity and antibacterial properties. Med Chem Res 21(4): 444–452 3. Juvale K, Pape VFS, Wiese M (2012) Investigation of chalcones and benzochalcones as inhibitors of breast cancer resistance protein. Bioorg Med Chem 20:346–355 4. Liu M, Wilairat P, Croft SL, Tand ALC, Goa ML (2003) Bioorg Med Chem 11:2729–2738 5. Trivedi JC, Bariwal JB, Upadhyay KD, Naliapara YT, Joshi SK, Pannecouque CC, Clercqd ED, Shah AK (2007) Improved and rapid synthesis of new coumarinyl chalcona derivates and their antiviral activity. Tetrahedron Lett 48:8472–8474 6. Bandgar BP, Gawande SS, Bodade RG, Totre JV, Khobragade CN (2010) Synthesis and biological evaluation of simple methoxylatedchalcones as anticancer, anti-inflammatory and antioxidant agents. Bioorg Med Chem 18:1364–1370 7. Katsori AM, Hadjipavlou-Litina D (2011) Recent progress in therapeutic applications of chalcones. Exp Opin Ther Patents 21:1575– 1596. doi:10.1517/13543776.2011.596529 8. Edward HK, Li D (2008) Drug-like properties: concepts, structure design and methods. Elsevier, San Diego 9. Basavoju S, Boström D, Velaga S (2008) Indomethacin–saccharin cocrystal: design, synthesis and preliminary pharmaceutical characterization. Pharm Res 25(3):530–541 10. Silverman RB (1992) The organic chemistry of drug design and drug action. Elsevier, San Diego 11. Enraf-Nonius (1993) CAD-4 = PC 1.2 Enraf-Nonius. Delft, Netherlands 12. Sheldrick GM (1990) SHELXS-97 Program for the solution of crystal structures. University of Gottingen, Germany 13. Enraf-Nonius (2000) COLLECT Nonius BV. Delft, Netherlands 14. Otwinowski Z, Minor W (1997) Processing of X-ray diffraction data collected in oscillation mode. In: Carter CWJ (ed) Methods in enzymology, vol 287. Academic, San Diego, pp 307–326 15. Farrugia L (1999) WinGX suite for small-molecule single-crystal crystallography. J Appl Crystallogr 32(4):837–838 16. Farrugia L (1997) ORTEP-3 for Windows - a version of ORTEP-III with a Graphical User Interface (GUI). J Appl Crystallogr 30:565– 1997 17. Macrae CF et al (2006) Mercury: visualization and analysis of crystal structures. J Appl Crystallogr 39(3):453–457 18. Spackman MA, McKinnon JJ (2002) Fingerprinting intermolecular interactions in molecular crystals. Cryst Eng Comm 4(66):378–392 19. McKinnon JJ, Spackman MA, Mitchell AS (2004) Novel tools for visualizing and exploring intermolecular interactions in molecular crystals. Acta Crystallogr B 60(6):627–668 20. Wolff SK et al (2007) Crystal Explorer 2.1. University of Western Australia, Perth, Australia 21. Frisch MJ et al. (2004) Gaussian 03 Revision C02. Gaussian Inc, Wallingford, CT 22. Frisch MJ et al (2009) Gaussian Inc. Wallingford, CT
J Mol Model (2014) 20:2526 23. Zhao Y, Truhlar DG (2008) The M06 suite of density functionals for main group thermochemistry, thermochemical kinetics, noncovalent interactions, excited states, and transition elements: two new functionals and systematic testing of four M06class functionals and 12 other functionals. Theor Chem Account 120:215–241 24. GaussView, Version 5, Dennington R, Keith T, Millam J (2009) Semichem Inc, Shawnee Mission 25. Krishnan R, Binkley JS, Seeger R, Pople JA (1980) J Chem Phys 72: 650 26. Frisch MJ, Pople AJ, Binkley JS (1984) J Chem Phys 80:3265 27. Politzer P, Murray JS (2002) Theor Chem Acc 108:134 28. Scott AP, Radom L (1996) J Phys Chem 100:16503–16513 29. Russell D. Johnson III, (2013), NIST computational chemistry comparison and benchmark database. IOP Publishing web. http://cccbdb.nist.gov/vibscale2.asp?method=58&basis=1. Accessed 26 Mar 2014 30. Silverstein M, Basseler GC, Morill C (1981) Spectrometric identification of organic compounds. Wiley, New York
Page 11 of 11, 2526 31. Lin-Vien D, Colthup NB, Fateley WG, Grasselli JG (1991) The handbook of infrared and Raman characteristic frequencies of organic molecules. Academic, Boston 32. Pearson RG (1986) Absolute electronegativity and hardness correlated with molecular orbital theory. Proc Natl Acad Sci U S A 83:8440–8441 33. Sklenar H, Jager J (1979) Molecular structure-biological activity relationships on the basis of quantum-chemical calculations. Int J Quantum Chem 26:467–484 34. Zhow Z, Parr RG (1990) Activation hardness: New index for describing the orientation of electrophilic aromatic substitution. J Am Chem Soc 112:5720–5724 35. Fukui K (1982) Science 218:747–754 36. Kosar B, Albayrak C (2011) Spectrochim Acta A 78:160–167 37. Singh UC, Kollman PA (1984) An approach to computing electrostatic charges for molecules. J Comput Chem 5(2):129–145 38. Breneman CM, Wiberg KB (1990) Determining atom-centered monopoles from molecular electrostatic potentials. The need for high sampling density in formamide conformational analysis. J Comput Chem 11(3):361–373