ISSN 1392–1320 MATERIALS SCIENCE (MEDŽIAGOTYRA). Vol. 19, No. 4. 2013
Synthesis, Characterization and Properties of CeO2-doped TiO2 Composite Nanocrystals Oman ZUAS ∗, Nuryatini HAMIM Process Technology and Catalysis Division, Research Centre for Chemistry (RCC), Indonesian Institute of Sciences (LIPI), Kawasan PUSPIPTEK Serpong, 15314, Tangerang, Banten, Indonesia http://dx.doi.org/10.5755/j01.ms.19.4.2732 Received 29 October 2012; accepted 10 March 2013 Pure TiO2 and CeO2-doped TiO2 (3 % CeO2-97 %TiO2) composite nanocrystals were synthesized via co-precipitation method and characterized using TGA, XRD, FTIR, DR-UV-vis and TEM. The XRD data revealed that the phase structure of the synthesized samples was mainly in pure anatase having crystallite size in the range of 7 nm – 11 nm. Spherical shapes with moderate aggregation of the crystal particles were observed under the TEM observation. The presence of the CeO2 at TiO2 site has not only affected morphologically but also induced the electronic property of the TiO2 by lowering the band gap energy from 3.29 eV (Eg-Ti) to 3.15 eV (Eg-CeTi). Performance evaluation of the synthesized samples showed that both samples have a strong adsorption capacity toward Congo red (CR) dye in aqueous solution at room temperature experiment, where the capacity of the CeTi was higher than the Ti sample. Based on DRUV data, the synthesized samples obtained in this study may also become promising catalysts for photo-assisted removal of synthetic dye in aqueous solution. Keywords: TiO2, CeO2, metal oxide, nanocrystal, synthetic dye.
1. INTRODUCTION∗
pollutant, nanostructured TiO2-based materials offer advantages and have been previously reported as materials with better properties like adsorption capacity and selectivity [17, 20]. In this study, pure TiO2 and CeO2-doped TiO2 were synthesized by co-precipitation method. The structural and morphology of the synthesized samples were characterized using TGA, XRD, DR-UV-vis, FTIR and TEM, while the activity was evaluated for their adsorption performance for CR dye in aqueous solution.
Development of semiconductor nanomaterials having tailorable function has attracted much attention in the area for solving energy and environmental issues. Among the important transition metal semiconductors, titanium dioxide (TiO2) is probably one of the most widely studied in heterogeneous catalysis, in solar cell, in coating technology and in electrical devices [1], due to its tremendous properties including inexpensive material, high chemical stability, high mechanical strength, photo activated material, and environmentally friendly [2 – 4]. There has been a concrete effort to enhance the functionality properties of TiO2 by composing with other transition metal semiconductors such as Al2O3 [5], CeO2 [6], CuO [7], Fe2O3 [8], SnO2 [9], SiO2 [5, 10], WO3 [11], ZnO [12] and ZrO2 [5, 10]. The beneficial effects of such metal oxide semiconductors in relation with their existence at TiO2 site is evidenced by increasing in the surface area, by decreasing in particle size, and positive change in optical and electrical properties [5, 9, 13 – 16]. In term of nano dimensional particle and high surface area of pure TiO2 and metal oxide-TiO2 nanocomposites, these materials have the possibility of being applied as an adsorbent for removal of pollutants. Generally speaking, adsorbents with nano-scale in particle diameter would have high surface area and determine their adsorption capacity [17 – 19], which further allows for more adsorbate to attach on the the surface of the adsorbent [20, 21]. To overcome the drawback regarding the limitations of the TiO2 particle with micro-scale in diameter, such as limited surface-to-volume ratio which determines their adsorption capacity for low concentration of target
2. EXPERIMENTAL DETAILS 2.1. Materials All chemicals were analytic grade and used as received without further purification. Titanium tetrachloride (TiCl4, > 99 %, Merck-Germany), cerium (III) nitrate hexahydrate (Ce(NO3)3.6H2O, 99.9 %, Merck-Germany), aqueous ammonia solution (NH3.H2O, 25 %, Merck-Germany), sodium hydroxide (NaOH, 99.8 %, Merck-Germany), N-Cetyl-N,N,N-trimethylammonium bromide (CTAB, 98 %, Merck-Germany), Congo red dye (C.I. 22120, CAS No. 573-58-0, 97 %, Sigma-Aldrich, Germany). Purified water was produced using Millipore purified water system.
2.2. Methods Synthesis of pure TiO2 and CeO2-doped TiO2. Pure TiO2 (denoted as Ti) and composite of ceria-doped titania (3 wt% of CeO2 – 97 wt% of TiO2, denoted as CeTi) were synthesized following the method in our previous work with modification [22]. Typically, an appropriate amount of Ce(NO3)3·6H2O, to give 3 %wt of CeO2 in the final product, was added into CTAB:TiCl4 mixture solutions (0.2 molar ratio). The mixture was then precipitated using an aqueous ammonia solution (NH3·H2O, 25 %) under
∗
Corresponding author. Tel.: +62-21-7560929; fax.: +62-21-7560549. E-mail address:
[email protected] (O Zuas)
443
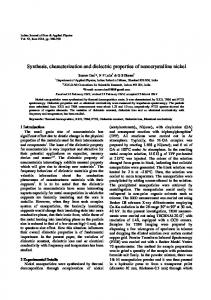
existence of physical adsorption or chemically bonded hydroxyl groups. In general, the thermal decomposition of both precursors occurred in three main loss stages with the total mass loss of about 65.33 %. The first stage occurred in temperature ranging from 25 ºC to 105 ºC with mass loss of about 46.29 %. This stage was attributed to the evaporation of adsorbed water. The second stage is observed from TG curve at temperature range of 105 ºC – 450 ºC which was attributed to decomposition of CTAB template and dehydroxylation of the surface, while both pure Ti and CeTi oxide were formed. The third stage occurred at temperature above 450 ºC and little further mass loss in the TG curve is observed which may be due to removal of little residual CTAB template.
vigorous stirring until the pH 10 of the solution was reached. The colloidal solution was aged at 55 ºC – 60 ºC for 6 h under stirring. After that, the colloidal solution was centrifuged at 8000 rpm for 10 min to remove the supernatant. Wet solid material obtained was then washed thoroughly with distilled water for several times until no chloride ions could be detected in the filtrate (visual observations using silver nitrate as a test reagent). The wet solid material was dried at 100 ºC for 12 h to produce dry solid materials. Dry solid materials were then calcined at 500 ºC for 4 h in open air in a tube box muffle furnace to produce CeTi composite nanocrystals. The pure TiO2 (denoted as pure Ti) was also synthesized with the same procedure without addition of Ce precursor according to notes above in this chapter. Sample characterization. The X-ray diffraction (XRD) patterns were obtained at room temperature on a Philips-Type PW1710 X-ray diffractometer with Cu (k = 1.5406 Å) irradiation and scanned 2θ in the range of 10° – 80° at a scanning speed of 1.2°/min. The diffuse reflectance-UV visible (DR-UV-Vis) spectra were recorded on a Shimadzu UV2450 spectrophotometer under ambient temperature and BaSO4 was used as a reference. Thermogravimetric analysis (TGA) was conducted on a TGA DuPont 951 in the presence of static air at a heating rate of 100oC/min from 25 ºC to 900 ºC. Surface functional groups were examined using a FTIR-2000 Perkin Elmer from the scanning range of 4000 cm−1 – 500 cm−1. Surface morphology of the sample was observed from electron micrographs obtained with a Philips CM30 Transmission Electron Microscope (TEM) operated at 200 kV. Dye adsorption testing. The activity performance of the synthesized samples was tested for their ability for removing textile dye in aqueous solution. Congo red (CR), a carcinogenic textile dye, was used as the model of organic pollutant. The adsorption experiment of CR dye was conducted in 15 ml capped glass tubes containing 5 ml of CR solution (15 mg/g) and 15 mg of synthesized composite nanocrystals. The sample-containing glass tubes were then placed in a Certomat WR-Braun Biotech International temperature-controlled water bath shaker with a constant agitation speed (120 rpm) and 25 ºC ±1 ºC. After a certain period of time, the glass tubes were taken. The CR filtrate was separated from the solid material. Absorbance of the filtrate was then measured using a U-3501 Shimadzu UV-Vis-NIR spectrophotometer at wavelength maximum of the CR (λmax = 500 nm). The concentration of the CR that remains in the sample solution was calculated from a calibration curve. The percentage of CR adsorption expressed as follows: % Adsorption = ((C0 – Ct)/C0) × 100 % (1) where C0 is the initial concentration of CR dye, mg/l; Ct is the concentration of CR dye remaining at time t, mg/l.
100 90
Mass %
80 70 CeTi
60 50
Ti
40 30
0
100
200
300
400
500
600
700
800
900
Temperature (o C)
Fig. 1. TGA pattern of the dried solid materials of the composite nanocrystal precursors
The XRD diffraction patterns of the synthesized composite nanocrystals are shown in Fig. 2. The diffraction peaks (2θ) of the synthesized samples at about 25°, 38°, 48°, 54°, 55°, 63°, 69°, 70° and 76° can be ascribed to the reflection of (101), (004), (200), (105), (116), (211), (213), (204) and (116) planes of the TiO2, respectively, which are consistent with the standard JCPDS values of anatase TiO2 (JCPDS Card No. 21-1272) [23-25]. The XRD patterns of both samples exhibit sharp and well defined peaks for anatase TiO2, indicating that the materials are present in a good crystallinity phase. No rutile peaks can be observed in the XRD spectra of both synthesized samples, indicating that the temperature used in the samples calcination suitable for the formation of anatase phase. In addition, no peaks of CeO2 in the synthesized CeTi spectrum is observed, implying that the very low CeO2 precursor added during synthesis process may be the reason, or the metal has been well-dispersed in the TiO2 host lattices as a small cluster [24]. The average crystallite size of the synthesized samples were calculated from the full-width at half-maximum (FWHM) of anatase (101) reflection (Fig. 2) using Scherrer’s formula [26], D = k λ / β cosθ , (2) where D is the crystallite size, k is a constant (= 0.9 assuming that the particles are spherical), λ is the the wavelength of the X-rays, β is the FWHM, and θ is the diffraction angle, in radians. The average crystallite size of pure Ti and CeTi samples was found to be 11 nm and
3. RESULTS AND DISCUSSION 3.1. Characterization The TGA pattern of the dried solids of the composite nanocrystal precursors are given in Fig. 1. As shown in Fig. 1, the main mass loss occurs at temperature below 450 ºC for both composite precursors, indicating the 444
reflectance spectra obtained were transformed into KubelkaMunk function (F(R)), F(R) = (1 – R)2 / 2R , (3) where R is the reflectance value of the sample. Moreover, the absorption edge values of the samples were determined by plotting between the K-M function and wavelength as shown in Fig. 4. After that, the estimated band gap energy (Eg) of the samples was generated by substituting the obtained absorption edge (λ) values into the formula below [30]: Eg (eV) = 1236 / λ (nm) . (4) As it can be seen from Fig. 4, the absorption edges of CeTi (392 nm) shifted to higher wavelength (red shift) compared to the absorption edges of Ti (374 nm) as related to change of band gap (Eg) due to the presence of Ce in TiO2 host lattices. The Eg value obtained for CeTi and pure Ti are 3.15 eV and 3.29 eV, respectively. These Eg values could be important for application of the synthesized sample in photo-assisted studies.
F(R)
7 nm, respectively. Difference between crystallite size of pure Ti and CeTi samples is 4 nm. Decreasing in the crystallite size might be ascribed as result of a broadening effect due to incorporation of CeO2 into TiO2 matrix. In a word, lowering the intensity and broadening the width of the anatase (101) reflection led to decrease the calculated crystallite size correspondingly. From insert of Fig. 2, it can also be observed that un-shifted the peak (101) reflection of anatase crystal of the CeTi compared with pure Ti sample (in insert of Fig. 2) indicates that CeO2 did not perturb the TiO2 lattices. The CeO2 concentration is rather low, therefore, it is possible that TiO2 lattice distortions, resulting in XRD peak shift, are not visible in the powder XRD patterns.
Fig. 2. XRD pattern of the synthesized composite nanocrystal
Ti
CeTi 392 nm
Fig. 3 represents the FTIR spectra of the synthesized composites. As it can be seen in Fig. 3, the IR band at 3000 – 3200 cm−1 corresponds to the stretching vibration of O–H bond from hydroxyl [27]. The IR peak at about 1630 cm-1 is assigned to the O–H bending of molecularly physisorbed water [28]. A characteristic band with strong and wide absorption at lower energy region (