Electronic Supplementary Material (ESI) for Chemical Communications. This journal is © The Royal Society of Chemistry 2015
Synthesis of double-clickable functionalised graphene oxide for biological applications Kuo-Ching Mei,a Noelia Rubio,a Pedro M. Costa,a Houmam Kafa,a Vincenzo Abbate,a Frederic Festy,b Sukhvinder S. Bansal,a Robert C. Hider,a and Khuloud T. Al-Jamala* a
Institute of Pharmaceutical Science, King’s College London, Franklin-Wilkins Building, 150
Stamford Street, London SE1 9NH, UK. b
Biomaterials and Biomimetics Department, King’s College London Dental Institute, London SE1
9RT, UK.
Keywords: graphene; click chemistry; nanomedicine; drug delivery; peptide Email:
[email protected]
1
Supplementary Information
Material Materials for Chemical Experiments 1-Ethyl-3-(3-dimethylaminopropyl)carbodiimide
(EDC,
cat:
ANA29855)
was
obtained from Bioscience (UK). Graphite powder (cat: SP-1, batch: 04100, lot: 011705) was purchased from Bay Carbon, Inc. (USA). Silicone oil (cat: A122718, for oil baths, usable ranges from 40 °C to + 200 °C) was from Alfa Aesar®(UK). Filter paper (cat: 1001240) was from GE Whatman™ (UK). Ninhydrin (cat: sc203162) was from Santa Cruz Biotechnology (USA). H2O2 (cat: 202460010) and HNO3 (cat: 1244660011) were purchased from Acros Organics (USA). Acetyl chloride (cat: 607011-00-5) and sulfuryl chloride (SO2Cl2) (cat: 016016006) were purchased from Merck/VWR International (UK). Deuterium oxide (cat: 1133660010), Fluoropore™ membrane, PTFE, hydrophobic, 0.22 µm (cat: FGLP04700), Isopore™ membrane, polycarbonate, hydrophilic, 0.22 µm (cat: GTTP04700) were ordered from Merck Millipore (UK). Acetone (cat: A/0600/17), dichloromethane (cat: D/1852/17), chloroform (cat: C/4960/17), and methanol (cat: M/4000/17) were purchased from Fisher Scientific (UK). HCl (cat: 258148), NaNO3 (cat: 221341), KMnO4 (cat: 60459), P2O5 (cat: 214701), NaN3 (cat: S2002), PPh3 (cat: 93092), KCN (cat: 60180), meta-chloroperoxybenzoic acid ≤ 77% (mCPBA, cat: 273031), 3-(trimethylsilyl)propargyl alcohol (TMS-protected propargyl alcohol, cat: 318558), 4-(Dimethylamino)pyridine (DMAP, cat: 522805), chloroformd (cat: 151823), imidazole (cat: 12399) and phenol (cat: 242322) were all obtained from Sigma-Aldrich (UK). Polyoxyethylene-bis-amine (NH2-PEG3.5KDa-NH2) was purchased from JENKEM Technology (USA).
Materials for Peptide Synthesis Fmoc-Lys(Dde)-OH Asn(Trt)-OH
(cat#852057),
(cat#852044),
Fmoc-Ser(tBu)-OH
Fmoc-Ile-OH
(cat#852019),
(cat#852010),
FMOC-
Fmoc-Phe-OH
(cat#852016), Fmoc-Glu(OtBu)-OH (cat#852009), Fmoc-Leu-OH (cat#852011), Fmoc-Thr(tBu)-OH
(cat#852000),
Fmoc-Tyr(tBu)-OH
(cat#852020),
Fmoc-
2
Arg(Pbf)-OH (cat#852001),
(cat#852067),
Fmoc-Cys(Trt)-OH
Fmoc-Lys(Boc)-OH
(cat#852008),
(cat#852012),
Fmoc-Gly-OH
Fmoc-L-propargylglycine
(cat#852360), Triisopropylsilane (cat#841359), NovaSyn®TGR resin (cat#855009) were purchased from Millipore (UK). N,N-Dimethylformamide (cat#D119-1) was purchased from ThermoFisher Scientific (UK). Phenol (cat#W322318), N,NDimethylformamide
(cat#227056),
2,3,5-Collidine
(cat#513261),
O-(6-
Chlorobenzotriazol-1-yl)-N,N,N ′ ,N ′ -tetramethyluronium hexafluorophosphate (cat#04936), Piperidine (cat#104094), Thioanisole (cat#88470), and 2,2 ′ (Ethylenedioxy)diethanethiol (cat#465178) were all obtained from Sigma-Aldrich (UK).
Materials for Biology Experiments Fetal bovine serum (FBS) was obtained from First-Link, UK Ltd. Phosphate Buffered Saline (PBS) (10X, pH 7.4), Dulbecco’s Modified Eagle Medium (DMEM), Minimum Essential Medium/HEPES, Penicillin-Streptomycin 100X, 0.05 % TrypsinEDTA (1X) with Phenol Red, GlutaMAX™ Supplement were obtained from Invitrogen, Life Sciences (UK). CytoTox 96® Non-Radioactive Cytotoxicity Assay was obtained from Promega Corporation (UK).
Methods Preparation of GO by modified Hummer’s method The modified Hummer’s method reported by Ali-Boucetta et al.1 was used initially to prepare GO for comparison only. In brief, graphite powder (300 mg) and sodium nitrate powder (NaNO3, 150 mg) were dry-mixed in a 250 mL round bottom flask. Sulfuric acid (H2SO4 (96 - 98 %, ~ 7 mL) was added and the mixture was kept stirring at 0 °C on an ice bath. Potassium permanganate powder (KMnO4, 900 mg) was added slowly (portion-wise) to the suspension. The addition rate was carefully controlled so that the temperature of the suspension was kept below 20 °C then stirred on an ice bath (0 - 10 °C) for 10 minutes. The ice bath was then removed and replaced by a water bath to allow the temperature to rise to 35 ± 3 °C, which was maintained for at least 30 minutes. Deionised water (DI H2O) (14 mL) was then added slowly 3
into the pasty mixture. The temperature started to increase to ~ 98 °C with the appearance of a violet vapour. The mixture was kept stirring for 30 minutes then diluted with an additional 42 mL of DI H2O. To stop the reaction, hydrogen peroxide (H2O2) aqueous solution (3 %, 50 mL) was added into the mixture and kept stirring for 10 minutes. H2O2 reduces the residual manganese dioxide (MnO2) and permanganate (MnO) forming a brown suspension. The warm brown suspension was centrifuged at 3214 × g (3900 rpm) for 5 minutes (5810R, Eppendorf® , Germany). The supernatant was removed and the pellet was re-suspended in warm DI H2O. The centrifugation and washing steps were repeated several times until the pH of the supernatant became neutral. The loosely packed GO flakes from the upper layer of the pellet were collected and re-suspended into water by gentle shaking. A yellow-brown GO suspension was produced. The concentration (w/v) of GO in the sample was determined by thermogravimetric analysis (TGA).
Preparation of GO by modified Kovtyukhova-Hummer’s method Modified Hummer’s method reported by Kovtyukhova et al. was adapted with some modification.2 Steps involved in preparation of GO are described in details below and schematically summarised in Scheme S1. (i) Pre-oxidation of graphite: graphite powder (4 g), potassium persulfate (K2S2O8, 2 g) powder, and phosphorus pentoxide (P2O5, 2 g) were dry-mixed in a 250 mL round bottom flask followed by the addition of sulfuric acid (H2SO4, 96 - 98%, 10 mL). The mixture was refluxed at 80 °C for 6 hr. The mixture was left to cool down to room temperature then diluted in DI H2O (volume was not critical). A Millipore® All-Glass 47 mm Vacuum Filter Unit with hydrophilic polycarbonate Isopore™ membrane (0.22 μm) was then used to wash the mixture until the filtrate became neutral. The filter cake was oven dried at 40 °C for overnight affording a black-grey powder. (ii) Low temperature stage: sodium nitrate powder (NaNO3, 4 g) and dried preoxidised graphite powder (~ 4 g) and was dry-mixed in a 500 mL round bottom flask. Sulfuric acid (H2SO4, 96 - 98%, ~ 100 mL) was added and the mixture was kept stirring at 0 °C on an ice bath. When the powders were fully dispersed, potassium 4
permanganate powder (KMnO4, 12 g) was added slowly to the suspension. The addition rate was carefully controlled so that the temperature of the suspension was kept below 20 °C. After the addition of KMnO4 was complete, the suspension was stirred on an ice bath (0 - 10°C) for an additional 10 minutes. (iii) Medium temperature stage: The ice bath was removed and replaced with a water bath to allow the temperature to rise gradually to 35 ± 3 °C. The temperature was maintained for at least 2 hr until the dispersion became a brown pasty mixture. The mixture was then heated to 60 °C. (iv) High temperature stage: When the temperature reached 60 °C, 50 mL of DI H2O was added to the pasty mixture and stirred for 5 minutes. The temperature of the oil bath was then set to 80 °C followed by the addition of 50 mL of DI H2O. When the oil bath temperature reached 80 °C, 80 mL of DI H2O was added to the mixture. A white vapour was generated. When the water addition was complete, the oil bath temperature was maintained above 80°C (temperature fluctuated between 80-95°C) and kept stirring for another 30 minutes. Hydrogen peroxide (H2O2) aqueous solution (35 %, 10 mL) was added to the mixture then kept stirring for 30 minutes at 80 °C to stop the reaction. (v) Washing and purification: The warm brown suspension from the previous step was transferred into 10 × 50 mL conical-bottom centrifuge tubes and centrifuged at 3,214 × g (3900 rpm) for 2 minutes. The supernatant was removed and the pellets were resuspended in 1N HCl using a spatula with agitation. The centrifugation and washing steps were repeated several times with 1N HCl (1L) followed by 1N NaOH (0.5 ~ 1 L). The washing and centrifugation steps were monitored by observing the colour of the supernatant. The colour changed from yellow-green (early HCl washing stage), nearly transparent (late HCl washing stage), light brown (early NaOH washing stage) and finally to dark brown when NaOH washing was stopped. The pellets were resuspended in DI H2O. Washing and centrifugation steps were repeated twice. The pellets were finally resuspended in water (50 mL/tube) and bath sonicated for 1 hr (USC300TH, VWR, Belgium). The sonicated mixture was centrifuged once at 3,214 × g (3900 rpm) for 2 minutes. GO suspension was obtained by strongly hand- shaking the centrifuge tubes and the supernatant was collected. Oxidised-graphite remained as pellet no matter how hard the shaking was. The collected supernatant was then diluted 5
with DI H2O (volume was not critical) forming a dark-brown GO suspension. The final concentration of GO in the dispersion was determined by thermogravimetric analysis (TGA) as will described later.
Synthesis of GO-N3 GO-N3 was generated by reaction of GO dispersion (50 mL, 3 mg/mL) with sodium azide (600 mg, powder) in a 250 mL round bottom flask. The pH of the suspension was adjusted to 4.5 using 1% HCl and 1N NaOH solutions. The mixture was stirred overnight at room temperature (Scheme 2). When the reaction was complete, the mixture was transferred into a 50 mL centrifuge tube loaded with 20 mL CH2Cl2 and centrifuged at 3,214 × g (3900 rpm) for 2 minutes. GO-N3 separated as a middle layer after
centrifugation.
The
upper
aqueous
layer
was
discarded
and
the
washing/centrifugation step with DI H2O was repeated 10 times. CH2Cl2 was then discarded and finally GO-N3 was resuspended in 50 mL DI H2O. The final product (GO-N3) was obtained by freeze-drying. Characterisation was performed using ATRFTIR and Raman spectroscopy.
Qualitative assessment of azide group with StaudingerNinhydrin assay In this study, samples (10 mg/each) were co-heated with 1 mL of freshly prepared 10% PPh3 in CH2Cl2 (w/v) in a glass vial, at 80 °C for 30 minutes. The PPh3 pretreated samples and Ninhydrin (125 µl, 50 mg/mL EtOH) were co-heated in 3 mL 60 % EtOH at 100 °C for 7 minutes. The same experiment was repeated without the use of PPh3 as negative controls. The qualitative comparison results were determined by visual inspection of the solution colour-change. The scheme describing this reaction is shown in Scheme S3.
6
Synthesis of GO-N3 with epoxidised GO (epo-GO) Direct epoxidation of GO with meta-chloroperoxybenzoic acid (mCPBA) has not been reported in the literature. In this work, mCPBA was used to introduce epoxides on GO surface to form epo-GO. Methods of epo-GO preparation is described below and summarised in Scheme S4. In brief, GO suspension (50 mL, 3 mg/mL) and mCPBA 10 layers).
20
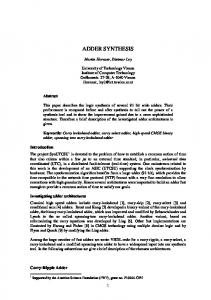
Figure S3: TEM images of GO with different sonication time. TEM images of the as prepared GO stock suspension produced by the modified Kovtyukhova-Hummer’s method without subsequent sonication (A) or sonicated for an additional 1 hr (B) or 3 hr (C). Scale bar is 5 µm. The stock suspension appears to consist mainly of large and multi-layered GO sheets but smaller GO sheets were also found. GO flakes size (surface area) was reduced after 3 hr of sonication. The majority of sonicated GO appeared to be more transparent (less layers) than the as prepared GO (stock suspension).
21
Figure S4: AFM height images of GO with different sonication times and flake surface area analysis. AFM images of the as prepared GO stock suspension produced by the modified Kovtyukhova-Hummer’s method without subsequent sonication (A, B) or sonicated for an additional 2 hr (C) or 4 hr (D). Scale bar = 5 µm. GO flake size (surface area) was reduced after 2 and 4 hr of sonication. The flake surface area analysis for GO (E) and GO after 4 hr sonication (F) showed a reduced max, median, mean surface area, and S.D. after prolonged sonication.
22
Figure S5. Infrared-transmittance Spectrum for GO-N3 with free azide impurities.
23
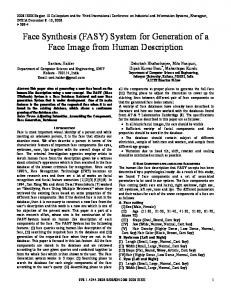
Figure S6. Physicochemical Characterisation of GO-N3. (A) Infraredtransmittance Spectrum for GO-N3. The IR spectra of GO (black) and GO-N3 (orange) are shown. The presence of different oxygen functionalities was confirmed for both samples at 3200 cm-1 (broad bonded O-H stretching vibration), 1700 cm-1 (carbonyl C=O stretching vibration), 1605 cm-1 (aromatic C=C stretching vibration), 1356 cm-1 (carboxyl O-C=O stretching vibration), 1227 cm-1 (symmetric stretching of epoxy groups, C-OH, or ketone), 1036 cm-1 (C-O in C-OH or C-O-C) and 971 cm-1 (C-O-C stretching vibration). The introduction of azide groups was observed by the presence of azide peak (-N3) at 2122 cm-1. (B) Raman spectra of GO (black) and GON3 (orange) measured at 785 nm are shown. The ID/IG ratios of GO and GO-N3 were 1.25 ± 0.01 and 1.30 ± 0.05, respectively (n = 3). (C) Both Studinger-Ninhydrin (PPh3/Ninhydrin treated) and traditional Ninhydrin (Ninhydrin treated) assays were used to verify the presence of azide groups. Photographs at day 0 and day 9 are shown. Ninhydrin assay showed negative results (colourless supernatants) for NaN3, GO and GO-N3. Staudinger-Ninhydrin assay showed positive results (orange-red supernatant) for both NaN3 (positive control) and GO-N3 samples, while GO showed negative result (light orange supernatant) as that shown for the blank (all reagents except azide containing compound).
24
Figure S7. Raman Spectra of GO-N3, Click2 GO (± mCPBA). Raman spectra of GO-N3 (orange) and Click2 GO (- mCPBA) (red) and Click2 GO (+ mCPBA) (blue) measured at 785 nm are shown. The ID/IG ratios of GO-N3, Click2 GO (- mCPBA) and Click2 GO (+ mCPBA) were 1.30 ± 0.05, 1.32 ± 0.03, and 1.28 ± 0.01 respectively (n = 3).
25
Figure S8. Synthetic scheme, FT-IR and 1H-NMR of (A) imidazole-1-solfonyl azide hydrochloride and (B) N3-PEG3500-N3.
26
Figure S9. SPPS of propargyl-modified angiopep-2. (A) Amino acid sequence, (B) FT-IR and (C) matrix-assisted laser desorption/ionization time of flight mass spectrometry results (MALDI-TOF MS) of crude Angiopep-2.
27
Figure S10. (A) Infrared-transmittance spectra and (B) thermogravimetric analysis of click reaction controls.
28
Figure S11: TEM images of GO clicked with Angiopep-2 (ANG-GO).
29
Figure S12: TEM images of GO double-clicked with alkyne modified Angiopep-2 and N3-PEG-N3 (ANG-GO-PEG).
30
Figure S13. Optical microscopy images of control A549 cells and cells incubated DMSO. A549 cells were incubated for 24 and 74 hr in a 37 °C incubator supplied with 5 % CO2. Scale bar = 5 µm. No concentrated black structures were found in control cells. DMSO was used as positive toxicity controls, as shown in the figures, most of the cells were died and detached from the plate when treated with DMSO.
31
Figure S14. Optical microscopy images of A549 cells incubated with GO, GO-N3 and Click2 GO for 24 hr. GO, GO-N3 and Click2 GO were incubated with A549 cells at 10, 50, and 100 µg/mL for 24 hr in a 37 °C incubator supplied with 5 % CO2. Scale bar = 5 µm. Graphene based materials seem to have minimum effect on cell growth. GO-N3 and Click2 GO showed a better cellular uptake profile when compared to plain GO sheets. Among the three, Click2 GO appeared to internalise the cell very efficiently across the three concentrations at 24 hr time point, as reflected by the increasingly concentrated black pattern that matched the cell distribution. GO-N3 also showed some degree of internalisation but less than the Click2 GO.
32
Figure S15. Optical microscopy images of A549 cells incubated with GO, GO-N3 and Click2 GO for 72 hr. GO, GO-N3 and Click2 GO were incubated with A549 cells at 10, 50, and 100 µg/mL for 72 hr in a 37 °C incubator supplied with 5 % CO2. Scale bar = 5 µm.
33
Figure S16. Optical microscopy images of A549 cells incubated with ANG-GO and ANG-GO-PEG for 24 hr. ANG-GO and ANG-GO-PEG were incubated with A549 cells at 10, 50, and 100 µg/mL for 24 hr in a 37 °C incubator supplied with 5 % CO2. Scale bar = 5 µm.
34
Figure S17. Optical microscopy images of A549 cells incubated with ANG-GO and ANG-GO-PEG for 72 hr. ANG-GO and ANG-GO-PEG were incubated with A549 cells at 10, 50, and 100 µg/mL for 72 hr in a 37 °C incubator supplied with 5 % CO2. Scale bar = 5 µm.
35
Figure S18: Purification of GO-N3 by washing/centrifugation.
36
Table S1: Modified Hummer’s Method v.s. modified Kovtyukhova-Hummer’s method.
Method 1a
Method 2b
Starting Graphite (mg)
4000
300
End product GO (mg)
5470
2
55.63%
-
GO Yieldc a
Modified Kovtyukhova-Hummer’s method.
b
Modified Hummer’s method.
c
Calculated using eq. S3
Table S2: Elemental analysis of pre-oxidised graphite (po-G) and GO samples.
Element (%)a
po-G
GO
C
92.82
47.35
H
0.95
N Oc
Atomic
Element
Mass
(w/w%)b
po-G
GO
12
91.73
41.24
2.17
1
0.08
0.16