Synthesis, Structure and Properties of the High-pressure Modifications of the Ternary Compounds REPtSn (RE = La, Pr, Sm) Jan F. Rieckena , Ute Ch. Rodewalda , Gunter Heymann b, Sudhindra Rayaprol a , Hubert Huppertz b, Rolf-Dieter Hoffmann a, and Rainer P¨ottgen a a
Institut f¨ur Anorganische und Analytische Chemie, Universit¨at M¨unster, Corrensstraße 30, D-48149 M¨unster, Germany b Department Chemie und Biochemie, Ludwig-Maximilians-Universit¨at M¨ unchen, Butenandtstraße 5 – 13 (Haus D), 81377 M¨unchen, Germany Reprint requests to Prof. Dr. R. P¨ottgen. E-mail:
[email protected] Z. Naturforsch. 61b, 1477 – 1484 (2006); received August 21, 2006 The hexagonal high-pressure (HP) modifications of the ternary compounds REPtSn (RE = La, Pr, Sm) were prepared under multianvil high-pressure (9 – 14 GPa) high-temperature (1050 – 1400 ◦C) conditions from the orthorhombic normal-pressure (NP) modifications. The HP-REPtSn stannides were investigated by X-ray diffraction on powders and single crystals: ZrNiAl type, space group ¯ P62m, a = 762.6(2), c = 418.55(7) pm, wR2 = 0.1147, 256 F2 values and 14 variables for HP-LaPtSn, a = 754.97(7), c = 412.64(3) pm, wR2 = 0.0782, 252 F2 values and 14 variables for HP-PrPtSn, and a = 750.1(2), c = 407.6(1) pm, wR2 = 0.1060, 229 F2 values and 14 variables for HP-SmPtSn. The high-pressure modifications have two crystallographically independent platinum positions in trigonal prismatic coordination, Pt1Sn6 RE3 and Pt2Sn3 RE6 . The shortest interatomic distances occur between the platinum and tin atoms within the three-dimensional [PtSn] networks. The rare earth atoms fill distorted hexagonal channels within these networks and they are bound through short RE-Pt contacts. Susceptibility measurements of HP-PrPtSn reveal paramagnetic behaviour with an experimental magnetic moment of 3.31(2) µB /Pr atom. Low-temperature susceptibility and specific heat data point to inhomogeneous magnetism in HP-PrPtSn. Key words: Intermetallic Compounds, Magnetism, High-pressure Phases
Introduction The equiatomic REPtSn (RE = rare earth element) stannides have first been synthesized by Dwight and coworkers some thirty years ago [1] and preliminary magnetic studies were performed in the Yakinthos group [2]. Later, these stannides have intensively been studied with respect to their interesting magnetic and electronic properties. A good literature overview is given in [3 – 6, and ref. therein]. With La, Ce, Pr, Nd, Sm, or Eu as rare earth metal components, these stannides crystallize with the orthorhombic TiNiSi-type structure [7], while those with the smaller rare earth elements adopt the hexagonal ZrNiAl-type [8 – 10]. This change in crystal structure seems to be driven by the size of the rare earth elements (lanthanoid contraction). For CePtSn [5] and NdPtSn [6] we could recently show that the phase transition can also occur through application of highpressure and high-temperature. Since this is a recon-
structive phase transition, the high-pressure samples can easily be quenched and characterized under ambient pressure conditions. We have now extended our investigations with respect to the REPtSn stannides with RE = La, Pr, Sm, in order to complete the series. So far, only X-ray powder data of LaPtSn [11, 12] and PrPtSn [2, 13] have been reported, while no lattice parameters can be found in the literature for SmPtSn [14]. Herein we report on crystallographic and physical property studies of the normal- and high-pressure phases REPtSn (RE = La, Pr, Sm). Experimental Section Synthesis Starting materials for the synthesis of the normal-pressure modifications of LaPtSn, PrPtSn, and SmPtSn were ingots of the rare earth metals (Chempur or Johnson Matthey), platinum powder (Degussa-H¨uls, 200 mesh), and a tin bar (Her-
0932–0776 / 06 / 1200–1477 $ 06.00 © 2006 Verlag der Zeitschrift f¨ur Naturforschung, T¨ubingen · http://znaturforsch.com
1478 Empirical formula Molar mass [g/mol] Unit cell dimensions [pm] (powder data) V [nm3 ] Calculated density [g/cm3 ] Crystal size [ µ m3 ] Detector distance [mm] Exposure time [min] ω Range; increment [◦ ] Transm. ratio (max/min) Absorption coefficient [mm−1 ] F(000) θ Range [◦ ] Range in hkl Total no. reflections Independent reflections Reflections with I ≥ 2σ (I) Data/parameters Goodness-of-fit on F 2 Final R indices [I ≥ 2σ (I)] R indices (all data) Extinction coefficient ˚ 3] Largest diff. peak and hole [e/A Empirical formula Molar mass [g/mol] Unit cell dimensions [pm] (powder data) V [nm3 ] Calculated density [g/cm3 ] Crystal size [ µ m3 ] Transm. ratio (max/min) Absorption coefficient [mm−1 ] F(000) θ Range [◦ ] Range in hkl Total no. reflections Independent reflections Reflections with I ≥ 2σ (I) Data/parameters Goodness-of-fit on F 2 Final R indices [I ≥ 2σ (I)] R indices (all data) Flack parameter x Extinction coefficient ˚ 3] Largest diff. peak and hole [e/A
J. F. Riecken et al. · High-pressure Phases of REPtSn (RE = La, Pr, Sm) NP-LaPtSn 452.69 a = 755.8(1) b = 465.7(1) c = 805.3(1) 0.2835 10.61 20 × 30 × 60 60 5 0 – 180; 1.0 0.490 / 0.138 72.4 740 3 to 35 −12/ + 11, −7/ + 6, ±12 3869 683 (Rint = 0.0367) 552 (Rsigma = 0.0405) 683 / 20 0.897 R1 = 0.0252 wR2 = 0.0541 R1 = 0.0368 wR2 = 0.0558 0.0067(3) 2.76/ − 3.86 HP-LaPtSn 452.69 a = 762.6(2) c = 418.55(7) 0.2108 10.70 20 × 20 × 40 0.705 / 0.453 73.0 555 3 to 30 ±10, ±10, ±5 2279 256 (Rint = 0.1939) 221 (Rsigma = 0.0757) 256/14 1.218 R1 = 0.0495 wR2 = 0.0978 R1 = 0.0693 wR2 = 0.1147 −0.04(5) 0.0001(7) 4.27/ − 4.86
NP-PrPtSn 454.69 a = 742.81(6) b = 461.77(4) c = 802.30(5) 0.2752 10.97 20 × 30 × 30 60 6 0 – 180; 1.0 0.335 / 0.193 76.8 748 3 to 35 ±11, ±7, −12/ + 11 3870 653 (Rint 0.0594) 511 (Rsigma = 0.0480) 653 / 20 0.867 R1 = 0.0286 wR2 = 0.0470 R1 = 0.0457 wR2 = 0.0500 0.0026(2) 3.24/ − 3.44 HP-PrPtSn 454.69 a = 754.97(7) c = 412.64(3) 0.2037 11.12 20 × 20 × 60 0.315 / 0.297 77.8 561 3 to 30 ±10, ±10, ±5 3233 252 (Rint = 0.2026) 225 (Rsigma = 0.0600) 252/14 1.171 R1 = 0.0345 wR2 = 0.0708 R1 = 0.0471 wR2 = 0.0782 −0.04(1) 0.0012(4) 3.09/ − 3.02
aeus), all with stated purities better than 99.9%. The larger rare earth metal ingots were mechanically cut into smaller pieces under paraffin oil and cleaned with n-hexane. Both the paraffin oil and n-hexane were dried over sodium wire. The small rare earth metal pieces were subsequently arc-melted under an atmosphere of ca. 600 mbar argon [15]. The ar-
NP-SmPtSn 464.13 a = 731.6(2) b = 459.1(2) c = 801.1(3) 0.2691 11.46 20 × 20 × 30 – – – 0.923 / 0.178 82.2 760 3 to 35 ±11, −7/0; ±12 2413 641 (Rint = 0.1021) 611 (Rsigma = 0.0653) 641 / 20 1.046 R1 = 0.0234 wR2 = 0.0453 R1 = 0.0251 wR2 = 0.0459 0.0034(2) 3.48/ − 3.30
Table 1. Crystal data and structure refinement for NP-REPtSn (RE = La, Pr, Sm), space group Pnma, Z = 4.
HP-SmPtSn 464.13 a = 750.1(2) c = 407.6(1) 0.1986 11.64 20 × 20 × 20 0.252 / 0.069 83.5 570 3 to 29 ±10, ±10, ±5 2140 229 (Rint = 0.3491) 204 (Rsigma = 0.1421) 229/14 1.031 R1 = 0.0457 wR2 = 0.0985 R1 = 0.0583 wR2 = 0.1060 −0.01(5) 0.002(1) 4.89/ − 6.80
Table 2. Crystal data and structure refinement for HP-REPtSn (RE = La, Pr, Sm), ¯ space group P62m, Z = 3.
gon was purified over molecular sieves, silica gel, and titanium sponge (900 K). The pre-melting procedure for the rare earth metals strongly reduces a shattering of these elements during the exothermic reaction with platinum and tin. The rare earth metal buttons, cold-pressed pellets of platinum (∅6 mm) and pieces of the tin bar were then mixed in
J. F. Riecken et al. · High-pressure Phases of REPtSn (RE = La, Pr, Sm)
1479
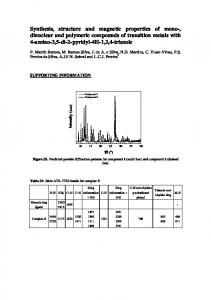
Fig. 1. Temperature-dependent X-ray powder patterns of HP-SmPtSn. the ideal 1 : 1 : 1 atomic ratio and the stannides were synthesized by arc-melting of the elements. The samples were then flipped over and remelted in order to achieve homogeneity. The moisture stable samples were obtained in amounts of 1 g. The high-pressure/high-temperature treatment of the phases NP-REPtSn (RE = La, Pr, Sm) took place via a multianvil assembly. Details about the technique and the construction of the different assemblies can be found in references [16 – 19]. In order to realize the phase transformations, the intermetallic normal-pressure precursors were carefully milled and filled into boron nitride crucibles of the high-pressure assemblies. The intermetallic samples were compressed to pressures of 11.5 GPa (HP-LaPtSn; 14/8-assembly), 10.5 GPa (HP-PrPtSn; 14/8-assembly), and 13.5 GPa (HP-SmPtSn; 10/5-assembly) for 240 min. In principle, all mentioned phases can be synthesized in the pressure range 9 – 14 GPa. In contrast to HP-PrPtSn and HP-SmPtSn, which were obtained as phase-pure compounds, the lanthanum compound up to now appeared always as a mixture of the normal- and high-pressure form (with HP-LaPtSn being the major phase). The synthesis temperatures varied in the range of 1050 – 1400 ◦C (HP-LaPtSn: 1050 ◦C; HP-PrPtSn: 1100 ◦C; HP-SmPtSn: 1400 ◦C). Within 20 min the maximum temperature was reached followed by a 10 min period of constant temperature. Afterwards, the samples were cooled to r. t. within 10 min. Systematic investigations showed that higher temperatures and subsequent annealing under pressure at 500 to 900 ◦C for several hours enhanced the crystallinity of the samples. After decompression, the samples were carefully separated under a microscope from the surrounding assembly parts. NP-REPtSn and HP-REPtSn (RE = La, Pr, Sm) are stable in moist air over weeks. The polycrystalline samples are silvery with metallic luster. Powdered samples of both modifications are dark gray.
X-Ray diffraction The samples were characterized through Guinier powder patterns using CuKα1 radiation and α -quartz (a = 491.30, c = 540.46 pm) as an internal standard. The orthorhombic, respectively hexagonal lattice parameters (Tables 1 and 2) were obtained from least-squares fits of the powder data. The correct indexing of the patterns was ensured through intensity calculations [20] taking the atomic positions from the structure refinements. The lattice parameters determined from the powders and the single crystals agreed well and were also in good agreement with the literature data. Temperature dependent in situ X-ray diffractometry was performed for the HP-SmPtSn sample on a STOE Stadi P powder diffractometer (MoKα ; λ = 71.073 pm) with a computer-controlled STOE furnace. An electrically heated graphite tube held the sample capillary vertical with respect to the scattering plane. Bores in the graphite tube permitted unobstructed pathways for the primary beam as well as for the scattered radiation. The temperature, measured by a thermocouple in the graphite tube, was kept constant within 0.2 ◦C. The heating rate between different temperatures was set to 50 ◦C/min and the data acquisition started directly after reaching the next temperature step. Successive heating of HP-SmPtSn filled in a 0.1 mm outside diameter Mark capillary showed that the high-pressure modification was stable up to 850 ◦C under argon atmosphere (Fig. 1). The complete transformation into the normalpressure modification took place at about 1000 ◦C. Interestingly, HP-SmPtSn transformed back to the normal-pressure modification at temperatures about 150 ◦C higher than isotypic HP-CePtSn [5]. In contrast to HP-CePtSn, where the transformation into the normal-pressure phase started at 500 ◦C and ended up at 850 ◦C, the samarium compound retransformed in a smaller range between 850 – 1000 ◦C. At
J. F. Riecken et al. · High-pressure Phases of REPtSn (RE = La, Pr, Sm)
1480 Atom NP-LaPtSn La Pt Sn NP-PrPtSn Pr Pt Sn NP-SmPtSn Sm Pt Sn Atom HP-LaPtSn La Pt1 Pt2 Sn HP-PrPtSn Pr Pt1 Pt2 Sn HP-SmPtSn Sm Pt1 Pt2 Sn
Wyckoff x position
y
z
U11
0.01293(8) 0.29273(6) 0.17590(9)
4c 4c 4c
0.01117(9) 1/4 0.69785(8) 94(3) 96(2) 117(3) 0.28722(6) 1/4 0.40766(6) 109(2) 80(2) 85(2) 0.17551(10) 1/4 0.08176(11) 122(3) 80(3) 85(4)
4c 4c 4c
0.01070(4) 0.28729(3) 0.17866(6)
1/4 0.69735(6) 1/4 0.40942(4) 1/4 0.08367(7)
49(3) 59(2) 73(2) 44(2) 63(3) 36(3)
U33
4c 4c 4c
Wyckoff position
1/4 0.69532(7) 1/4 0.40883(5) 1/4 0.08304(9)
U22
71(1) 75(1) 90(1) 60(1) 88(2) 52(2)
x
y
z
U11
U22
3f 1a 2d 3g
0.5859(5) 0 2/3 0.2490(5)
0 0 1/3 0
0 0 1/2 1/2
24(11) 36(10) 49(7) 22(12)
45(16) U11 U11 13(17)
3f 1a 2d 3g
0.4110(3) 0 1/3 0.7473(3)
0 0 2/3 0
0 0 1/2 1/2
44(7) 46(6) 46(5) 35(8)
3f 1a 2d 3g
0.5919(4) 0 2/3 0.2558(4)
0 0 1/3 0
0 0 1/2 1/2
114(11) 107(9) 104(7) 72(11)
U13
48(2) 3(2) 46(2) −1(1) 36(3) −2(2)
52(1) 54(1) 45(1)
3(2) 102(1) 1(2) 91(1) 4(3) 96(2)
33(2) 2(1) 27(2) −2(1) 12(3) −2(2)
60(1) 59(1) 51(1)
U12
Ueq
37(13) 51(16) 58(12) 37(17)
23(8) 18(5) 24(4) 7(8)
33(7) 41(7) 52(6) 25(7)
56(10) U11 U11 31(11)
68(10) 54(12) 101(10) 63(14)
28(5) 23(3) 23(2) 16(6)
55(5) 49(5) 64(4) 44(5)
136(13) U11 U11 119(16)
29(13) 5(17) 62(14) 29(19)
68(6) 53(5) 52(4) 60(8)
91(7) 73(7) 90(6) 68(8)
the maximum temperature of 1100 ◦C, another transformation into an unknown phase took place. Under these conditions a reaction with the Mark capillary could not be excluded. No further transformations of the unknown phase were detectable by lowering the temperature to ambient conditions. Single crystal intensity data were collected at r. t. by use of a four-circle diffractometer (CAD4) with graphite monochromatized MoKα (71.073 pm) radiation and a scintillation counter with pulse height discrimination. The scans were taken in the ω /2θ mode and empirical absorption corrections were applied on the basis of psi-scan data, followed by spherical absorption corrections. Some crystals were measured on a Stoe IPDS-II image plate system in oscillation mode. Numerical absorption corrections were applied to these data sets. All relevant details concerning the data collections and evaluations are listed in Tables 1 and 2. Structure refinements Small, irregularly shaped single crystals of the normaland high-pressure modifications of REPtSn (RE = La, Pr, Sm) were first examined by use of a Buerger camera equipped with an image plate system (Fujifilm BAS-1800) in order to establish both symmetry and suitability for intensity
U33
Ueq
Table 3. Atomic coordinates and anisotropic displacement parameters (pm2 ) for NP-REPtSn (RE = La, Pr, Sm). Ueq is defined as one third of the trace of the orthogonalized Uij tensor. The anisotropic displacement factor exponent takes the form: −2π 2 [(ha∗ )2U11 + . . . + 2hka∗ b∗U12 ]. U12 = U23 = 0.
Table 4. Atomic coordinates and anisotropic displacement parameters (pm2 ) for HP-REPtSn (RE = La, Pr, Sm). Ueq is defined as one third of the trace of the orthogonalized Uij tensor. The anisotropic displacement factor exponent takes the form: −2π 2 [(ha∗ )2U11 + . . . + 2hka∗ b∗U12 ]. U13 = U23 = 0.
data collection. For HP-SmPtSn it was extremely difficult to find a suitable single crystal. Most investigated crystals consisted of several domains. The isotypy of the normal-pressure modifications with the orthorhombic TiNiSi-type [7], space group Pnma, and of the high-pressure modifications with the ¯ hexagonal ZrNiAl-type [8 – 10], space group P62m, was already evident from the Guinier powder data. The atomic parameters of isotypic NP-CePtSn and HP-CePtSn [5] were taken as starting values and the structures were refined using S HELXL-97 [21] (full-matrix leastsquares on F 2 ) with anisotropic atomic displacement parameters for all atoms. Refinement of the correct absolute structure for the high-pressure modifications was ensured through refinement of the Flack x parameter [22, 23]. As a check for the correct composition and the correct site assignment, the occupancy parameters were refined in separate series of least-squares cycles along with the displacement parameters. All sites were fully occupied within two standard deviations and in the final cycles the ideal occupancies were assumed again. The final difference Fourier syntheses were flat (Tables 1 and 2). The positional parameters and interatomic distances (exemplary for LaPtSn) of the refinements are listed in Tables 3 – 5. Further details on the structure refinements are available.
J. F. Riecken et al. · High-pressure Phases of REPtSn (RE = La, Pr, Sm)
1481
Table 5. Interatomic distances (pm), calculated with the powder lattice parameters in NP- and HP-LaPtSn. Standard deviations are given in parentheses. All distances within the first coordination spheres are listed. NP-LaPtSn La: 1 2 2 1 2 1 2 1 2 2 Pt: 2 1 1 1 2 2 1 Sn: 2 1 1 2 1 1 2
Pt Pt Sn Sn Pt Sn Sn Pt La La Sn Sn Sn La La La La Pt Pt Pt La La La La
313.0(1) 324.6(1) 326.3(1) 335.7(1) 338.6(1) 339.3(1) 343.1(1) 359.6(1) 388.0(1) 391.9(1) 272.9(1) 276.8(1) 289.7(1) 313.0(1) 324.6(1) 338.6(1) 359.6(1) 272.9(1) 276.8(1) 289.7(1) 326.3(1) 335.7(1) 339.3(1) 343.1(1)
HP-LaPtSn La: 4 1 2 4 4 2
Pt1: Pt2:
Sn:
Pt2 Pt1 Sn Sn La La
310.7(1) 315.8(4) 331.4(4) 345.9(3) 397.8(2) 418.6(1)
6 3 3 6
Sn La Sn La
282.6(2) 315.8(4) 291.8(2) 310.7(1)
2 2 2 2 4
Pt1 Pt2 Sn La La
282.6(2) 291.8(2) 328.8(6) 331.4(4) 345.9(3)
Details may be obtained from: Fachinformationszentrum Karlsruhe, D-76344 Eggenstein-Leopoldshafen (Germany), by quoting the Registry No’s. CSD-416896 (NP-LaPtSn), CSD-416901 (HP-LaPtSn), CSD-416898 (NP-PrPtSn), CSD-416900 (HP-PrPtSn), CSD-416897 (NP-SmPtSn), and CSD-416899 (HP-SmPtSn). Physical property measurements The physical properties of HP-PrPtSn were studied by magnetic susceptibility and heat capacity (Cp ) measurements on a Quantum Design Physical Property Measurement System (PPMS). The sample for magnetic measurements was enclosed in a gelatin capsule and attached to the sample rod of the AC measurement system (ACMS). For the Cp measurement the sample was glued to the platform of a precalibrated heat capacity measuring puck using Apiezon N grease.
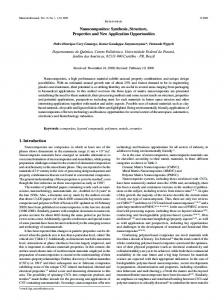
Results and Discussion Crystal chemistry Similar to HP-CePtSn [5] and HP-NdPtSn [6], the orthorhombic stannides LaPtSn, PrPtSn, and SmPtSn also transform to ZrNiAl-type high-pressure modifications. As is evident from Fig. 2, the transformation is
Fig. 2. Plot of the cell volumes of the orthorhombic normaland hexagonal high-pressure modifications of REPtSn. For better comparison we plot the volumes per formula unit.
Fig. 3. Coordination polyhedra of the lanthanum atoms in NP-LaPtSn and HP-LaPtSn. The site symmetries are indicated.
accompanied by a densification effect of less that 1% in volume. The course of the cell volumes of the normalpressure and high-pressure phases nicely reflects the lanthanoid contraction. Both curves are almost parallel. As expected for the trivalent cerium atoms on both CePtSn modifications, the plot of the cell volumes shows no anomaly. The samarium compound has now been fully characterized for the first time. In their previous study, Sakurai et al. [14] did not report lattice parameters. The crystal chemistry details and a discussion of chemical bonding in both modifications had already been given for CePtSn [5]. Here we give only a brief account. As an example, the lanthanum coordination polyhedra of both modifications are presented in Fig. 3. Due to the reconstructive type of the phase transition we observe a significantly different coordination. Each lanthanum atom has six nearest lanthanum neighbors,
1482
J. F. Riecken et al. · High-pressure Phases of REPtSn (RE = La, Pr, Sm)
but in different geometry and with distinctly different La–La distances (Table 5). Also the lanthanum– platinum coordination is different, i. e. six platinum neighbors in the normal-pressure and five in the highpressure modification. The different rare earth coordination is the main reason for the differing magnetic properties of both modifications of PrPtSn, similar to CePtSn [5] and NdPtSn [6]. Magnetic properties of HP-PrPtSn The magnetic behavior of NP-PrPtSn was studied on polycrystalline samples [2] and a Czochralski grown single crystal [13]. The detailed studies by Januˇsova et al. [13] gave no hint for magnetic ordering down to 0.4 K. In Fig. 4, we present the dc (χ ) of HP-PrPtSn measured in an applied dc field of 5 kOe. The susceptibility χ (T ) increases monotonously with decreasing temFig. 5. The dc susceptibility (χ = M/H) of HP-PrPtSn measured in ZFC-FC state of the sample at a dc field of 100 Oe.
Fig. 6. The dc susceptibility (χ = M/H) of HP-PrPtSn measured in ZFC state of the sample at several applied fields.
Fig. 4. The dc susceptibility (χ = M/H) as a function of temperature (T ) for HP-PrPtSn measured in a steady field of 5 kOe. The top inset shows the anomaly in χ (T ) at low temperatures. The bottom inset shows the inverse susceptibility in the measured temperature range.
perature, as expected for a paramagnet. Below 10 K a broad step-like anomaly appears, however, without any clear signature of magnetic ordering. From the linear region of the inverse susceptibility at temperatures above 100 K, the paramagnetic Curie temperature observed is about −4.5 K. The negative sign indicates an-
J. F. Riecken et al. · High-pressure Phases of REPtSn (RE = La, Pr, Sm)
1483
Fig. 8. Magnetization (M) as a function of varying field (H) for HP-PrPtSn, measured at various temperatures.
Fig. 7. The ac susceptibility of HP-PrPtSn measured in an ac field (Hac ) of 1 Oe and at different driving frequencies (ν ).
tiferromagnetic interactions. The effective Bohr magneton number (µ B ) per Pr3+ calculated from the inverse susceptibility is 3.31(2) µ B close to the theoretical value of 3.58 µ B . In contrast, the investigations on NP-PrPtSn data [2, 13] revealed an experimental magnetic moment slightly higher than the theoretical one. The anomaly below 10 K is more clearly visible in the χ (T ) curve measured at a low field of 100 Oe (Fig. 5). The χ (T ) data measured in ZFC and FC states of the sample do not bifurcate and are the same within the experimental errors. The peak in the diagram of the 100 Oe measurements appears near 10 K, as compared to the 5 kOe measurement. To probe response of this anomaly to the dc field, we have measured χ (T ) of HP-PrPtSn at different applied fields and plotted these data in Fig. 6. The figure clearly shows the field dependence of the susceptibility. The moment values (in emu/mol) decrease with increasing field. The step in χ (T ) observed for H ≤ 10 kOe also vanished with increasing field. The overlap of the ZFC-FC curves χ (T ) in low field rules out any spin-glass anomalies. Therefore, the origin of the broad feature below 10 K can
Fig. 9. Specific heat (Cp ) of HP-PrPtSn plotted as Cp vs. T and Cp /T vs. T in the top and bottom panels. The inset in the top panel highlights the features below 10 K. The inset in the bottom panel is shown to highlight the logarithmic increase in Cp /T at low temperatures (below 10 K).
be due to short range magnetic ordering arising due to inhomogeneous magnetism.
1484
J. F. Riecken et al. · High-pressure Phases of REPtSn (RE = La, Pr, Sm)
We present here the ac susceptibility (χ and χ ) data of HP-PrPtSn measured at different frequencies and an ac field (amplitude, H ac ) of 1 Oe. In Fig. 7, we have plotted the real and imaginary parts of the linear susceptibility (χ and χ ). The broad peak around 6 K is consistent with the step-like feature in the dc susceptibility. The two main observations from this measurement are (i) no frequency dependence in χ and (ii) featureless χ . This rules out quite conclusively any type of spin-glass like anomaly in HP-PrPtSn. We have also measured isothermal magnetizations of HP-PrPtSn at several temperatures. In Fig. 8, we show the M(H) data measured after reaching the temperature in ZFC state. For T ≤ 10 K, isotherms increase non-linearly with increasing H, the sample thus behaving as an antiferromagnet without saturation up to 80 kOe. The moment value at 80 kOe and 3 K is about 1.1 µ B , about 30% of the expected saturation moment for Pr 3+ (given by g × J = 3.20 µ B ). The features of M(H) are similar up to T = 10 K, which indicates the persistence of inhomogeneous magnetism up to 10 K. At 50 K, M(H) is linear indicative of a paramagnetic state. Now we focus on the Cp (T ) of HP-PrPtSn in Fig. 9. The anomalies observed in the magnetic measurements
can also be seen for Cp in the form of a broad peak around 5 K. We also show the plot of C p /T vs. T in the same figure. The absence of any clear peak is indicative of inhomogeneous magnetism in HP-PrPtSn. Stewart et al. [24] have shown that one of the signatures for non-Fermi liquid behavior in an intermetallic compound with d – f electrons is a − logT temperaturedependence of Cp (i. e., an upturn in the plot of C p /T vs. logT ). In the inset of the bottom panel, we illustrate the Cp /T vs. T correlation, with T plotted on a log scale to highlight Cp /T ∼ − logT at low temperatures. Thus, the CP data are in line with the susceptibility data.
[1] A. E. Dwight, W. C. Harper, C. W. Kimball, J. LessCommon Met. 30, 1 (1973). [2] Ch. D. Routsi, J. K. Yakinthos, E. Gamari-Seale, J. Magn. Magn. Mater. 110, 317 (1992). [3] A. Szytuła, J. Leciejewicz, Handbook of Crystal Structures and Magnetic Properties of Rare Earth Intermetallics. CRC Press, Boca Raton, Florida (1994). [4] R. V. Skolozdra, Stannides of rare-earth and transition metals, in K. A. Gschneidner (Jr.), L. Eyring (eds): Handbook on the Physics and Chemistry of Rare Earths, North-Holland/Elsevier, Amsterdam, Vol. 24, chapter 164, 399 – 517 (1997). [5] J. F. Riecken, G. Heymann, T. Soltner, R.-D. Hoffmann, H. Huppertz, D. Johrendt, R. P¨ottgen, Z. Naturforsch. 60b, 821 (2005). [6] G. Heymann, S. Rayaprol, J. F. Riecken, R.-D. Hoffmann, U. Ch. Rodewald, H. Huppertz, R. P¨ottgen, Solid State Sci., in press. [7] C. B. Shoemaker, D. P. Shoemaker, Acta Crystallogr. 18, 900 (1965). [8] P. I. Krypyakevich, V. Ya. Markiv, E. V. Melnyk, Dopov. Akad. Nauk. Ukr. RSR, Ser. A 750 (1967). [9] A. E. Dwight, M. H. Mueller, R. A. Conner (Jr.), J. W. Downey, H. Knott, Trans. Met. Soc. AIME 242, 2075 (1968). [10] M. F. Zumdick, R.-D. Hoffmann, R. P¨ottgen, Z. Naturforsch. 54b, 45 (1999).
[11] F. Canepa, S. Cirafici, J. Alloys Compd. 232, 71 (1996). [12] M. Divis, B. Janouˇsova, J. Rusz, V. Sechovsky, M. Richter, I. Opahle, J. Alloys Compd. 376, 28 (2004). [13] B. Janouˇsova, V. Sechovsky, A. H. Lacerda, T. Komatsubara, Czech. J. Phys. 54 (Suppl. D), D319 (2004). [14] J. Sakurai, K. Kegai, T. Kuwai, Y. Isikawa, K. Nishimura, K. Mori, J. Magn. Magn. Mater. 140 – 144, 875 (1995). [15] R. P¨ottgen, Th. Gulden, A. Simon, GIT LaborFachzeitschrift 43, 133 (1999). [16] H. Huppertz, Z. Kristallogr. 219, 330 (2004). [17] D. Walker, M. A. Carpenter, C. M. Hitch, Am. Mineral. 75, 1020 (1990). [18] D. Walker, Am. Mineral. 76, 1092 (1991). [19] D. C. Rubie, Phase Trans. 68, 431 (1999). [20] K. Yvon, W. Jeitschko, E. Parth´e, J. Appl. Crystallogr. 10, 73 (1977). [21] G. M. Sheldrick, S HELXL-97, Program for Crystal Structure Refinement, University of G¨ottingen, 1997. [22] H. D. Flack, G. Bernadinelli, Acta Crystallogr. A55, 908 (1999). [23] H. D. Flack, G. Bernadinelli, J. Appl. Crystallogr. 33, 1143 (2000). [24] G. R. Stewart, Rev. Mod. Phys. 73, 797 (2001).
Acknowledgements We thank Prof. W. Schnick for using the high-pressure facilities, Dipl.-Chem. B. V. Lotsch and T. Miller for the in situ X-ray diffractometry, S. Christian for preparative help, and H.-J. G¨ocke for the work at the scanning electron microscope. This work was financially supported by the Deutsche Forschungsgemeinschaft (Po573/10-1 and HU966/4-1) and the European Science Foundation through the COST D30/003/03 network Development of Materials Chemistry using High-Pressures. S. Rayaprol is indebted to the Alexander von Humboldt-Stiftung for a research grant.