System benefits of coordinating wind power and hydropower in a deregulated market Klaus-Ole Vogstad Dep of Electrical Eng, NTNU SEFAS/NOR-7465 Trondheim phone: +47 73597644 fax: +47 73597250
[email protected] www.stud.ntnu.no/~klausv
Hannele Holttinen VTT Energy PB. 1606/FIN-02044 VTT phone:+358-9-4561 fax: +358-9-456 6538
[email protected]
Audun Botterud John O.G. Tande Dep of Electrical Eng. NTNU Sintef Energy SEFAS/NOR-7465 Trondheim SEFAS/NOR-7465 Trondheim phone: +47 73597165 phone: +47 73597494 fax: +47 73597250 fax: +47 73597250
[email protected] [email protected] tef.no
ABSTRACT: New additions of wind energy in the Nordic electricity market has been studied using the EMPS model. A scenario for year 2010 with CO2-tax and a total of 16 TWh of wind energy according to national targets have been included. The study focuses on the effect of changes in production scheduling imposed by new additions of wind energy under operation of a deregulated market. As a result, the import/export balance between the countries change in favor of exports to Finland and Germany. CO2-reductions caused by wind energy is estimated to be 540 tC/GWh of wind energy generated for the 2010 scenario. The main CO2-reductions take place in Germany and Finland as the result of wind energy expansion in Norway, Sweden and Denmark. The energy value of wind power of the Nordic hydro-thermal deregulated market is estimated to be 7% higher than the average spot price in the 2010 scenario. Keywords: Markets - 1;Power Plant Scheduling - 2; Environmental Aspects - 3
1. INTRODUCTION There are extensive plans for realising the potential of wind power in the Nordic countries. The government in Norway recently set a target of 3 TWh within 2010 [1]. In Sweden, the wind power production will probably yield 4 TWh in 2010 [2], and in Denmark 17 TWh in 2030. In Finland the target is 1 TWh production from wind power in 2010 [3]. In the Nordic countries, electricity is traded between the countries in an open, liberalised, joint market. Thus system integration of wind energy not only influence domestic energy production, it influences the whole market area. However, energy and environmental policies are usually made on national level. In the Nordic countries, the electricity system is characterised by its large share of hydropower, especially in Norway and Sweden. The large variations in hydro inflow are compensated with large storage capacities, giving a large flexibility in hydropower scheduling. The purpose of this paper is to explore the changes imposed by expansion of wind energy in the Nordic market area. Wind power influence area prices which in turn influence production scheduling, and thereby total CO2-emissions for each of the Nordic countries uncorrelated with the location of new wind energy. The simulations are carried out using the EMPS model, a stochastic model for longterm optimisation and simulation of hydro-thermal system operation.
2. THE EMPS MODEL
the reservoir for given reservoir levels. They are functions of expected future inflow and alternative production costs (e.g. from thermal power production), and in the EMPS model they are treated as the marginal cost of hydro power. Helnes
Bodø
Ørland
Valassaaret
Visby Säve RisøBarkåkra
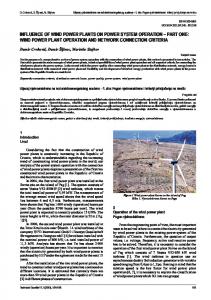
Figure 1 The EMPS model of interconnected areas with capacity constraints that limits exchange between areas. Location of the seven selected met stations for wind energy modelling are also indicated in red.
The EMPS model (EFI’s Multi-area Power-Market Simulator) was originally developed for hydro scheduling The calculated water values are used in the simulation purposes [6]. After deregulation, it has also served as a tool part, where the optimal hydropower schedule with respect for price forecasting. In brief, the model optimises the total to maximised expected profit for each area is determined. electricity production for a set of interconnected areas, The corresponding market prices for each area are also calincluding several types of electricity production. The culated. A more detailed description of the EMPS model is EMPS model has two main parts. In the strategy part, the given in [6][7]. so-called water values of the water reservoirs are calculated using a SDP (stochastic dynamic programming) algorithm 3. WIND POWER IN THE EMPS MODEL on aggregated reservoir representations of each area. The 3.1 Weekly wind power production data water values are estimates of the future value of water in WIP-Renewable Energies, Sylvensteinstr. 2, D-81369 München, Germany. Tel: +49-89-720 12 32
The weekly wind power production data was based on meteorological wind speed measurements from the years 1961-90. The Norwegian data is from; Ørland, Bodø and Helnes [8]. The Swedish data is from Säve,Visby and Barkåkra [10]. The Finnish data is from Valassaaret, near Vasa. Data from the Risø mast were given to us by courtesy
Market cross 50
Supply Supply ref2010 wind2010
Demand 45
40
35
Seasonal distribution of wind energy 3
2
NOK øre/kWh
2.5
% of yearly production
30
Risø Säve Visby Barkåkra Ørland Bodø Helnes Valassaret
25
Regulated hydropower
20
15
∆p
import A3
coal
10
5
1.5
oil
run-of-river
0 0
10
20
chp A1
A2
export ∆D
+wind power
30
40
50
60
70
80
90
100
production, demand [MWh/h]
1
5
10
15
20
25 30 Week
35
40
45
50
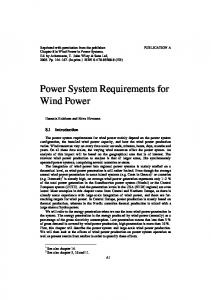
Figure 2 Seasonal variation of wind energy production for the selected 8 met stations. The values are 30-year mean values from 1961-90.
Figure 3 Example of price formation in a particular week, in one of the areas in the EMPS model. Wind power is introduced as a base load, shifting the supply curve to the right.
Simulated spot price distristributions
of Risø National Laboratory.
4. SCENARIOS
Red dotted lines: ref2010 Blue lines: wind2010
6
5
4
eurocents/kWh
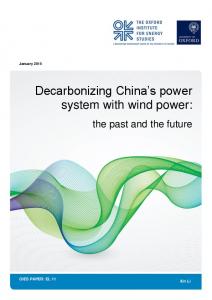
3.2 Wind power modelling The EMPS model simulates the electricity market with weekly resolution, thus short term fluctuations of wind power is not considered in this study. Wind series have been converted into energy series as described in [8]. The number of full-load hours were set to 3000 for Norway, 2600 for Denmark and Sweden, and 2300 for Finland. Power curve from a 1.5 MW turbine was used for converting wind series in Norway, and data from a 2 MW turbine for the Swedish, Danish and Finnish wind series. Figure 3 shows how market changes power scheduling with wind power. Wind power is introduced as a base load in the supply curve for wind2010, shifting the supply curve to the right. The changes in spot price, ∆p and demand, ∆D are marked on figure 3. The area between the ref2010 and wind2010 (A1,A2,A3) represents the avoided energy costs due to wind power. For the regulated hydropower units, water values are used for production scheduling. The curved line on the supply curve represents the water value of regulated hydropower. Note that the water values may change after introducing wind energy in the wind2010 supply curve. Water values are recalculated, because new sources of energy may give another optimal schedule for hydropower. A detailed study on this topic can be found in [9] The resulting simulated prices are shown as distributions in figure 4, because hydro inflow and wind are stochastic variables.
100 % (dry year)
3
Mean value
2
1
0 % (wet year) 5
10
15
20
25
30
35
40
45
50
Week no.
Figure 4 Spot price distributions for the ref2010 and wind2010 scenarios. Thick lines show mean values, thin lines show 100 (upper bound), 75, 25 and 0% (lower bound) percentiles for spot prices. for year 2010 A summary of production capacity data and demand for each scenario is provided in appendix. Production data for Germany is the same in the 2010 scenarios as for the 1999 scenario. We justify this simplification by assuming that the capacity of the remaining fossil fuelled units in year 2010 in Germany are larger than the import/ export capacity to the Nordic countries. The data set used in this analysis contains 18 areas comprising Norway, Sweden, Finland, Denmark and Germany (see figure 1). Time resolution is one week, and the hydro inflow data is based on the period 1961 – 1990 with weekly inflow data for each existing hydrological unit.
Three scenarios were developed for the EMPS model. One for 1999, as a reference, and two for the year 2010.The projections for demand in the Nordic countries are according to [12] and [13]. These reports together with Nordel 4.1 Reference scenario 1999, ref1999 projections [14] were also used for projections in capacity WIP-Renewable Energies, Sylvensteinstr. 2, D-81369 München, Germany. Tel: +49-89-720 12 32
This scenario describes the present installed capacity and demand in the Nordic market area. See appendix for further details of installed production capacity for the different countries.
The avoided costs of the 12.5 TWh of wind energy added were estimated to 3.6 euro cents/kWh. This value is approximately 7% higher than the simulated average spot prices for the wind2010 scenario.
4.2 Reference scenario 2010, ref2010 In Denmark, conversion from coal to gas, plus extensive use of straw and other renewables in CHP district heating according to the Energy 21 action plan [4] takes place. Though new additions of wind power also are included in these plans, we do not add new wind energy in this scenario. This means that for ref2010, the present yearly wind energy production of 3.51 TWh is used. Of course, a scenario without new wind energy in Denmark is unrealistic, but the ref2010 is used to observe the impact of wind energy, as a reference for the wind2010 scenario. In Sweden, 4 TWh of nuclear energy is decommissioned, while the use of gas and renewable CHP generation is intensified. The consumption increases from 143 to 152 TWh/y. In Finland, consumption increases from 73 to 85 TWh/y due to industrial growth. A new nuclear unit producing 10 TWh/y is commissioned, in addition to some new gas fired units. For Norway, a 600 MW transmission line to Germany is expected to be commissioned, and 400 MW of gas power is added. The consumption level has increased by 3 TWh. A CO2-tax on electricity generation has been introduced for all of the countries, amounting to 15.6 euro/tC. The choice of this tax level was taken from [5]. The CO2tax also applies to Germany.
5.2 Export/import balances Comparing ref2010 and wind2010, Norway increase its export with wind power. There are few thermal units that will reduce its production. However, some dispatch able loads (oil/electric boilers) will increase the consumption of electricity because of the drop in spot prices. Norway, Sweden and Denmark increase their export to Germany both through direct transmission lines and via Denmark. The
4.3 Wind scenario 2010, wind2010 In this scenario, a total of 12.5 TWh of wind energy is added to the ref2010 scenario. 3 TWh in Norway according to [3], 4 TWh in Sweden [1], 1 TWh in Finland [4] and 4.5 TWh in Denmark, giving a total of 8 TWh in Denmark and 16 TWh in the Nordic market area as a whole. The only difference between ref2010 and wind2010 is the addition of new wind energy.
5. SIMULATION RESULTS 5.1 Energy value The energy value from wind energy for thermal dominated systems is usually estimated as the avoided costs of energy when wind power is introduced. In a deregulated market, this will be the sum of area A1, A2, A3 in figure 3. The avoided costs are the reduced production costs from the various thermal units substituted by wind energy.
ref1999a
Simulated spot price Nor Swe Den 2.3 2.2 2.1
Fin 2.1
ref2010 wind2010
3.7 3.5
3.6 3.5
Scenario
3.8 3.6
3.4 3.3
Table 1: Average spot prices in euro cents (2000) for a year with normal hydro inflow. (1 euro=8 NOK 2000) a. Note that spot prices are given as mean values for realisations of 30 years of wind- and hydrological inflow data For comparison, the spot price in the Nordic market is currently 1.25 euro cents/kWh (Sept., 2000), because year 2000 has been a typical wet year.
1. 3.5 TWh corresponds to approximately 1750 MW of wind power when a year of “normal” wind conditions in Denmark is used.
Changes in export(+)/import (-) Nor
Swe
Den
Fin
Ger
5.0 4.0 1.9
3.0 2.0
TWh/y
1.0 0.0 -1.0
0.7 0.2 0.9 0.6
1.1
2.3
0.9 -0.6
-0.2 -0.9
-1.1
-0.9
-2.0
-0.7 -1.9
Ger Fin Den Swe Nor
-3.0 -4.0
-2.3
-5.0 -6.0
Figure 5 Changes in export/import due to wind energy. Export (+) and import (-) are changes between ref2010 and wind2010 scenarios, that is the resulting changes caused by wind energy. Export and import changes are also subdivided into export/import to the different countries, i.e. Sweden increase imports from Norway by 0.6, while export to Germany, Finland and Denmark is increased by 1.9, 1.1 and 0.9 TWh respectively export to Finland is also increased. To conclude, the increased amount of wind energy in wind2010 mainly replace production from thermal units in Finland and Germany as a result of price changes between the different areas in the EMPS model. 5.3 CO2-reductions A comparison between ref2010 and wind2010 shows that wind power helps reducing CO2-emissions in total. But increasing the share of renewables does not necessarily reduce national emissions, if the utilities are allowed to operate in the liberalised market. From an environmental point of view, the location of CO2-reductions are unimportant. But for making efficient environmental policies on a national level, these facts should be considered. Figure 6 shows CO2-emissions for each scenario. For Germany, negative numbers show CO2-reductions due to export from the Nordic countries relative to the ref1999 scenario. The big difference between ref1999 and the 2010-scenarios shows the effect of the CO2-tax, the conversion from coal to gas according to Energy 21 action plan, and the extended use of CHP plants using renewables and gas in Denmark and Sweden as described in section 4.2. The difference between ref2010 and wind2010 shows that CO2-reductions are mainly obtained in Germany and Finland by 4.3 and 1.7 MtC/y respectively. Smaller reductions in Sweden and Denmark are obtained. In total 12.5 TWh of wind energy in 2010 reduce the CO2-emissions by 6.8 Mt, which gives
WIP-Renewable Energies, Sylvensteinstr. 2, D-81369 München, Germany. Tel: +49-89-720 12 32
energy in Norway, Denmark, Sweden and Finland respectively. On average, wind energy replace 540 tC/GWh of energy produced.
CO2-emissions ref1999
ref2010
wind2010
8. ACKNOWLEDGEMENTS
60
The studies were conducted as a part of the “Ny fornybar energi i Norge” - project at Sintef Energy Research, financed by the Norwegian Research Council.
50 40
16.2
30
Mt CO2
8.9
16.7
15.0
20 10
21.2
0
0.9
-10
3.6
3.5
12.2 1.8
11.6 1.8
-19.8
9. REFERENCES To Ger (-) Fin Swe Den Nor
-24.1
-20 -30
Figure 6 CO2-emissions in absolute values for Norway, Sweden, Denmark and Finland. For Germany, the values are reductions relative to ref1999 due to imports from the Nordic countries an average reduction of 540 tC/GWh of wind energy. For comparison, coal, oil and gas fired units emit approximately 800, 650 and 430 tC/GWh respectively.
6. DISCUSSION In the EMPS model, the operation of units are scheduled using marginal production costs, with constraints on heat production. In practice, utilities may schedule their units differently due to other constraints and considerations. Firstly, information on marginal costs are estimates, because marginal production costs are confidential. Secondly, other constraints may change the merit order of units, for instance, take-or-pay contracts on gas reduces the utility’s flexibility of production. The linear description of transmission capacity between areas underestimate marginal grid losses. The Samlast simulation tool add load flow calculations to the EMPS model, and experience from this tool shows that hydropower scheduling will be changed significantly. When studying the effect of small (marginal) additions of new wind energy, these uncertainties severely influence the results, but they become less important with larger additions of wind energy. We added 12.5 of wind energy in the Nordic market area, which is considered as a minimum for obtaining reliable results. However, the results does show the principal mechanism that are into play when new sources of production are introduced.
7. CONCLUSION The energy value (cost avoidance) of wind energy was for the wind2010 scenario estimated to 3.6 euro cents/kWh, approximately 7% higher value than the average spot price that scenario. Market coordination of power scheduling makes it difficult to trace marginal changes in production. It was shown that adding 12.5 TWh of wind energy in 2010 changes the export/import balance between the nordic countries in favor of exports to Finland and Germany. CO2-emissions were in total reduced by 6.8 Mt, mainly in Germany and Finland resulting from 3, 4.5, 4 and 1 TWh of new wind
[1] Energimyndighetens arbete med omställningen av energisystemet, Sverige, 1999. [2] NUTEK (1997), Climate Report 1997, Sweden [3] Ministry of Energy and Environment (1996), Energy 21 The Danish energy action plan. [4] Action Plan for Renewable Energy Sources. Ministry of Trade and Industry Publications 4/1999, Helsinki, Finland. [5] Report to the Storting No. 29 (1998-99): on Norwegian energy policy (unofficial English transl) [Online] Available: http://odin.dep.no/oed/engelsk/p10002017/indexb-n-a.html [01.10.2000] [6] Flatabø, N. et al. (1988) “EFI’s Models for Hydro Scheduling”, SINTEF technical report No. 3483. [7] Fosso, O.B., Gjelsvik, A., Haugstad, A., Mo, B., Wangensteen, I. (1997) Generation scheduling in a deregulated system. The Norwegian case. IEEE transactions on power systems PE-229-PWRS-0-11-1997. [8] J.O.G. Tande, Vogstad, K. (1999) Operational implications of wind power in a hydro based power system. Proceedings European Wind Energy Conference, 1.5.3.1999, Nice, France. [9] Vogstad, K. (2000) Utilising the complementary charateristics of wind power and hydropower through coordinated hydro production scheduling using the EMPS model. Proceedings, Nordic Wind Power Conference, March 2000, Trondheim, Norway. [10]L.Söder. Vindkraftens effektvärde. Elforsk report 1997:27. Stockholm, 1997. [11]Vogstad, K. (2000): Homepage [Online] Available: http://www.stud.ntnu.no/~klausv [01.10.2000] [12]Sähkömarkkinat 2015. Report by Finnish Energy Industries Federation Finergy, Helsinki, 2000.http:// www.energia.fi/finergy/ [13]Elmarknaden 2000. Report by Swedish National Energy Administration, 2000.http://www.stem.se/ [14]http://www.nordel.org/
10.APPENDIX Supply Hydro [TWh] Wind Power [TWh] Nuclear, [MW] CHP central [MW] CHP district [MW] CHP ind [MW] Condense [MW] Gas turb. [MW] Demand [TWh]
Nor 115 -
0 400 120 123
ref1999 (plain) ref2010 (bold) Swe Den 63 3.5 3.5 9450 8850 1280 4800 570 5220 980 2100 1916 1590 840 820 435 2400 0 195 70 143 34 152 37
Fin 14.5 2610 3810 2500 2750 730 2100 1550 1750 3760 1450 73 85
Table 2: Summary of consumption and production data in the EMPS model for ref1999 and ref2010.
WIP-Renewable Energies, Sylvensteinstr. 2, D-81369 München, Germany. Tel: +49-89-720 12 32


![Wind Power Integration, negative Prices and Power System Flexibility ... [PDF]](https://m.moam.info/img/260x300/wind-power-integration-negative-prices-and-power-s_647a32f5098a9e8f5f8b4637.jpg)