tion or faced by seemingly unstoppable invasion [4], and social systems such as the final Qing dynasty in China which went through 70 years of disastrous ...
i
i “new” — 2016/8/3 — 18:52 — page 1 — #1
i
i
System crash as dynamics of complex networks Yi Yu, ∗ Gaoxi Xiao, Schellnhuber k
∗
†
Jie Zhou,
‡
Yubo Wang,
∗
Zhen Wang,
§
¶
J¨ urgen Kurths,
k
∗∗
††
and Hans Joachim
∗
School of Electrical and Electronic Engineering, Nanyang Technological University, 50 Nanyang Avenue, Singapore 639798,† Complexity Institute, Nanyang Technological University, Singapore,‡ Department of Physics, East China Normal University, Shanghai, China 200241,§ Department of Physics, Hong Kong Baptist University, Kowloon Tong, Hong Kong,¶ Interdisciplinary Graduate School of Engineering Sciences, Kyushu University, Kasuga-koen, Kasuga-shi, Fukuoka 816-8580, Japan,k Potsdam Institute for Climate Impact Research (PIK), 14473 Potsdam, Germany,∗∗ Department of Physics, Humboldt University, 12489 Berlin, Germany, and †† Institute for Complex Systems and Mathematical Biology, University of Aberdeen, Aberdeen AB24 3UE, United Kingdom Submitted to Proceedings of the National Academy of Sciences of the United States of America
Complex systems, from animal herds to human nations, sometimes crash drastically. While the growth and evolution of systems have been extensively studied, our understanding of how systems crash is still limited. It remains rather puzzling why some systems, appearing to be doomed to fail, manage to survive for a long time; while some other systems, which seem to be too big or too strong to fail, crash rapidly. In this contribution, we propose a network-based system dynamics model, where individual actions based on the local information accessible in their respective system structures may lead to the “peculiar” dynamics of system crash mentioned above. Extensive simulations are carried out on synthetic and real-life networks, which further reveal the interesting system evolution leading to the final crash. Applications and possible extensions of the proposed model are discussed. complex systems
|
system crash
|
pseudo-steay state
|
cascade behavior
Systems emerge and grow up, and naturally, systems die. While extensive studies have been carried out on the growth and evolution of various complex systems, in many cases adopting complex network-based approaches (e.g., [1, 2]), hardly any similar studies exist on system crash. As a special type of system evolution, system crash however defies straightforward description by any of the existing models of system evolution to the best of our knowledge. A few important observations of system crash remain puzzling and require careful study: (i) Some “inferior” or “outdated” systems, though appearing to be doomed to fail, may survive for a very long time. Examples include “living fossils” such as coelacanths which have survived for more than 80 million years [3], some depleted-but-not-eliminated species under competition or faced by seemingly unstoppable invasion [4], and social systems such as the final Qing dynasty in China which went through 70 years of disastrous defeats and rebellions with surprising robustness until its sudden termination in 1911 [5], etc. We term such systems as being in a pseudo-steady state before their final crashes. (ii) Systems which appear to be too big or too strong to fail sometimes crash rapidly. Well-known examples include the crashes of various ecological and biological systems, which in some cases occur much faster than expected [6, 7] or even for no obvious reason [8, 9]. Similar phenomena exist in human society, e.g., the sudden crash of the Soviet Union [10], and the crash of the once biggest online social network (OSN), Friendster, in less than one year [11], etc. To help understand the crashes of ecological [6, 7, 12], biological [8, 9], neurological [13], physical and cyber-physical [14], economic [15, 16], social [5, 10, 11] and many other complex systems, new modeling approaches to describe the process and dynamics of a system crash are needed. Some relevant studies, though not focusing directly on system crash, may help in understanding a few aspects of system crash or system crash under some special cases, and are hence worth mention. The largest class of relevant studies is probably those on herd behavior, which refer to system behavior where individuals in a group act collectively without central-
www.pnas.org — —
ized control [17, 18, 19, 20, 21, 22]. For example, conformity theories [17], which focus on exploring the mechanism leading to uniform behavior, may help to explain a sudden crash when (and only when) most individuals are close to the borderline between alternatives; informational cascade theories [18, 19] point out that if individuals follow the behavior of the preceding individuals without regarding their own information, a big shift in the system may be caused by a small shock; and studies on lock-in effects and switching cost [20, 21], which evaluate effects of the cost that individuals have to pay to change a choice, may help explain the existence of a pseudo-steady state. Such studies however have their respective limitations: conformity theories in themselves cannot explain how individuals get close to the borderline; informational cascade theories may not work well for system crashes where individuals do not easily disregard their own information; and the critical question of how individuals overcome the lock-in effects in the system crash remains largely open. While most of the above studies have largely ignored effects of the underlying structures of connections [22], an important trend in research on complex systems is to study them in the content of various complex networks. The most notable studies which combine system crash dynamics and network analysis are probably those on k-core cascade theory [11, 23]. Specifically, the k-core of a network is defined as the maximum subset of the network where each node is connected to
Significance System crash, as an essential part of system evolution, sometimes happen in peculiar manners: weakened systems may survive for a surprisingly long time before suddenly meeting their final ends, while seemingly unbeatable giants may drastically crash to virtual nonexistence. We propose a model which describes system crash as a consequence of some relatively simple local information-based individual behaviors: individuals leave networks according to some most straightforward assessment of current and future benefits/risks. Of note, such a simple rule may enable a single push/mistake to cause multi-stage-style system crash. Our study helps to make sense of the process where complex systems go into unstoppable cascading declines and provide a novel viewpoint of predicting the fate of some social/natural systems.
Reserved for Publication Footnotes
PNAS
Issue Date
Volume
Issue Number
1–1
i
i i
i
i
i “new” — 2016/8/3 — 18:52 — page 2 — #2
i
at least k other nodes in the same subset. Assume that a network node with fewer than k connections may have a chance to leave the current system (e.g., an OSN user may need to have a large enough number of connections to justify the effort of staying on [11]). Measuring the k-core of a network therefore estimates how many nodes may stay on when the value of k increases due to various reasons. This theory, however, can only explain a sudden system crash when there exists a big jump in the value k due to some special reasons. Other interesting developments include (i) system crash model based on node energy level and inter-nodal energy transfer [24]; and (ii) network-based ranking of the extinction risks of different species in food webs or mutualistic networks [12], etc. Altogether, though various theories have been developed in different areas of science to make sense of abrupt changes in complex systems, what is still lacking is a system dynamics model that could properly describe a system crash, including the pseudo-steady state in some cases, as evolution of the system dynamics in their respective system structures. Note that the system crash discussed in this contribution is different from the cascading failure of a complex system or multiple interdependence systems discussed in the literature [25, 26], where components of the system(s) are strongly coupled and the sequence of a cascading failure is mainly decided by such coupling effects, e.g., failure of a node A may lead to failure of its strongly-coupled neighboring node B, but not another weakly-coupled neighboring node C. In this contribution, we propose a complex network-based model for describing the process and dynamics of a system crash, and the pseudo-steady state in some cases as well. Specifically, the proposed model is as follows: given a complex network, each network node may leave the network at a certain probability either (i) when the node has fewer than ks connections, in which case it may not have enough support or benefit to stay on; or (ii) when the node has lost more than a certain proportion (denoted by q) of its neighbors, in which case it may become a more attractive option to leave the current system, either to lower/avoid the risk (e.g., to avoid becoming a victim of a sudden system/herd crash) or to join another system with a more promising future. As we see, in this model, the first part reflects a value/risk assessment of the present situation; while the second part measures the effects of a relatively simple counting-based “copying” action, which may be a result of certain calculations and predictions of the risk, benefit and/or future developments of the system. We term this model the KQ-cascade model. Note that the KQ-cascade model is substantially different from the k-core based model in [11]; and it is also different from the threshold model in [27, 28], which generally assumes that nodes leave
i
when they lose q proportion of neighbors, with a main focus on analyzing the threshold value of q in causing a global crash after a trivial or random proportion of nodes are initially removed. The KQ-cascade model includes the latter two models as special cases (hereafter denoted the k-cascade and q-cascade models respectively), but it leads to much more complex dynamics. For example, though it is difficult to provide a rigid proof, in our extensive numerical simulations on various synthetic and real-life networks, neither the k-cascade model nor the q-cascade model has ever allowed the emergence of the pseudo-steady state. The proposed model is tested on various synthetic and reallife networks. Considering the increasing importance of OSNs and the relative easiness in getting the data of OSN structures, the testing on real-life networks will mainly focus on OSNs, though the proposed model certainly applies to many different kinds of complex systems. For the well-known case of the Friendster’s quick crash, where there exists relatively abundant data on the whole process [11], we perform individualbased simulations to mimic the actions of each individual. A good match is achieved with some interesting insights.
Results The KQ-cascade model. We start with an original network G(V, E), where V is the set of vertices and E the set of edges. To keep the KQ-cascade model simple, we introduce only two key parameters: the critical degree ks and the loss-tolerance coefficient q. In the ith time step, any node with a degree k < ks or having lost more than q proportion of its original connections may leave the network with a probability fi (k). An example of the KQ-cascade model is illustrated in Fig. 1. Note that the classic k-core cascading can be viewed as a special case of the KQ-cascade where fi (k) = 1 for k < ks and fi (k) = 0 otherwise. As mentioned above, the value of ks quantifies the minimum support or benefit an individual needs to have to justify staying in the system: a less user-friendly OSN, for example, may lead to a higher ks value. The value of q, on the other hand, reveals the individuals’ risk tolerance level or the prospect on the future of the system they are staying in: a lower value of q reveals a lower risk tolerance or a less positive prospect; for those cases with competition between different systems, it may reveal a higher competition pressure from the competitor(s) as well. In real life, the value of the aggregated parameter q may be affected by many factors, e.g., risk tolerance level, switching cost, absolute/relative group size, and various environment factors, etc. Theoretical analysis on network evolution. Under the KQ-cascade, a network may demonstrate a phase transition
fra c tio n o f n o d e s re m a in in g
1 .0
Fig. 1. Schematic illustration of KQ-cascade with ks = 3 and q = 0.5. In a classic k-core cascade, the 4 nodes within the yellow square forming up a 3-core would stay on while other nodes would leave. In the KQ-cascade, however, since node 1 has lost more than 50% of its original neighbors, it will leave in the next time step, which leaves each of the 3 nodes within the blue triangle with fewer than 3 connections, leading to the final crash of the network.
2
www.pnas.org — —
E R : k s= 1 4 , q = 0 .1 , f= 0 .2 S F : k s= 6 , q = 0 .5 , f= 0 .1
0 .8
E x p : k s= 8 , q = 0 .1 8 , f= 0 .2 S F : k s= 6 , q = 0 .3 , f= 0 .2
0 .6 0 .4 0 .2 0 .0 0
2 0
4 0 6 0 8 0 1 0 0 tim e s te p Fig. 2. KQ-cascade in various networks. Comparison between analytical (lines) and simulation (symbols) results for KQ-cascade in different networks with size N = 104 .
Footline Author
i
i i
i
i
i “new” — 2016/8/3 — 18:52 — page 3 — #3
0 .2
0
5
1 0 k s
Fig. 3. Threshold of KQ-cascade.
1 5
2 0
Comparison between analytical (lines) and simulation (symbols) results of cascade thresholds in different networks 4 with size N = 10 . Both analytical and simulation results are obtained by adopting a trial-and-error approach, where for each given ks the value of q is increased by a step length of 0.01 until the threshold value is obtained.
k s= 6 , q = 0 .4 6 , f= 0 .1 k s= 1 0 , q = 0 .4 6 , f= 0 .5 k s= 1 0 , q = 0 .2 4 , f= 0 .1
0 .6
k s= 1 0 , q = 0 .0 9 , f= 0 .1
0 .4 0 .2
a
0 .0
b
0
2 0
4 0 6 0 tim e s te p
8 0
1 0 0 0
5 0
1 0 0
1 5 0 2 0 0 tim e s te p
2 5 0
3 0 0
Fig. 4. Pseudo-steady state and sudden crash. (a)
Comparisons between theoretical and simulation results of 10 independent realizations in scale-free networks with the same parameters yet different seeds for random number generation: ks = 4, q = 0.29, f = 0.2. (b) Simulation results showing the pseudo-steady state and sudden crash in different systems: Orkut (stars), Scale-free (triangles), LiveJournal (diamonds), Exponential (circles) and ER random (squares).
s iz e o f la rg e s t v u ln e ra b le c lu s te r
th
q 0 .4
Footline Author
0 .8
1 .0 k s= 1 4 , q = 0 .3 7 , f= 0 .1
0 .8
k s= 1 4 , q = 0 .3 8 , f= 0 .1
0 .6 0 .4 0 .2
a
0 .0 0
2 0
E x p
0 .6
0 .0
k s= 2 0 , q = 0 .3 , f= 0 .5 s im u la tio n re s u lts th e o re tic a l re s u lts
fra c tio n o f v u ln e ra b le n o d e s
E R S F
0 .8
1 .0
4 0 tim e s te p
6 0
0 .0 8 k s= 1 4 , q = 0 .3 7 , f= 0 .1
0 .0 6
k s= 1 4 , q = 0 .3 8 , f= 0 .1
0 .0 4 0 .0 2
c
0 .0 0 0
2 0
4 0 tim e s te p
6 0
0 .1 2 k s= 1 4 , q = 0 .3 7 , f= 0 .1
0 .0 9
k s= 1 4 , q = 0 .3 8 , f= 0 .1
0 .0 6 0 .0 3
b
0 .0 0
8 0
8 0
0
a v e ra g e v u ln e ra b le c lu s te r s iz e
1 .0
i
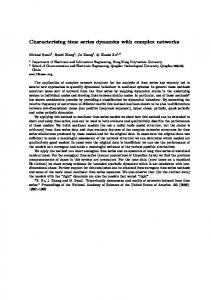
appear to be rather stable with only a few nodes leaving in each time step. After a long period of time, however, the systems suddenly crash, sometimes within only a few steps. In some systems, e.g., LiveJournal, the pseudo-steady state may even appear more than once (more details will be discussed later). Note that when q gets close to qth , the specific time when the crash starts can be rather sensitive to small fluctuations in the network structure. An example is given in Fig. 4(a), where we show results in 10 random networks with the same parameters but different seeds for random number generation. Therefore, in this section, we shall only present our results for a single simulation case. We reveal that the pseudo-steady state and sudden crash of the networks are caused by the emergence, growth and final crash of a giant cluster composed of vulnerable nodes, where a vulnerable node is defined as the node which will fulfill the conditions of leaving the network if it loses one more neighbor. It is known that the vulnerable clusters composed by connected vulnerable nodes play an important role in a global cascade [27] as the departure/loss of a single node in such a
fra c tio n o f n o d e s re m a in in g
of cascade size, measured by the fraction of network nodes finally remaining in the network, under different values of ks and q: it may either crash into virtual nonexistence or have a non-trivial proportion of nodes remaining in the steady state. A theoretical analysis on the network evolution under the KQ-cascade, which allows an accurate prediction of such a phase transition in random networks by reproducing the whole procedure of the cascade, has been developed. The main idea of the analysis is presented in the Methods section, while further details can be found in Supplementary Note 1. To illustrate the accuracy of the analysis, we present analytical solutions versus simulation results averaged over 100 independent realizations (details for implementing these independent realizations are given in the Methods section) for the following paradigmatic random networks: an Erd¨ os-R´enyi (ER) network [29] with an average nodal degree z = 20; an exponential (Exp) network with an average degree z = 20 and a degree cut-off of 100; and a scale-free (SF) network [30] with γ = 2, a minimum degree of 3 and a degree cut-off of 100 [31]. All three types of networks are generated using the configuration model [31] with size of N = 104 . For simplification, we assume that in each time step, individuals fulfilling the conditions to leave may decide to do so with a constant probability f , which may be viewed as a special case of the leaving probability fi (k). As we observe in Fig. 2, the proposed theoretical analysis accurately predicts the evolution of the network size in all these cases. The accurate prediction of the network dynamics also allows us to calculate the threshold value of q leading to the network crash, denoted as qth , by adopting a simple trial-anderror approach, as illustrated in Fig. 3. The thresholds of some real-life networks, presented in Fig. S1, and related discussions can be found in Supplementary Note 2. Further results of the proposed analysis in predicting the cascade process are given in Figs. S2-S7 in Supplementary Note 3. Simulation results showing how the degree distribution affects the resilience and cascade size (i.e., fraction of the remaining nodes) of random networks are presented in Figs. S14-S20 in Supplementary Note 4. Analytical and simulation results for the case where decline of a system shakes the individuals’ confidence, leading to an accelerated system crash [32] are reported in Supplementary Note 5. Pseudo-steady state and sudden crash. We find that the proposed model enables the occurrence of the pseudo-steady state and a sudden crash of the systems. A few such cases in both random and real-life networks are illustrated in Fig. 4. As we can see that, in the pseudo-steady state, the networks
fra c tio n o f n o d e s re m a in in g
i
2 .5
2 0
x 1 0
-3
4 0 tim e s te p
6 0
2 .0
k s= 1 4 , q = 0 .3 7 , f= 0 .1
1 .5
k s= 1 4 , q = 0 .3 8 , f= 0 .1
8 0
1 .0 0 .5
d
0 .0 0
2 0
4 0 tim e s te p
6 0
8 0
Fig. 5. Evolution of the vulnerable clusters. Evolution of (a) network size; (b) overall size of vulnerable nodes; (c) the size of the largest vulnerable cluster; and (d) the average size of all the vulnerable clusters in the random exponential network. PNAS
Issue Date
Volume
Issue Number
3
i
i i
i
i
i “new” — 2016/8/3 — 18:52 — page 4 — #4
4
www.pnas.org — —
i
ulation study shows that in networks with fixed nodal degrees, multi-stage pseudo-steady state vanishes with the elimination of the community structures and degree correlations. Details are reported in Supplementary Note 7. Cascade decline of Friendster: a possible explanation. The crash of Friendster offers an interesting case with relatively abundant data. In a recent study [11], it was found that if we adopt the simple k-cascade model and let the threshold value of k increase continuously from 3 in July 2009 to 67 in June 2010 at a rate of about 6 per month, a good match between simulation results and historical records of Friendster’s crash could be achieved. A puzzling question remains, however: while it is known that Friendster made a fatal mistake in 2009 when it changed its website interface, making it more difficult to use and hence increasing the threshold value ks , it is not clear how this threshold value could have gone up continuously when Friendster did not make a second mistake. We apply the proposed cascade model to the Friendster network which consists of 65,608,366 nodes and 1,806,067,135 connections [11]. As obtaining the exact number of Friendster users over time is difficult, following the work in [11], we use the Google search volume to approximate the popularity evolution of Friendster. Specifically, the curve is still figured by obtaining the search volume of “www.friendster.com”. Two reference points are set, one in June 2009 when Friendster began to decline as users were not happy with the changed interface (probably also due to the fast growth of Facebook) [11], and the other in July 2010 when Friendster was reported to have only about 10 million active users left, less than 10 percent of its peak size. A trial-and-error approach shows
Fig. 6. Cascade size of a few real-life networks.
Cascade size of: (a) Orkut online social network; (b) LiveJournal online social network; and (c) YouTube network. The cascade size is shown in color scale.
G o o g le s e a rc h in d e x
cluster may trigger the cascading departure/loss of the whole cluster, which may further result in the crash of the entire system. It is, however, shown for the first time to the best of our knowledge that a basic rule for leaving can lead to the emergence of a giant vulnerable cluster in complex networks. Figure 5 illustrates in more detail the growth and decline of vulnerable clusters. The simulations are carried out on a random exponential network as defined earlier. To make comparisons, we choose two sets of parameters: ks = 14, q = 0.37, f = 0.1 and ks = 14, q = 0.38, f = 0.1. While q = 0.37 leads to a network crash, q = 0.38 allows the network to survive; choosing such parameters thus enables us to closely observe a phase transition of the system. We find that for the case where the network finally crashes, the number of vulnerable nodes slowly accumulates during the pseudo-steady state (see Fig. 5(b)). The average relative size of all the vulnerable clusters meanwhile remains between 10−4 and 2 × 10⁻⁴ , meaning having only 1 or 2 nodes (see Fig. 5(d)). This shows that most vulnerable clusters are tiny pieces scattered within the network. The size of the largest vulnerable cluster also remains rather small most of the time (see Fig. 5(c)). Shortly before the sudden crash starts, however, there is a sharp increase in the size of the largest vulnerable cluster (see Fig. 5(c)), when vulnerable clusters quickly connect together (see Fig. 5(d)). At the moment when a sudden crash starts, almost all the vulnerable nodes merge into a single cluster. For example, in the 69th time step, among 683 vulnerable nodes, 632 of them merge into the largest vulnerable cluster. The sudden emergence of the giant vulnerable cluster prepares a sufficient condition for the sudden crash to be easily triggered. Measuring the resilience of some real-life systems against the KQ-cascade. It is interesting to evaluate the resilience of a few real-life systems against the KQ-cascade. In this section, we report numerical simulation results on three different OSNs, namely, the Orkut, LiveJournal, and YouTube networks, respectively [33]. A summary of the basic information on these networks can be found in the Methods section. Figure 6 shows the dynamics of the cascade size in these networks with different values of ks and q. It is interesting to observe that Orkut demonstrates the strongest resilience against the KQ-cascade among the three networks, while YouTube turns out to be the most fragile one. The conclusions, however, have to be taken with a pinch of salt since, as always, the data we have only reflects a fraction of the corresponding real-life networks and it is not known how the network sampling was done at the first place. Some discussion of how much evaluating the resilience of a random sampling of a complex network may help to reveal the resilience of the whole system is presented in Supplementary Note 6. Another interesting observation is that in real-life networks, there may be multi-stage phase transitions of the cascade size: the cascade size may go through multiple pseudo-steady states before the final crash. This, however, has never been observed in our extensive simulations on uncorrelated random networks. We believe that such phenomena are related to community structures [34] and degree correlations [35] existing in real-life networks. For example, the cascading departure/loss of a large number of individuals may have barely any impact on certain communities with dense intra-community connections. It may be worth mentioning that such observations have been made in many OSNs: Friendster’s popularity was not significantly affected in Southeast Asia, especially the Philippines, throughout its fast decline; Orkut was especially popular in Brazil; and LiveJournal has 52 percent of customer visits from Russia [36]. A related result in [37] reports that in a loosely coupled twocommunity network, system cascade may have two peaks in the two communities respectively, separated in time. Our sim-
u s e rs re m a in in g
i
1 0 0 8 0 6 0 4 0 2 0
F rie n d s te r F a c e b o o k
a 0
D e c .0 6 1 .0 0 .8 0 .6 0 .4 0 .2 0 .0
N o v .0 8
O c t.1 0 tim e
S e p .1 2
A u g .1 4
G o o g le s e a rc h v o lu m e R e s u lts o f th e p ro p o s e d m o d e l
b F e b .0 9
M a y .0 9
A u g .0 9
N o v .0 9 tim e
F e b .1 0
M a y .1 0
A u g .1 0
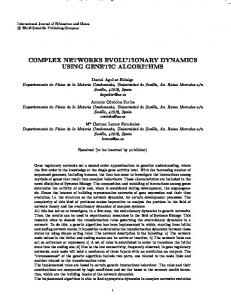
Fig. 7. Cascade decline of the Friendster. (a) Comparison between the Google search volumes of “Friendster” and “Facebook”. In January 2009, the search index of “Facebook” was 27 while for “Friendster” it was 1. (b) The monthly Google search volume for “www.Friendster.com” (triangles) and simulation results adopting the proposed model (circles). The size of 1 corresponds to the user size at the peak time (excluding those users with zero degree) which was about 68 millions. Decline started at a size of 0.94 (i.e., 64 millions) in June 2009 and stopped at a size of 0.15 (about 10 millions) in June 2010.
Footline Author
i
i i
i
i
i “new” — 2016/8/3 — 18:52 — page 5 — #5
i
that, when we set ks = 20, q = 0.2 and f = 0.15, simulation results based on the proposed model match well with the reallife data (see Fig. 7). Note that, as mentioned above, for those cases where systems crash mainly due to strong competition, a smaller value of q may imply a higher competition pressure from a stronger competitor. Though q = 0.2 may appear to be quite a low value, adopting such a value is not without basis: even when Friendster was still at its peak user size in 2009, the Google search volume of “Facebook” was already more than 20 times higher than that of “Friendster” [38], as illustrated in Fig. 7(a). People thus may have had good reason to believe, back in 2009-2010, that though Friendster was larger, Facebook would certainly boom (and such belief helped Facebook actually to boom). Also note that, at that time, many users may have registered their accounts in both Friendster and Facebook; leaving Friendster at q = 0.2 therefore did not necessarily mean that they had to lose 80% of their online social connections; instead, it might only have meant getting rid of some inconveniences once for all. With only a snapshot showing the aggregated connections of all the ever-existing users until the moment the snapshot was taken, it is not a surprise that we have to adopt a trial-anderror approach to estimate the ks and q values. Nevertheless, it is encouraging to see that without making the assumption that the ks value increases over time, a good match between simulation results and real-life data can be achieved. When detailed data showing network topology in different stages of system decline is available, our model may allow a more accurate estimation of parameter values and consequently, a more accurate reflection/prediction of system dynamics.
i
subject to certain constraints. For example, there may be an upper bound to the penetration level of grid-tied photovoltaic power [40]. Certain policies therefore may have to be installed to restrict the adoption of the technology. Predicting whether adopting such policies might result in decline or even crash of the technology adoption is of significant importance. It would also be of future research interest to figure out how much a model of system crash dynamics might help to identify tipping points of a system [41, 42], and to model system dynamics when individuals’ decisions to leave involve certain kinds of more sophisticated Bayesian reasoning [43].
Methods Theoretical analysis: main idea. The main idea of the theoretical analysis is to model the degree transition in every step as a Markov process: by taking each pair of originalcurrent nodal degrees as a state and calculating the state transition in each time step, we can reproduce the evolution process of the network. Specifically, we construct (i) a dei gree transition matrix Di where the element Djk denotes the probability that a node with an original degree j becomes a degree-k node at the beginning of the ith time step; and (ii) a i matrix U i where the element Ujk denotes the probability that a node with an original degree j has a degree k at the beginning of the ith time step and it does not leave the network in this time step. We have i i Ujk = Djk µ(k, j),
Discussion In this work, we have introduced a network-based system dynamics model for describing the crash of complex systems and the pseudo-steady state in some cases. In the proposed model, a network node may choose to leave either when the number of connections it has becomes too low, or when it has lost more than a certain proportion of its neighbors. We have derived a theoretical analysis for the crash process on a random graph with an arbitrary nodal degree distribution and an arbitrary leaving probability. Based on the proposed model, a pseudo-steady state and sudden crash phenomenon could be steadily observed in certain ranges of parameters and be easily explained. Further, the resilience of some real-life networks has been evaluated and a possible explanation for the sudden crash of Friendster has been presented. The proposed model may find wide applications in helping understand and predict the declines of various complex systems, especially complex social systems. Studies on such applications would be of future research interest, in particular: • Research areas may heat up and cool down. While “early
movers” may leave a research area when important work has been done or low-hanging fruit has been collected, many others may only make up their minds to leave when their colleagues are leaving (similar to q-cascade) or when they have lost their collaborators (similar to k-cascade). Dynamics of the decline of a research area needs to be studied. • Collective intelligence systems such as Wikipedia may have an increasing coordination cost when growing in scope [39]. Whether and how participants of a collective intelligence system may decide to leave due to increasing coordination cost are surely worth careful studies. • Decentralized adoptions of new technologies, such as voluntary installations of solar panels on house roofs, may be
Footline Author
[1]
where µ(k, j) reflects the probability that a node with an original degree j and a degree k at the beginning of the ith time step does not leave the system in this time step: � 1 k ≥ (1 − q)jandk ≥ ks , [2] µ(k, j) = 1 − fi (k) otherwise, where, as mentioned in the Results section, fi (k) denotes the probability that a node fulfilling the conditions to leave may actually leave the network in the ith time step. As some nodes will lose a proportion of their neighbors in the leaving process, their degrees need to be recalculated. Use the matrix T i to keep record of the transition within this time step, where Tki0 k denotes the probability that a node with a degree k0 at the beginning of the ith time step ends up with a degree k at the end of this step. The degree transition matrix Di+1 hence can be calculated as: Di+1 = U i T i . [3] The whole KQ-cascade process can be reproduced by iterative calculation of Eqs. [1] and [3]. The detailed calculations of these matrixes are discussed in Supplementary Note 1.
Table 1. Basic information of the networks evaluated in this article. Network name User number Link number source Friendster 65,608,366 1,806,067,135 [11] Orkut 3,072,441 117,185,083 [33] LiveJournal 3,997,962 34,681,189 [33] YouTube 1,134,890 2,987,624 [33] Gowalla 196,591 950,327 [44] These are network samples downloaded from the respective sources.
PNAS
Issue Date
Volume
Issue Number
5
i
i i
i
i
i “new” — 2016/8/3 — 18:52 — page 6 — #6
i
This analysis can be easily extended to a more general case where network nodes leave the network following an arbitrary criterion φ as long as the new criterion can be reflected by properly changing µ(k, j) in Eq. [2] accordingly. Such extensions would allow an easy coverage of a wide range of existing work, e.g., the classic k-core problem. Numerical simulations. For an easy reference, Table 1 summarizes the real-life networks adopted in the numerical simulations. Note that though the data of Friendster contains 117 million IDs, only 65 million of them have a connection record, as reflected in Table 1; the other 52 million IDs are for private users with confidential connection information. In both the synthetic and real-life networks, numerical simulations are carried out in the following steps: • Initialization: record the degree of each node as its orig-
inal degree. Set values of the parameters ks and q. • First time step: for any node with its original degree
lower than ks , remove it at a constant probability f . Update the record of each node’s degree as its current degree. • Iterations in the following time steps: check all nodes’ current degrees as recorded at the beginning of the time step. If a node has a current degree lower than ks or has lost more than q proportion of its original degree, it has a probability f to leave the network. The records of the nodes’ current degrees are only updated when all the nodes have decided whether to stay on or to leave, at the end of
1. Boccaletti. S., Latora, V., Moreno, Y., Chavez, M. & Hwang, D.-U. Complex networks: structure and dynamics. Phys. Rep. 424, 175-308 (2006). 2. Song, C., Havlin, S. & Makse, H. A., Origins of fractality in the growth of complex networks. Nature Phy. 2, 275-281 (2006). 3. Forey, P. L. History of the Coelacanth Fishes (Chapman & Hall, 1998). 4. Zhi, Y., Li, H., An, S., Zhao, L., Zhou, C. & Deng, Z. Inter-specific competition, Spartina alterniflora is replacing spartina anglica in costal China. Estuar. Coast. Shelf Sci. 74, 437-448 (2007).
i
each time step. Repeat the iterations until the network diminishes or no more nodes can leave the network. For each synthetic network with f < 1, we carry out 100 independent realizations: first we generate 10 random networks and then carry out 10 rounds of simulations on each of these networks. Unless otherwise specified, we present the average of these 100 independent realizations. When f = 1, in each of the 10 random networks, only a single round of simulation is needed. For the real-life networks, when f < 1, we also carry out 10 rounds of simulation and present the average results. Note that in all the figures, the error bars are rather small; hence they are omitted. Also note that different values of f only speed up or slow down the network evolution process; they have no influence on the crash threshold and the cascade size at the steady state. For the synthetic networks, we typically adopt small values such as f = 0.1 or f = 0.2 to generate smoother curves. For real-life networks, we let f = 0.5 to speed up the computation. ACKNOWLEDGMENTS. This work is partially supported by Ministry of Education (MOE), Singapore, under research grants RG 69/12, RG 28/14, MOE2013-T2-2-006 and MOE2014-T21-028. Part of this work is an outcome of the Future Resilient Systems project at the Singapore-ETH Centre (SEC), which is funded by the National Research Foundation of Singapore (NRF) under its Campus for Research Excellence and Technological Enterprise (CREATE) programme.
24. Dasgupta, K., Singh, R., Viswanathan, B., Chakraborty, D., Mukherjea, S., Nanavati, A. A., & Joshi, A. Social ties and their relevance to churn in mobile telecom networks. In Proceedings of the 11th International Conference on Extending Database Technology: Advances in Database Technology, 668- 677 (ACM, Nantes, France, 2008). 25. Buldyrev, S. V., Parshani, R., Paul, G., Stanley, H. E. & Havlin S. Catastrophic cascade of failures in interdependent networks. Nature 464, 1025-1028 (2010). 26. Saavedra, S., Stouffer, D.B., Uzzi, B. & Bascompte, J. Strong contributors to network persistence are the most vulnerable to extinction. Nature 478, 233-235 (2011).
5. Fairbank, J. K. & Liu K. C. The Cambridge History of China, Vol. 11: Late Ch’ing, 1800-1911, Part 2 (Cambridge University Press, 1980).
27. Watts, D. J. A simple model of global cascades on random networks. Proc. Nat. Acad. Sci. 99, 5766-5771 (2002).
6. Sahney, S., Benton, M.J. & Falcon-Lang, H.J. Rainforest collapse triggered Pennsylvanian tetrapod diversification in Euramerica. Geology 38, 10791082 (2010).
28. Hackett, A., Melnik, S. & Gleeson, J. P. Cascades on a class of clustered random networks. Phys. Rev. E 83, 056107 (2011).
7. Angus, I. & Butler, S. Too Many People? Population, Immigration, and the Environmental Crisis (Haymarket Books, 2011).
29. Erd¨ os, P. and R´ enyi, A. On random graphs, I. Publ. Math. Debrecen 6, 290-297 (1959).
8. Houlahan, J.E., Findlay, C.S., Schmidt, B.R., Meyer, A.H. & Kuzmin, S.L. Quantitative evidence for global amphibian population declines. Nature 404, 752758 (2000). 9. Stuart, S.N., Chanson, J.S., Cox, N.A., Young, B.E., Rodrigues, A.S.L., Fischman, D.L. & Waller, R.W. Status and trends of amphibian declines and extinctions worldwide. Science 306, 17831786 (2004). 10. Gaddis, J.L. The Cold War: A New History (Penguin Books, 2006). 11. Garcia, D., Mavrodiev, P. & Schweitzer, F. Social resilience in online communities: the autopsy of Friendster. In Proceedings of the first ACM conference on Online social networks, 39-50 (ACM, Boston, Massachusetts, USA, 2013). 12. Dom´ınguez-Garc´ıa, V. & Mu˜ noz, M. A. Ranking species in multualistic networks. Sci. Rep. 5 8182 (2015).
30. Barab´ asi, A.-L. & Albert, R. Emergence of scaling in random networks. Science 285, 509-512 (1999). 31. Catanzaro, M., Bogu˜ n´ a, M. & Pastor-Satorras, R. Generation of uncorrelated random scale-free networks. Phys. Rev. E 71, 027103 (2005). 32. Spanjers, W. Loss of confidence and currency crises. Int. J. of Econ. Res. 5, 219-237 (2008). 33. Yang, J. & Leskovec, J. Defining and evaluating network communities based on groundtruth. In Proceedings of the ACM SIGKDD Workshop on Mining Data Semantics, 1-8 (ACM, Beijing, China, 2012). 34. Newman, M. E. J. Modularity and community structure in networks. Proc. Nat. Acad. Sci. 103, 8577-8582 (2006). 35. Newman, M. E. J. Assortative mixing in networks. Phys. Rev. Lett. 89, 208701 (2002).
13. Wenning, G.K., Colosimo, C., Geser. F. & Poewe, W. Multiple system atrophy. Lancet Neurol. 3, 93103 (2004).
36. Alexa Traffic Rank for Livejournal.com. (Date http://www.alexa.com/siteinfo/livejournal.com.
14. Krishna, P. V., Saritha, V. & Sultana H. P. Challenges, Opportunities, and Dimensions of Cyber-Physical Systems (IGI Global, 2014).
37. Galstyan, A. & Cohen, P. Cascading dynamics in modular networks. Phys. Rev. E 75, 036109 (2007).
15. Sieczka, P., Sornette, D. & Holyst, J.A. The Lehman Brothers effect and bankruptcy cascades. Europ. Phys. J. B 82, 257-259 (2011).
38. Google Trend - Search Terms: Friendster vs. Facebook (Date of access: 30/11/2014) http://www.google.com/trends/explore#q=friendster%2C%20facebook&cmpt=q.
16. Podobnik, B., Horvatic, D., Lipic, T., Perc, M., Buld´ u, J.M. & Stanley, H.E. The cost of attack in competing networks. J. Royal Soc. Interface 12, 20150770 (2015)
39. Kittur A., Suh, B., Pendleton A. & Chi, E.H. He says, she says: conflict and coordination in Wikipedia. In Proceedings of the SIGCHI conference on Human factors in computing systems, 453-462 (ACM, San Jose, CA, USA, 2007).
17. Bernheim, B. D. A theory of conformity. J. Polit. Econ. 102, 841-877 (1994). 18. Bikhchandani, S., Hirshleifer, D. & Welch, I. A theory of fads, fashion, custom and cultural change as informational cascades. J. Polit. Econ. 100, 992-1026 (1992). 19. Chen, Y.-F. Herd behavior in purchasing books online. Comput. Human Behav. 24, 1977-1992 (2008). 20. Wilson, C. M. & Price, C. W. Do consumers switch to the best supplier? Oxford Econ. Pap. 62, 647-668 (2006). 21. Villas-Boas, J. M. A short survey on switching costs and dynamic competition. Int. J. Res. Marketing 32, 219-222 (2015). 22. Raafat, R. M., Charter, N. & Frith, C. Herding in humans. Trends Cogn. Sci. 13, 420-428 (2009). 23. Dorogovtsev, S. N., Goltsev, A. V. & Mendes, J. F. F. K-core organization of complex networks. Phys. Rev. Lett. 96, 040601 (2006).
6
www.pnas.org — —
of
access:
30/11/2014)
40. Eltawil, M.A. & Zhao Z. Gird-connected photovoltaic power systems: technical and potential problems - a review. Renewable and Sustainable Energy Reviews 14, 112-129 (2010). 41. Scheffer, M., Bascompte, J., Brock, W.A., Brovkin, V., Carpenter, S.R., Dakos, V., Held, H., van Nes, E.H., Rietkerk, M. & Sugihara, G. Early-warning signals for critical transitions. Nature 461, 53-59 (2009). 42. Dakos, V. & Bascompte, J. Critical slowing down as early warning for the onset of collapse in mutualistic communities. Proceedings of the National Academy of Science 11, 17546-551 (2014). 43. Baltag, A., Christoff, Z., Hansen, J. U. & Smets, S. Logical models of informational cascades. http://staff.science.uva.nl/ulle/teaching/lolaco/2013/papers/smets.pdf (2013).
Footline Author
i
i i
i
i
i “new” — 2016/8/3 — 18:52 — page 7 — #7
i
44. Cho, E., Myers, S. A. & Leskovec, J. Friendship and mobility: user movement in location-based social networks. In Proceedings of the 17th ACM SIGKDD International Conference on Knowledge Discovery and Data Mining, 1082-1090 (ACM, San
Footline Author
i
Diego, CA, USA, 2011).
PNAS
Issue Date
Volume
Issue Number
7
i
i i
i