SYSTEM DYNAMIC MODEL FOR THE PREDICTION OF URBAN ENERGY CONSUMPTION TRENDS Wee-Kean Fong1†, Hiroshi Matsumoto1, Yu-Fat Lun2, and Ryushi Kimura1 1
Department of Architecture and Civil Engineering, Toyohashi University of Technology, Toyohashi, Japan. 2 Department of Architecture and Building Science, Tohoku University, Sendai, Japan.
ABSTRACT With the increasing concerns on the issues of global warming, urban heat island and depletion of fossil fuels, energy saving effort is getting more and more important, particularly in the city context. Although there are a number of sectoral energy related studies, comprehensive overview of the overall energy use in cities is still not well understood. The purpose of this work is thus to study the urban energy consumption trends based on an integrated approach, using the System Dynamic model. The objectives of this study are to investigate the urban energy consumption trends, over a period of 50 years, under different urban growth scenarios, subsequently to understand the driving force and key elements of urban energy consumption, and finally to prioritize the future directions in urban energy saving researches. The adopted model was divided into four sub-models i.e. residential, commercial, industrial and transportation sub-models. The study found that economic growth rate and industrial energy consumption rate are the key elements in minimizing urban energy consumption toward sustainability. In addition, the result of this study indicated that lifestyle is vital to be taken into consideration as it is costless compared to other measures such as technology improvement, mass public transit system, etc. that require huge long-term investments.
KEYWORDS Urban energy consumption, System Dynamic Model
INTRODUCTION With the increasing concerns on the environmental issues such as global warming, urban heat island and depletion of fossil fuels, the importance of energy saving has been wide recognized. The most significant increase of energy consumption and greenhouse gas emissions is expected to take place in cities, where rapidly expanding populations enjoy higher living standards and material affluence. Although a number of research projects on sectoral energy use for industries, urban transportation and so on have been conducted, a comprehensive overview of energy consumption and CO2 emissions is still missing (IGES 2004). It is thus vital to increase the knowledge on energy use at the city level and to understand the driving forces behind it so that systematic mitigating actions can be implemented. This study is based on an integrated approach to study the urban embodied energy consumption of an Asian city, Johor Bahru of Malaysia using the System Dynamic Model (SD Model). The objectives of the study are to investigate the urban energy consumption trends, over a period of 50 years, under different urban growth scenarios, subsequently to understand the driving force and main indicators of urban energy consumption, and finally to prioritize the future directions of urban energy saving researches.
†
Corresponding Author: Tel: + 81 532 44 6838, Fax: + 81 532 44 6831 E-mail address:
[email protected]
THE URBAN ENERGY CONSUMPTION MODEL The case study was Johor Bahru city (District), Malaysia. It has a land area of 1,817 km2 and population of about 1,159,079 (year 2000 census). It was chosen for the case study as it is a typical medium size city that experiencing rapid economic growth and industrialization. It is necessary for this city to have a comprehensive urban energy consumption study so that energy sector can be integrated in the city’s long-term planning towards sustainable development. In this study, a computer programming software, STELLA, was used to construct the SD model for the complicated urban energy consumption system (hereinafter referred as ‘UEC Model’). The projection year under this study was up to year 2050. One way of looking at the future of urban energy consumption is to consider various trends in energy consumption at the end-user sector level. It is widely recognized that residential, commercial, industrial and transportation sectors are the major urban energy consuming sectors (Poudenx and Merida 2005, Uchiyama 2002) (cf. Figure 1). These four sectors were taken as four sub-model of the UEC model. These four sectors are interrelated with a number of variables such as population, economics, etc. and they were connected with each other by various equations and assumptions. The basic concept of energy stock flows in the UEC Model is illustrated in the basic causal loops under Figure 2.
Figure 1. Basic concept of UEC model Residential Sub-Model number of residential units
number of household
Commercial Sub-Model
TOTAL URBAN ENERGY CONSUMPTION
residential energy use
commercial sector GRP commercial energy use
tranport energy use
industrial energy use
private transport
industrial sector GRP
public transport
travel needs
Industrial Sub-Model Transportation Sub-Model
urban population
economic growth
Figure 2. Basic causal loops of UEC model
Residential Sub-model As shown in Figure 2, for the residential sub-model, the total energy consumption was assumed to be based on four main factors i.e. urban population, number of household, number of residential unit and residential energy consumption rate. The size of urban population is depending on the population growth rate. Higher population growth rate results in larger population size. The number of household is determined by two factors i.e. household size (number of family member within a household) and total population within the study area. The total number of household was obtained by dividing the population by household size. The actual housing stock is affected by the annual increase and decrease of housing stocks. In this respect, two factors were taken into consideration, i.e. vacant house (housing vacancy rate) and housing replacement (houses that need to be replaced/redeveloped due to deterioration) rate. The total energy consumption by residential sector was obtained by multiplying the total residential unit with the average energy consumption rate per residential unit. The calculation methods and average energy consumption rate per residential unit used in this model were adopted from the Johor Structure Plan 2001-2020. The basic equations used are as follows (Eqs. 1 & 2): Rt = Rt-dt + HI + HR – HVt-dt + HVt where, Rt Rt-dt HI HR HVt-dt HVt
Total residential unit for year t Total residential unit for year t-dt Additional number of household Number of existing residential unit that requires immediate replacement Number of vacant house in year t-dt Number of new vacant house in year t
(1)
ER = Rt x ERR
(2)
where, ER Total energy consumption by residential sector Total residential unit for year t Rt ERR Energy consumption rate for each residential unit
Commercial and Industrial Sub-models The methodologies used for estimating energy consumptions by commercial and industrial sectors were similar. They were adapted from the methodology used by Imura (2003) for the energy consumption and CO2 emission projections. The energy consumption was estimated based on the GRP (gross regional product of the study area) values of commercial and industrial sectors. The energy consumptions per unit of GRP of commercial and industrial sectors (EPU 2006) were multiplied by the predicted GRP of tertiary industries. The basic equations for estimation of energy consumption by commercial and industrial sectors are as follows (Eqs. (3) & (4)): EC = GRPtotal x S.GRPC x ERC where, EC GRPtotal S.GRPC ERC
(3)
Total energy consumption by commercial sector Total GRP Share of commercial sector GRP to total GRP Energy consumption rate per unit of commercial sector GRP
EI = GRPtotal x S.GRPI x ERI
(4)
where, EI Total energy consumption by industrial sector GRPtotal Total GRP S.GRPI Share of industrial sector GRP to total GRP Energy consumption rate per unit of ERI industrial sector GRP
Transportation Sub-model Energy consumption in transportation sector was divided into two main parts, i.e. private vehicles and public transportation. Since freight transportation normally involves long distance travel, it was disregarded in this assessment of urban context. In estimating energy consumption by transportation sector, travel distance was firstly estimated. The basic principle of the methodology used in estimating travel distance was adapted from the equation proposed by Schafer and Victor (1997), whereby future travel distance was predicted by money budgets of people. Travel distance per capita depends on (1) the money people spend on transport, and (2) the inverse unit cost of transport. The first of these factors can be expressed as the product of income (GRP per capita) and the travel money budget. The model can be expressed as per Eq. (5). Based on the travel distance, energy consumption (consumption rates based on Poudenx and Merida 2005) was estimated using the Eq. (6). TD = [(GRPcap x TMB) ÷ TC] x P where, TD GRPcap TMB TC P
Total travel distance GRP per capita Travel money budget Travel cost Total population
(5)
ET = (TDPb x ERT,Pb) + (TDPr x ERT,Pr) where, ET TDPb ERT,Pb TDPr ERT,Pr
(6)
Total energy consumption by transportation sector Total travel distance by public transportation Energy consumption rate of public transportation Total travel distance by private transportation Energy consumption rate of private transportation
TEST SCENARIOS In this UEC model, it was assumed that the future urban energy consumption trends would mainly be affected by eight major factors namely, population, household size, energy saving efforts in residential, commercial and industrial sectors, economic growth rate, economic structure (shares of commercial and industrial sectors), and public transportation system (cf. Table 1). Seven initial test scenarios were carried out in this study to investigate the possible future urban energy consumption trends of Johor Bahru city. Scenario 1 serves as a reference case whereby it was assumed that the society will proceed in a traditional manner without any major deviation from the current trend. For Scenarios 2 to 7, it was assumed that year 2020 would be the year which major change of society will be taking place. Prior to 2020 the development trends would be same as Scenario 1, then some major changes in society such as economic boom, energy crisis, major improvement of public transportation system would be taking place on/after 2020. By comparing with Scenario 1, an overview of the effects of these possible future development scenarios on urban energy
consumption can be revealed. An overview of all the test scenarios is given in Table 1. SCENARIO 1 (S1) is the Reference Scenario. The society will proceed in a traditional manner without any major deviation from the present trend. Based on the projections in Johor Structure Plan, it was assumed that the population growth will be gradually slowed down due to increased living expenses, increased population density and stabilization of economic growth. In view of the revival of regional economy, it was expected that Johor Bahru will still be able to maintain the present high economic growth rate for several years before it gradually slows down. SCENARIO 2 (S2) is an Economic Boom Scenario. Prior to 2020, the development trend would be as per Scenario 1. It was assumed that economic boom would be taking place in 2020, whereby the GRP growth rate will be escalated up to 13% (1990’s economic boom level). As a result of high economic growth, population growth rate will also be elevated due to rural-urban migration. Due to high economic income, energy saving efforts will not be significantly improved. Table 1. Details of Simulation Scenarios Variables
Population growth rate
Household size Energy saving in residential sector Energy saving in commercial sector Energy saving in industrial sector Economic growth rate
Economic structure: Commercial sector GRP share
Scenario 1 Normal growth (reference scenario) Gradual decrease: 4.59% p.a. → 2.00% p.a. Gradual decrease: 4.30 → 3.65
Scenario 2 Scenario 3 Scenario 4 Scenario 5 Scenario 6 The following major changes are taking place in year 2020 onwards: Economic Improved Technology Lifestyle Energy crisis boom public advancechange transport ment From 2020 From 2020 level level gradually gradually decrease to increase to 1.0% * 5.00% p.a.
Nil
Nil
Nil
Nil
Nil
Nil
Gradual decrease: 10% p.a. → 5% p.a.
From 2020 level gradually increase to 13%
Starting 2020, saving up to 37.5% Starting 2020, saving up to 37.5% Starting 2020, saving up to 4.5%
Starting 2020, saving up to 9% Starting 2020, saving up to 9% Starting 2020, saving up to 32%
Starting 2020, saving up to 46.5% ** Starting 2020, saving up to 46.5% ** Starting 2020, saving up to 36.5% ** Further decreases from 2020 level to 1% p.a.
Scenario 7 Integrated scenario
Same as Scenario 6 Same as Scenario 6 Same as Scenario 6
From 2020 level gradually increase to 30% Industrial From 2020 Gradual sector GRP level increase: share gradually 36.2% → decrease to 60% 50% Share of From 2020 Gradual Starting 2020, From 2020 From 2020 Combination public level gradual increase: energy saving level gradual level gradual of Scenarios transport increase to up to 15% increase to increase to 3&4 5% → 15% 50% 30% 40% 1. The above assumptions of future trends are based on/adapted from the Johor Structure Plan 2001-2020, Uchiyama (2002), and authors’ own rationales. 2. Same assumption as per Scenario 1. 3. Nil: No extraordinary energy saving effort (energy consumption rates remain constant). 4. *Natural population growth. 5. ** combination of energy saving by technology advancement and change of lifestyle. Gradual decrease: 32.8% → 20%
SCENARIO 3 (S3) is an Improved Public Transportation Scenario. This scenario assumed the same trend as per Scenario 1 except that a comprehensive mass transit public transportation system will be
fully available in 2020 and will eventually capture up to 50% of the total travel distance. SCENARIO 4 (S4) is a Technology Advancement Scenario, whereby it was assumed that starting 2020 both the government and private sectors will aggressively invest in energy saving research and development (R&D). This move will have significant impacts on the energy efficiency of all sectors. SCENARIO 5 (S5), a Change of Lifestyle Scenario. Under this scenario, it was assumed that since year 2020 the general public will have improved awareness on the importance of energy saving. Continuous energy saving efforts will result in gradual reduction of energy consumption rates of residential, commercial and industrial sectors through change of lifestyle and various voluntary energy saving plans such as usage of passive building technologies, reduced usage of energy consuming apparatus and increased usage of higher efficient apparatus, and increased usage of public transportation etc. SCENARIO 6 (S6) is an Energy Crisis Scenario (worse case scenario). It was assumed that energy crisis will occur in 2020 due to unforeseen circumstances such as war, depletion of energy resource, etc. and it will prevail until the end of projection period. Starting from year 2020, due to extreme increase in energy prices, GRP and population growth rates will be significantly slowed down. The share of industrial sector would be shrinking due to increased energy cost. Energy consumption rates of all sectors will be significantly reduced due to R&D, strengthening of energy conservation laws, change of lifestyle. The share of public transportation would be increased up to 40% due to increased cost in private transportation. SCENARIO 7 (S7) is an Integrated Scenario, whereby various energy saving efforts as described in the above scenarios will be implemented concurrently. This scenario is important to reveal the magnitude of the impact on urban energy consumption trend if all the energy saving efforts were implemented at the same time.
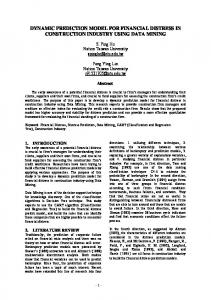
RESULTS AND DISCUSSION Urban Energy Consumption Compared to 2006 Level (2006=1)
16 Scenario Scenario Scenario Scenario Scenario Scenario Scenario
14
12
S3: public transport
S2: economic boom
1 2 3 4 5 6 7
S1: reference
10
S4: technology advancement
8
S5: lifestyle
6
S7: integrated
4
S6: energy crisis
2
Major changes in society take place (year 2020) 2050
2048
2046
2044
2042
2040
2038
2036
2034
2032
2030
2028
2026
2024
2022
2020
2018
2016
2014
2012
2010
2008
0
2006
Figure 3 illustrates the simulation results. It must be noted that in this study numerical values are not really significant. Instead, focus was put on the shapes of the curves change from one scenario to another, as it represents the possible change in urban energy consumption trends, also, because models are always the simplification of real world and they are never perfectly valid (Meadow et al. 2004). As explained above, the major changes in society development in scenarios 2 to 7 were made in 2020. Hence, the results are same for all scenarios up to 2020 as shown in Figure 3. Due to the changes in society from 2020 such as economic boom, energy crisis, etc., various results of all scenarios were seen after 2020.
Year
Figure 3. Overall urban energy consumption
The main characteristic of S1 is that smooth graph curves are observed in all the variables. There is no extraordinary circumstances occur during the projection period, hence the society will proceed in a traditional manner without any major change in policy, so steady increase of energy consumption was observed in this scenario. Due to exponential growth of population and other developments in the society, energy consumption in 2050 is more than 14 times of 2006 level.
Under S2, due to high economic and population growth rates, energy saving efforts will not be significantly improved. As a result, energy consumption is escalating at an unmanageable rate. With the energy saving measures, energy consumption under S3 to S5 will be controlled to lower levels compared to S1. Although exponential growths were still shown in the graph, the slopes of these three curves were so much less steep. Based on the results of these three scenarios, it is obvious that lifestyle is playing an important role in managing urban energy consumption. S3 requires huge investment to establish the mass transit transportation system and S4 requires long-term investment on R&D for various energy consuming sectors. Nevertheless, their magnitudes of energy saving are still less than the costless S5 (changing lifestyle). S7 shows the energy consumption trend when various energy efforts, including establishment of mass public transit system, energy saving R&D, and changing of lifestyle, were applied. Although the growth of energy consumption is well lower than other scenarios, it is still growing exponentially. S6 shows the worse case scenario when an energy crisis occurs. Due to contracting population and economic growth rates and share of industrial sector, the overall energy consumption rate was significantly lowered compared to other scenarios. The exponential shape of curve was significantly suppressed towards sustainability. Although it results in unhealthy socio-economic development, the result of this scenario showed that population growth rate, economic growth rate, and economic structure are important in minimizing urban energy consumption toward sustainability. For this reason, further test on these three aspects should be carried out.
16
Scenario Scenario Scenario Scenario
14 12
7 8 9 10
S8: residential S9: commercial
10
S10: industrial
8 6
S7: integrated
4 2 0
Urban Energy Consumption Compared to 2006 Level (2006=1)
16
Scenario Scenario Scenario Scenario
14 12
7 11 12 13
S11: population S13: GRP share
10
S12: GRP growth rate
8 6
S7: integrate
4 2
S8
2050
2048
2046
2044
2042
2040
2038
2036
2034
2032
2030
2028
2026
2024
2022
2020
2018
2016
2014
2012
2010
2008
2050
2048
2046
2044
2042
2040
2038
2036
2034
2032
2030
2028
2026
2024
2022
2020
2018
2016
2014
2012
2010
2008
2006
0 Year
2006
Urban Energy Consumption Compared to 2006 Level (2006=1)
On a whole, based on the results of above seven scenarios, S5 (change of lifestyle) and S6 (energy crisis) showed the lowest urban energy demand, hence it is worthwhile to undertake further analysis on these two scenarios.
Year
As per S1 except that 20% saving in residential energy consumption rate after 2020. S9 As per S1 except that 20% saving in commercial energy consumption rate after 2020. S10 As per S1 except that 20% saving in industrial energy consumption rate after 2020.
S11 As per S1 except that population growth rate was being controlled at 1% p.a. after 2020. S12 As per S1 except that GRP growth rate was being controlled at 3% p.a. after 2020. S13 As per S1 except that GRP share of industrial and commercial sectors were being controlled at 30% and 50% respectively.
Figure 5. Results of S8-10 compared to S7
Figure 6. Results of S11-13 compared to S7
For S5 (change of lifestyle), there are three main factors affecting the results i.e. energy saving in residential, commercial and industrial sectors. Further analysis has been carried out by individual test on each of these three factors. Under S5, different energy saving rates had been applied to these three sectors. For cases S8 to S10, a standard 20% saving has been applied for all the three sectors so as to test the significance of each sector in the overall urban energy consumption. As shown in Figure 5, energy saving in residential and commercial sectors was much less significant compared to industrial sector. From these results, it can be concluded that energy saving in industrial sector is very significant in achieving sustainable urban energy consumption. Hence, in managing urban energy consumption, it
is necessary to promote energy saving in industrial sector and focusing on low energy consumption industries rather than energy intensive heavy industries. Presently, about 55% of the total industrial establishments in the study area are chemical, petroleum, metal and machinery related industries, which are mostly energy intensive.
10
Year
S14 As per S1 except that after 2020 GRP growth rate is being controlled at 3% p.a. and industrial sector energy consumption rate is controlled at 50% of 2006 level.
Figure 7. Results of S14 compared to S7
S14: GRP growth rate & industrial
4
2050
2048
2046
2044
2042
2040
2038
2036
2034
2032
2030
2028
3 2026
2050
2048
2046
2044
2042
2040
2038
2036
2034
2032
2030
2028
2026
2024
2022
2020
2018
2016
2014
2012
2010
2008
0
2024
1
5
2022
2
S7: integrated
6
2020
S14: GRP growth rate & industrial
3
S15: residential & commercial 7
2018
4
8
2016
5
2014
6
2012
7
Scenario 7 Scenario 14 Scenario 15
9
2010
S7: integrated
2008
8
2006
Scenario 7 Scenario 14
9
Urban Energy Consumption Compared to 2006 Level (2006=1)
10
2006
Urban Energy Consumption Compared to 2006 Level (2006=1)
S6 (energy crisis) shows the lowest curve among all scenarios. Further analysis has been carried out for this scenario by further tests on each of population growth, economic growth rate and economic structure. Figure 6 shows the results of S11-S13 compared to S7. The urban energy consumption under S7 was still lowest compared to S11, S12 and S13. This indicates that individual control on each of population growth, economic growth rate and economic structure is still not effective enough in controlling urban energy consumption, compared to the integrated scenario shown by S7. However, it is worth noting that the results of S7 and S12 are very similar. Also, the steepness of exponential curve of S12 was much less than S7. This result suggests that the controlling of economic (GRP) growth rate is the most important factor in controlling urban energy compared to the other two.
Year
S15 As per S1 except that after 2020 energy saving rates for residential and commercial sectors up to 46.5% each due to R&D and lifestyle change.
Figure 8. Results of S15 compared to S7 & S14
From the simulation results of S8 to S13, it was found that energy consumption rate of industrial sector and economic growth rate are the key factors determining the urban energy consumption. Hence, the next test is the combination of these two factors. Under S14, it was assumed that after year 2020, GRP growth rate will be controlled at 3% p.a. while the average industrial consumption rate would be reduced to 50% of present level (through various energy saving efforts and switching from energy intensive industries to less energy consuming hi-tech industries). The result is given in Figure 7. It can be seen that the outcome of the combination of the aforementioned measures is greater than the integrated measures (S7). Hence, it can be asserted that in order to manage the urban energy consumption, focus should be put on the control of economic (GRP) growth rate and energy consumption rate of industrial sector. Subsequent to the abovementioned primary factors, analysis also shows that residential and commercial sectors are also very significant in determining the urban energy consumption. Figure 8 gives the test (S15) on the combination of technology advancement and lifestyle change for residential and commercial sectors. With the combination of these two measures, the urban energy consumption can be reduced to about the same level as S7.
LIMITATIONS OF THE UEC MODEL The main purpose of this model is to capture the overview of the urban energy consumption trend rather than for detailed modeling of each sub-sector, hence various simplifications had been made. These simplifications entailed in limitation of the model in various aspects: 1.
It was assumed that urban energy consumption is only contributed by the four sectors mentioned
2.
3.
4.
above. Although sub-sectors such as government services, educational institutions, construction, etc. have been included under commercial and industrial sectors, some minor sectors like freight transportation, agriculture, welfare facilities, etc. were omitted in the model. Even though population and economic factors have been taken into consideration, there was no detailed modeling on the relationship between these two factors. It relies mainly on qualitative assessment of possible future trends, with reference to the projections done by the Johor Structure Plan and other relevant studies. In this model, it was assumed that the future urban energy consumption trends would mainly be affected by eight general major factors yet still are essential (cf. Test Scenario section). In fact there are various other related factors that may have indirect effects on urban energy consumption e.g. size of city, land use structure, income, property prices, etc. were not directly included in the model at this stage. The energy consumption rates of each sector were generalized as average rates of sub-sectors.
Although there were limitations in the model, the current investigation is believed to be sufficient and has not been overlooked in presenting the overall trend of urban energy consumption. However, the UEC model will be further improved in the future studies to cope with the above limitations.
CONCLUSIONS In this study, the UEC model was constructed to capture the comprehensive overview of the urban energy consumption trend. Although it was a fairly basic model with various simplifications and limitations as explained above, it provides an overview of the urban energy consumption trends under various scenarios. From the above test cases, the main driving forces of the urban energy consumption have been identified, which are the economic growth rate and energy consumption rate of industrial sector, then followed by residential and commercial sectors. Hence, these elements should be prioritized in the future urban energy saving study, and incorporated in the long-term urban planning. Besides, it must also be highlighted that lifestyle is also a very important aspect to be taken in consideration in reducing urban energy consumption. Although it is not the most effective measure in reducing the overall urban energy consumption, it is costless compared to other measures that require huge long-term investments.
REFERENCES 1. EPU (2006) Ninth Malaysia plan 2006-2010. The Economic Planning Unit, Malaysia. 2. Hidefumi, I. (2003) The budgets of GHGs, urban air pollutants and their future emission scenarios in selected mega-cities in Asia. Asia-Pacific Network for Global Change Research, Nagoya 3. IGES (2004) Urban energy use and greenhouse gas emission in Asian mega cities: policies for a sustainable future. Institute of Global Environmental Strategies, Japan 4. Johor Structure Plan 2001-2020 (2003). Johor Town and Country Planning Department, Johor Bahru. 5. Meadow, D., Jorgen, R. and Dennis, M (2004) Limits to Growth. Chelsea Green Publishing Company, Vermont 6. Poudenx, P. and Merida, W. (2005) Energy demand and greenhouse gas emissions from urban passenger transportation versus availability of renewable energy: The example of the Canadian Lower Fraser Valley. Journal of Energy, 32(2007), 1-9. 7. Schafer, A. and Victor D.G. (2000) The future mobility of the world population. Journal of Transportation Research Part A, 34 (2000) 171-205 8. U.S. DOE (2006) International energy outlook 2006. Energy Information Administration, U.S. Department of Energy, Washington D.C. 9. Uchiyama, Y. (2002) Present efforts of saving energy and future energy demand/supply in Japan. Journal of Energy Conversion and Management, 43(2002), 1123-1131.