See discussions, stats, and author profiles for this publication at: https://www.researchgate.net/publication/327012065
System Dynamics Model to Determine Concession Period of PPP Infrastructure Projects: Overarching Effects of Critical Success Factors Article in Journal of Legal Affairs and Dispute Resolution in Engineering and Construction · August 2018 DOI: 10.1061/(ASCE)LA.1943-4170.0000280.
CITATIONS
READS
0
238
4 authors, including: Fahim Ullah
Muhammad Jamaluddin Thaheem
UNSW Sydney
National University of Sciences and Technology
19 PUBLICATIONS 30 CITATIONS
64 PUBLICATIONS 140 CITATIONS
SEE PROFILE
Nuria Forcada Universitat Politècnica de Catalunya 61 PUBLICATIONS 554 CITATIONS SEE PROFILE
Some of the authors of this publication are also working on these related projects:
Technology usage in Construction & Property View project
Six Sigma implementation in construction industry of Pakistan View project
All content following this page was uploaded by Fahim Ullah on 14 August 2018.
The user has requested enhancement of the downloaded file.
SEE PROFILE
Scholarly Paper
System Dynamics Model to Determine Concession Period of PPP Infrastructure Projects: Overarching Effects of Critical Success Factors
Downloaded from ascelibrary.org by Fahim Ullah on 08/13/18. Copyright ASCE. For personal use only; all rights reserved.
Fahim Ullah, Aff.M.ASCE 1; Muhammad Jamaluddin Thaheem, Ph.D., Aff.M.ASCE 2; Samad M. E. Sepasgozar, Ph.D., M.ASCE 3; and Nuria Forcada, Ph.D., M.ASCE 4
Abstract: The determination of the concession period (CP) in public–private partnership (PPP) infrastructure projects presents complexities to decision makers because various critical success factors (CSF) are involved which may be overlooked. This paper outlines a system dynamics (SD)-based approach to provide an in-depth understanding of CSFs that determines PPP projects’ CP and models them for localized use. The CSFs are obtained from published literature, duly vetted through a survey of 56 experts, and used to develop a quantitative and qualitative SD model, validated by simulating case studies of five infrastructure projects. A total of 59 concession-affecting CSFs are highlighted that are reduced and compared for localized infrastructure projects. The findings indicate that CP should be dynamic instead of fixed and static, and warrant an extension of the originally proposed concession in three cases and reduction in the remaining two. The decisionmaking implications of this study target the three key stakeholders: the public body through reduced financial risks, the private organization through increased confidence and reassessment of concession during project life, and the end user through nominal tolls. DOI: 10.1061/ (ASCE)LA.1943-4170.0000280. © 2018 American Society of Civil Engineers. Author keywords: Public–private partnership; Concession period; Critical success factors; Infrastructure projects.
Introduction Private-sector participation in infrastructure financing and management is growing around the world, and this increase has special relevance in the case of road projects procured under public–private partnerships (PPPs) (Rahmani et al. 2017). As is evident from case studies in Europe, the growing trend of private-sector participation in road projects has resulted in more-stringent regulations (Albalate et al. 2013). Privatization of construction projects is an emerging market in the United States as well. There have been significant greenfield projects, such as the Dulles Greenway, and brownfield projects, including the Chicago Skyway, Indiana Toll Road, 1
Ph.D. Student, Faculty of the Built Environment, Univ. of New South Wales, Postgraduate Research Centre, PhD Lab Level 6, Sydney, NSW 2052, Australia; Lecturer, Dept. of Construction Engineering and Management, National Institute of Transportation-School of Civil and Environmental Engineering, National Univ. of Sciences and Technology, Islamabad 44000, Pakistan (corresponding author). ORCID: https:// orcid.org/0000-0002-6221-1175. Email:
[email protected];
[email protected] 2 Assistant Professor, Dept. of Construction Engineering and Management, NIT-SCEE, National Univ. of Sciences and Technology, H-12, Islamabad 44000, Pakistan. Email:
[email protected] 3 Senior Lecturer, Faculty of the Built Environment, Univ. of New South Wales, Level 3, Red Centre West Wing, Sydney, NSW 2052, Australia. Email:
[email protected] 4 Associate Professor, Group of Construction Research and Innovation, Dept. of Project and Construction Engineering, Universitat Politècnica de Catalunya, Bldg. TR5, Despatx 310, C. Colom, 11, Terrassa 08222, Barcelona, Spain. Email:
[email protected] Note. This manuscript was submitted on November 15, 2017; approved on May 21, 2018; published online on August 14, 2018. Discussion period open until January 14, 2019; separate discussions must be submitted for individual papers. This paper is part of the Journal of Legal Affairs and Dispute Resolution in Engineering and Construction, © ASCE, ISSN 1943-4162. © ASCE
and Pennsylvania Turnpike (MWAA 2015). A general trend of prospects for privatization of roads in New Jersey and build– operate–transfer (BOT) concessions in Texas has surfaced recently. This wave of privatization is accompanied by renewed interest in the way the public sector regulates (Cheung et al. 2010; Meng and Lu 2017). This interest can be explained by the potential redistributive effects due to the right of exploiting a network asset such as a motorway. PPP is evidently receiving a great deal of attention from governments in different parts of the world. One stated reason behind this trend is the concern over public expenditure (Cheung et al. 2010; Ullah et al. 2016). PPPs are often presented as a core part of the modernization of public services, because they improve the quality and efficiency of public services (Liu and Wilkinson 2014). However, from a more skeptical view of their value, some studies point to their complexity, short-term and long-term costs, and consequences for labor and those reliant on public services (Osei-Kyei and Chan 2015). Such complexities often lead to the failure of PPP projects. One of the most complex decisions in PPP projects is the determination of the concession period (CP), which is the time allotted to a private entity for operating a constructed facility to recover its expenditures and gain some acceptable return on investment (Ng et al. 2007b; Osei-Kyei and Chan 2017). The project is handed over to public authority at the end of this term. CP reconciles risk–reward balance for the private party and the end user: the prior in form of speedy financial recovery, and the latter in form of economic tolls and greater public welfare (Akintoye and Chinyio 2005; Carmona 2010; Hu and Zhu 2014; Shi et al. 2016). Thus, if not estimated properly, CP may trigger project failure (Cheung et al. 2010; Tieva and Junnonen 2009; Trangkanont and Charoenngam 2014). In terms of legal aspects, PPPs and their CPs are evolving, and the methodology to calculate CP has yet to mature. This is mainly because the length of CPs (typically 15–30 years or longer) makes the formulation of a comprehensive contract very difficult.
04518022-1
J. Leg. Aff. Dispute Resolut. Eng. Constr., 2018, 10(4): 04518022
J. Leg. Aff. Dispute Resolut. Eng. Constr.
Downloaded from ascelibrary.org by Fahim Ullah on 08/13/18. Copyright ASCE. For personal use only; all rights reserved.
Furthermore, PPP projects are frequently renegotiated or bought back when parties attempt to amend the critical elements, such as tolls and tariffs and subsequent readjustments for financial obligations, making the formulation of a globally accepted PPP legal framework nearly impossible (Mouraviev and Kakabadse 2017b). Therefore, it is better to look at PPP in terms of the principal features that distinguish it from other types of agreements between the government and private organizations, keeping in view its unique contractual aspects. According to Mouraviev and Kakabadse (2017a), some of the legal challenges faced by PPP CPs are incomplete and inconsistent legislation surrounding partnerships, weak institutional development, virtually nonexistent civil participation, underdeveloped financing institutions and unclear stance from the government regarding approaches to PPP project preparation. Other legal challenges include lack of PPP-specific governance structures and established procedures for partner interaction; tariff adjustments; dispute resolution; ambiguous government approach to risk allocation; excessive government regulation in which the government focuses on input; and a contradictory perception of a policy paradigm, which serves as an instrument for massive PPP deployment, although the government commitment to partnerships quickly disappears after a PPP is launched. Although it is crucial to precisely determine the CP due to the growing innovation and quality demands (Carbonara et al. 2015; Ullah et al. 2017b), the estimating complexities result in a lack of valid and globally applicable models. In response to this research gap, this study develops a novel model based on the systems dynamics (SD) concept to estimate the CP realistically and induce more adoptability by incorporating localized critical success factors (CSFs). The model, based on stocks and flows and on positive and negative loops, operates in a systemized way to simulate various possible decisions, and yields results based upon randomized iterations until a constant trend is observed, at which point the iterations are stopped and results are compiled. This model underlines the dynamic behavior of CPs instead of the traditional static approach. Therefore, CPs should be revised after some time and adjusted accordingly depending upon the set terms and conditions and the forecasted project performance. Concession Period of PPP Projects Various concession-based failure stories have been reported citing unforeseen costs, improper risk allocation, legal ambiguities, lack of responsibility, and local public resistance as contributing factors (Carbonara et al. 2015; Domingues and Zlatkovic 2015; Khanzadi et al. 2012). As in other project types, value for money (VFM) in PPP projects is carefully assessed because of the associated financial risks (Kumaraswamy et al. 2007; Love et al. 2015). Although before making a PPP procurement decision the economic justification of VFM is assessed, other factors, including project risks, construction complexities and innovations, traffic congestion problems, lack of proper and legal government policies, and social welfare, are ignored (Carmona 2010; Hu and Zhu 2014; Jefferies and McGeorge 2009; Love et al. 2015). For example, the M25 widening scheme in the United Kingdom was criticized for higher than necessary costs and lack of alternative options of using the hard shoulder as an extra lane during peak hours, which led to a potential extra cost of around GBP 1 billion to taxpayers (Marsden 2005). Similarly, the Lagos–Shagamu–Ibadan concession road project is a PPP failure case in which many people had to be relocated and compensated accordingly. Several obligations, not captured in the contract package at the precontract stage, escalated into serious cases of protracted litigation (Akintoye and Main 2007; Opawole and Jagboro 2016; Trangkanont and Charoenngam 2014). © ASCE
CP is dependent upon various dynamic factors such as project income (PI), toll price, severity of involved risk (SIR), and market situation (MS) (Akintoye and Chinyio 2005; Wang et al. 2011). Various researchers have discussed its allocation and optimization decisions (Karim 2011; Ke et al. 2010). However, the effects of CSFs on concession estimation are less explored, providing a research gap for exploration (Ullah and Thaheem 2017). This effect is multiplied in the case of developing countries. Ng et al. (2007b) proposed a simulation model for determining CP that incorporates the risk of optimum tariff and payback in the tendering stage. Cruz and Marques (2012) developed a regulatory contractual regime for evaluating the risk allocation in Portuguese road concessions. They suggested that government must assume the risk of production and provide incentives in the case of highway development. Similarly, several authors have developed theoretical frameworks for obtaining VFM from PPP concessions using assessment techniques of public sector comparator, competitive bidding, shadow bid, cost benefits analysis, lease-purchase analysis, and public interest test central guidelines (Love et al. 2015; Tieva and Junnonen 2009). Trebilcock and Rosenstock (2015) proposed that governments should anticipate, plan contingencies for, and enforce and monitor long-term PPP contracts. They highlighted the capacity as a key determinant of PPP success and reduction of potential concession renegotiations in Latin America. These PPP frameworks not only address regional development goals but also attempt to reduce the legal risks of such CPs. In general, there are two types of perspectives on PPPs in terms of the relations between the public and private organizations: the contractual perspective focusing on the legal aspects, and the task-specific focus aimed at project execution and delivery through various stages of its lifecycle (Zhang et al. 2015). The frameworks must address the legal aspects, including proper rights, polity, administrative regulations, judiciary, and bureaucracy. If such aspects are not properly addressed, this may lead to project delays or subsequent failures. For example, the first Polish PPP was delayed by more than a decade by the lack of legal implications (Albalate et al. 2015). Similarly, Gurgun and Touran (2013) compared various legal frameworks for PPPs and stressed their importance. Edkins and Smyth (2006) suggested that these legal systems must exist but should not be overly complicated. They argued that an overly complicated legal system will not only demand hiring of and extensive payments to legal advisors, but also will hinder the much-desired partnership, making the relation adversarial instead of collaborative. Although recent studies have shifted their focus toward CP risk, emerging risks associated with recently highlighted critical factors have brought about new challenges. New influential factors that must be incorporated into the decision models have been identified (Carmona 2010; Yu and Lam 2013). PPP CSFs are revised from time to time to enable a better execution and management that lead to new challenges. CSF to Determine the CP In infrastructure projects, CSFs to determine the CP include financial aspects such as equity allocation, toll and service price, economic viability, operation and construction costs to the public, social welfare such as end-user purchase subsidies, environmental concerns, and elimination of traffic congestion (Liu and Wilkinson 2014; Shi et al. 2016; Wibowo and Wilhelm Alfen 2014). These factors affect project success and increase its complexity. CSFs for infrastructure projects include, but are not limited to, net present value (NPV), traffic congestion and road usage, effectiveness of public bodies, population in nearby area, adequacy of
04518022-2
J. Leg. Aff. Dispute Resolut. Eng. Constr., 2018, 10(4): 04518022
J. Leg. Aff. Dispute Resolut. Eng. Constr.
Downloaded from ascelibrary.org by Fahim Ullah on 08/13/18. Copyright ASCE. For personal use only; all rights reserved.
project funding, and annual operational revenue (Alireza et al. 2013; Zhang and AbouRizk 2006). Because CSFs induce risk in PPP projects, they warrant effective management to achieve successful execution and subsequent closure. Furthermore, closure risk, which refers to a funding agency’s capability to reach financial closure, poses great concern for the public entity (Domingues and Zlatkovic 2015). However, at the feasibility and planning stages, a poor CP estimate poses even greater challenge to both public and private entities. For the public agency, an administrative and decisive scenario arises that sways the bid process. Having estimated the total project cost, the public agency may decide on the minimum possible offer to accept (Kumaraswamy et al. 2007; Wibowo and Wilhelm Alfen 2014). It has also implications in establishing the toll rate because the public agency is responsible for not only ensuring financial recovery on the part of donor agencies but also providing market-compatible rates in the light of economic capacity of users (Shi et al. 2016). For the private sector, this risk is business-critical and projectcritical because the corporate sector needs to guarantee a profitable return on investment within a stipulated time (Carmona 2010; Ng et al. 2007a). Any extension in this time may pose serious financial pressures, demoralizing the private investors from doing further business in that market (Carbonara et al. 2015). In the case of no extensions, the financier has no other option but to escalate the revenue by increasing usage charges, transferring the financial burden to end user. Therefore, it is crucial to perform thorough risk management for concessions in the early stages of project development. To meet this demand, considerable research has gone into identifying CP duration of BOT-based PPP projects (Meng and Lu 2017; Yu and Lam 2013). The general trend suggests that risk allocation between the public and private sectors involved in public-purpose transport investments is an onerous and tricky matter due to the opportunistic behavior of PPP stakeholders (Domingues and Zlatkovic 2015; Wibowo and Wilhelm Alfen 2014). Although the allocation of risk between public and private stakeholders varies from country to country, a major consensus is found regarding the assumption of entire financial risk by the private sector which undertakes the long-term maintenance and operation responsibilities (Ke et al. 2010). An exception to this risk sharing is projects in which promotion and development of some underdeveloped and deprived part of the country is the priority (Wibowo and Wilhelm Alfen 2013). The effect of risk is further exacerbated by the time factor because these concessions are usually very lengthy (25–30 years), giving rise to the stochasticity of various estimates (Tieva and Junnonen 2009). Because of these challenges, concession-based projects should be investigated based on their context in terms of financial, social, and environmental aspects (Hu and Zhu 2014; Jefferies and McGeorge 2009; Wibowo and Wilhelm Alfen 2013). The current literature mainly covers developed countries such as the United States, the United Kingdom, Canada, and China. The challenges of developing and underdeveloped construction industries include quality management, project success, waste management, contractual framework maturity, PPP policy, and time and cost management, to name a few (Akintoye and Main 2007). This study focuses on a developing country because the current challenges of its construction industry are yet to be shared with the developed world. PPP Projects in Pakistan Although there are currently 22 ongoing PPP infrastructure projects in Pakistan (NHA 2017; Ullah et al. 2017b), there is neither a reliable estimation method for its CP nor any considerations to incorporate the localized CSFs. This may result in failure if © ASCE
not addressed. To date, only one PPP project has been completed, which escalates the gravity of these concerns. The completed project was assigned a concession of 10 years, which was erroneous, as highlighted by postproject studies. Had the concessionaire itself not closed the project as a token of good will, the government would have suffered 4 extra years of concession expenditures. This concern is particularly critical for international or foreign partners that are planning to become involved in a project. As highlighted by Razzaq et al. (2016), foreign companies intending to do business in Pakistan are faced with a constant fear of time and cost overruns due to lack of localized policies. It is estimated that PKR 358,594 million (USD 3,420.88 million) was invested in PPP based infrastructure development projects from 1991 to 2015 (NHA 2015; Ullah et al. 2017b). Because of such huge investments, PPP need to be thoroughly studied and its CP decision-making for the local construction industry should be improved. System Dynamics Approach to Determine Concession Periods SD modeling is an objected-oriented methodology in which cause and effect variables are arranged into a causal loop diagram (CLD) to represent the structure and interaction of principal feedback mechanisms in a system (Sterman 2001). The main diagramming tools used are the CLD and stock and flow diagrams. CLDs consist of cause and effect variables connected by arrows denoting their causal influence. Each causal link is assigned a polarity, either positive or negative, to indicate the relationship between the dependent and independent variables. In addition, the feedback process within the loop can be simulated to provide a delayed response; such a delay creates inertia and oscillation within the system. The SD simulation is developed in the form of stock and flow variables, in which a stock variable describes the system’s state (such as the existing supply of workers) and the flow variable represents the rate of system changes. SD allows easily simulating the structure’s behavior over time (Morecroft 2015). Because of its inherent capabilities, SD has been widely applied to a number of problems (Khanzadi et al. 2012). Ding et al. (2016) used SD for environmental performance assessment of construction-waste management and concluded that 53.77% landfill reduction can be achieved. Khan et al. (2016) used SD for handling the information complexity in a construction project. Rashedi and Hegazy (2016) used SD for examining budget policies for new and existing facilities, and concluded that a long-term strategic plan is a key factor for budget optimization. Similarly, Xu et al. (2012) used SD for concession-price modeling in highway projects. They concluded that a rational price model will create a win-win scenario for both public and private entities. Hu et al. (2015) used it for conceptualizing a web-based tool for contracting. They argued that such a tool offers the ability to track the decisions made by privatesector suppliers during the progress of a simulated project, which can help government agencies manage the project schedule, bringing benefits to both parties.
Methodology Building on these useful studies, the present study uses SD to incorporate the effects of PPP concession CSFs in CP estimation. These CSFs are simulated in an SD model for estimating the improved CP for reconciling the increasing contractual and use-based relationships between public and private entities and service users.
04518022-3
J. Leg. Aff. Dispute Resolut. Eng. Constr., 2018, 10(4): 04518022
J. Leg. Aff. Dispute Resolut. Eng. Constr.
Downloaded from ascelibrary.org by Fahim Ullah on 08/13/18. Copyright ASCE. For personal use only; all rights reserved.
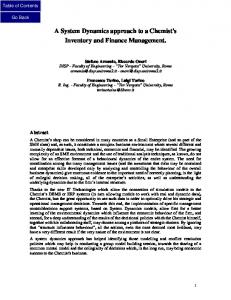
To identify the CSFs for CP estimation, the pertinent literature published during 2005–2016 in reputed international journals is analyzed. Then the selected CSFs are ranked using combined scores from academic and industrial experts to obtain mutually significant factors to incorporate in the model. Finally, the model is validated using five infrastructure case studies. Theoretical and practical implications of the proposed model are discussed, and future research directions are deliberated. SD is an increasingly adopted technique for handling complex decision-making scenarios (Khan et al. 2016; Ullah et al. 2017a). CP estimation comes with intrinsic risks and complexities, making SD a good candidate for thorough assessment (Khanzadi et al. 2012). SD bases its foundation on causal frameworks and gives results in the form of trend graphs. However, it is merely graphs unless validated and iterated through case studies for results to be comparable to real life projects. Thus, in addition to formulating SD based framework, case study–based validation needs to be performed on the formulated model, which is at the core of the current study. Thus, this research formulated a comprehensive SD model duly incorporating the identified CSFs and validated the model through five infrastructure case studies. The lack of availability of data and burden of its collection constrained the number to five. Four of the five case projects are in initial stages of execution or planning, whereas one is completed. Because of the nascence of PPP in the country, only one completed project exists, which this study includes. The case studies are based in Pakistan and data were collected from associated experts with experience of at least 10 years or two PPP projects. Thus, the entire data collection process involved 66 experts, of which 30 belonged to academia, 26 belonged to industry, and 10 belonged to the case projects (two from each project). This study moved through CSF identification and shortlisting, to subsequent development of a quantitative model given in the form of an equation, and then to SD model iteration (Fig. 1). Step 1: Identification of Factors Affecting CP First, concession CSFs were identified from the pertinent literature published in reputed international journals. When searching the related literature, Science Direct, ASCE, Google Scholar, Scopus, Taylor and Francis, and Emerald databases were used. A total of 121 research publications were consulted to highlight 59 CSFs of PPP concession. Then a two-stage pilot survey was conducted to identify the top 10 factors from those identified by the literature review to be incorporated in further analysis. Opinions were gathered from academic and industrial experts in the first and second stages of the survey, respectively. A questionnaire was developed to ask whether a factor affects the CP of PPP projects or not. The questionnaire was very basic, and respondents were asked to respond either yes or no. If their answer was yes, they were further requested to assign a score on a scale of 1–10 depending upon the impact of the factor on CP length. The final global weight (GW) was obtained by multiplying the academic score (AW) and industry score (IW) means GW ¼ AW × IW
ð1Þ
The first stage of the survey included authors and other academic experts who had published at least three research papers on PPPs. These experts were contacted online. In total, 48 experts were contacted, and 34 responded. A total of 30 responses were regarded as complete, and the remainder were discarded. © ASCE
Journals Shortlisting Keywords and Symantec Search
Step 1
Literature review
Period: 2005 – 2016 121 Research Papers Studied 59 CSFs Identified
2 Surveys 30 Academic Experts Involved
Step 2
Pilot Study
26 Industrial Experts Involved Scale Used: 1-10 Both Scores Multiplied Top CSFs Identified
Directly Proportional Factors Indirectly Proportional Factors
Step 3
Equation Development
NPV Fixed “K” Introduced MCP = K x CP0
Detailed Model Developed Implementation Model Developed
Step 4
SD Model Development
Models Validation Case Studies Selection Results Compilation
Fig. 1. Research methodology.
Thus, the accurate response rate was 62.5% (30=48). In this way, a ranking was obtained based on the opinion of academic experts. Furthermore, to complete the cycle of systematic review, 48 industrial experts were engaged in the second stage mainly through online means. A total of 29 responses were received, including 26 complete and 3 incomplete responses. Thus, the accurate response rate for this stage was 54.16% (26=48). The experts were mainly personnel in upper managerial positions of their respective organizations and who had direct involvement in at least two PPP projects or a minimum of 10 years of relevant experience. Step 2: Development of Quantitative Model This step developed a quantitative model for which functional grouping was performed to reduce the input variables in the equation. Based on expert opinion, factors such as income in year, return on investment, and operation revenue in year are represented by a single variable, PI. In addition, the factors construction cost and traffic count are intrinsically included in NPV. Furthermore, the quantitative model development warranted a relationship between the input and output variables. Because of nonlinearity, some variables are directly and some are inversely proportional to CP. Revenue stream (RS) is inversely proportional to CP (Karim 2011). Smoother and increased RS ultimately helps in quick recovery of the invested money, hence reducing the CP proportionally to the increase in RS [Eq. (2)]
04518022-4
J. Leg. Aff. Dispute Resolut. Eng. Constr., 2018, 10(4): 04518022
J. Leg. Aff. Dispute Resolut. Eng. Constr.
Downloaded from ascelibrary.org by Fahim Ullah on 08/13/18. Copyright ASCE. For personal use only; all rights reserved.
CP ∝
1 RS
ð2Þ
CP ∝
1 PI
ð3Þ
CP ∝
1 MS
ð4Þ
CP ∝
1 NPV
ð5Þ
Similarly, PI is also inversely proportional to CP. A project offering more income will intrinsically call for a lesser CP due to a quicker recovery of investment [Eq. (3)]. Likewise, better market conditions reduce the CP because a quick recovery of investment is ensured due to increased market demand and a stable return on investment (Wang 2015). Therefore, MS is inversely proportional to CP [Eq. (4)]. The trend of inverse proportionality continues in the combined factor NPV because a greater NPV means a lesser CP (Zhang and AbouRizk 2006) [Eq. (5)]. Although this is highly debatable due to the dynamic nature of factors constituting NPV, from a decision-making perspective, the minimum concession is the point at which NPV ¼ 0, whereas an increase in NPV depends upon the acceptable level of internal rate of return (IRR). In contrast, SIR is directly proportional to CP (Albalate et al. 2013) [Eq. (6)] because it demands adding time to the concession length in order to cope with surprises (Alireza et al. 2013). Similarly, the recovery of larger investments calls for a longer CP (De Marco et al. 2012), making investment size (IS) and CP directly proportional [Eq. (7)] CP ∝ SIR
ð6Þ
CP ∝ IS
ð7Þ
Based on these relationships and the originally sought concession period (CP0 ), a quantitative model [Eq. (8)] was developed to obtain the modified concession period (MCP). The highlight of this model is the multiplication factor (K) that updates the CP accordingly. Thus, it ensures the dynamism in CP because K can warrant both an increase or a decrease in the original CP0 MCP ¼ K × CP0 K ¼ α × NPV þ
X
ð8Þ
ðωÞi × ðCFÞi
ð9Þ
where ωi represents the coefficients (a, b, c, d, : : : ) of the top critical factors CF; and α = weight given to NPV. Traditional CP estimation relies upon NPV. Because this research attempts to incorporate additional concerns in the concession decision making, the proposed model can include necessary additional factors to determine CP. In this case CF ¼ RS þ PI þ MS þ SIR þ IS K ¼ ðαÞNPV þ ðaÞRS þ ðbÞPI þ ðcÞMS þ ðdÞSIR þ ðeÞIS ð10Þ The coefficients α, a, b, c, d, and e were obtained through interviews and an online questionnaire survey involving 30 professionals with experience on at least three PPP projects or a minimum of 10 years of direct involvement in PPP projects in a senior management capacity. The CSF weights obtained in the previous steps were sought along with comments about using NPV for CP estimation. This study did not consider projects not using NPV. Forty percent of surveyed experts were from Pakistan, and the others were from the Middle East, the United States, the United Kingdom, Europe, Africa, Australia, China, India, and Malaysia. Step 3: Development of Qualitative SD Model Based on the CSFs and the quantitative model, a generic qualitative SD model was developed. The complexity of the model suggested developing a reduced SD model including the most significant variables (CSFs) and combining variables (clusters) including subsystems (NPV and estimation process) and the main system (CP). The model proceeds from the very basic factors to their constituent cluster factors, which in turn adds the two mentioned subsystems, finally giving the value of K by which to multiply the main system. The SD models were developed using Vensim PLE (version 7.1), dedicated software designed for modeling one or more quantities that change over time. Step 4: Model Validation Five PPP infrastructure projects were used to validate the developed models. For the sake of overarching effect, the case projects encompassed projects that were completed, in execution, and in planning. This allowed examining the holistic pros and cons of the proposed models. Table 1 presents the basic details of the case projects such as starting dates, type, length, location, key parties involved, original concession, and project costs. All case studies were mainly headed
Table 1. Details of case projects
Project
Start date
1
2009
Flyover/rail-bridge
2
2003
Dual carriage way
3
2014
Six-lane Motorway rehabilitation
358 km
Islamabad to Lahore
4
2016
Four-lane motorway
89 km
5
2016
Six-lane motorway
136 km
Lahore to Sialkot Punjab Karachi to Hyderabad Sindh
Type
Length 400 m + 2 km approach road 150 km
Location Habibabad, Punjab Lahore to Faislabad, Punjab
Key parties
Key parties’ names
Concession (years)
Cost billions (USD)
Concessionaire Public Concessionaire Public SPV Concessionaire Public SPV Concessionaire Public Concessionaire Public SPV
M/S HOME NHA, IPDF FWO NHA LAFCO FWO NHA MORE NHA FWO FWO NHA MORE
10
0.008
25
0.027
20
0.41
25
0.50
25
0.34
Note: SPV = special purpose vehicle. © ASCE
04518022-5
J. Leg. Aff. Dispute Resolut. Eng. Constr., 2018, 10(4): 04518022
J. Leg. Aff. Dispute Resolut. Eng. Constr.
Downloaded from ascelibrary.org by Fahim Ullah on 08/13/18. Copyright ASCE. For personal use only; all rights reserved.
by the National Highway Authority (NHA) and Frontier Works Organization (FWO), the former being a public body and latter being a major concessionaire. Four of the projects are in Punjab Province, and one is in Sindh Province. The minimum inclusion criteria for the projects was set at a CP of at least 10 years to study it thoroughly. The weights of the CSFs for each case study were evaluated using an updated version of the previously used questionnaire survey with the additional option of an increase or decrease in the value of a CSF over project lifecycle. This was done to incorporate the dynamic values of CSFs. Project managers and upper managerial executives were asked to rank and determine the increase or decrease of CSFs for each case study. In case of a difference in values, multiple rounds of discussions were performed to reach a consensus and avoid any potential conflict.
Results Factors Affecting CP From the literature review, a total of 70 factors were identified, some of which were merged. For example, the factor constructability was named construction ease, buildability, and erecting in various papers, which were merged. Similarly, traffic congestion was named increase in traffic, more traffic movement, and escalated traffic. Thus, the questionnaire survey used 59 factors (Table 2). Table 3 lists the top 10 factors affecting CPs and their weights, determined from the questionnaire survey. The factors are arranged based on the global (overall) weights. RS is the top-ranked factor because PPPs involve huge investments that add to serious financial complications, attracting academic research. Industry is also concerned about its finances and assigns a high value to this factor. Similarly, risk in PPP arises from many sources, including complex relationships, legal aspects, huge stakes, and stakeholder satisfaction, making it a significant factor (Osei-Kyei and Chan 2017). Furthermore, the scores from both AW and IW were harmonized and converted to the same scale of 0–10. Thus, the value 7.438 for RS means that it has a score of 74.38% in AW. The IW score was obtained directly on a scale of 0–10, so no conversion was required. The top 10 factors were reduced to 6 factors (Table 4). The percentage effect in Table 4 shows the normalized influence of a factor on the concession decision and formulates the weight given to the factor in the developed model. To normalize the factor scores, the overall score was calculated by adding all values and finding their percentage contribution out of 1, so that the overall factor values sum to 1 in the absence of any external factor. The merging was carried out based on the functional similarities and discussion with the experts. This was done to reduce the number of factors and to eliminate confusion of certain factors pointing to the same thing. Table 4 indicates that NPV received the highest effect. This means that the experts were inclined toward using NPV-based assessment of concession, which is in line with the existing literature. Therefore, NPV value was fixed in all case projects and the remaining CSFs were sought while collecting data. Changing NPV would mean challenging existing published frameworks, which was not the aim of this study; the aim was to incorporate additional CSFs. Furthermore, the aim also was to induce dynamism in CP estimation. Substituting the values of percentage effect in the corresponding variables in Eq. (10) obtains the following equation: K ¼ 0.29NPV þ 0.29PI þ 0.14RS þ 0.14 SIR þ 0.08MS þ 0.07SI © ASCE
Table 2. Identified CSFs Serial number 1 2 3 4 5 6 7 8 9 10 11 12 13 14 15 16 17 18 19 20 21 22 23 24 25 26 27 28 29 30 31 32 33 34 35 36 37 38 39 40 41 42 43 44 45 46 47 48 49 50 51 52 53 54 55 56 57 58 59
Factors Social welfare Service price Toll price Travel time Traffic congestion Population in area Construction period Operation period Project development cost Sale price Discount rate Market demand Operations and maintenance costs Lack of competition Economic viability Construction cost Operation cost Government’s interests Type of project Revenue stream Organizational structure of project Site limitation Political Promotion Government effectiveness Adequacy of funding Entrepreneurship and leadership Poorly defined sector policies Lack of clear government objectives and commitment Poor risk management Credibility of government policies Poor transparency Size of project Complexity Operational life Capital structure of company Market situation Severity of risks involved Inflation rate Construction period Constructability Right project identification Strength of consortium Differentiation in guarantees Net present value Operation revenue in year Income in year Return on investment Traffic count Corruption Profitability Size of investment Procurement Strength of SPV Investment attraction Innovative design Construction logistics Number of partners Equity allocation
Note: SPV = special purpose vehicle.
SD Model Based on the previously described methodology, the proposed SD model to estimate modified CP was developed (Fig. 2). Fig. 2 denotes the positive or negative influences of each factor with
04518022-6
J. Leg. Aff. Dispute Resolut. Eng. Constr., 2018, 10(4): 04518022
J. Leg. Aff. Dispute Resolut. Eng. Constr.
Table 3. Top 10 factors Serial number
Downloaded from ascelibrary.org by Fahim Ullah on 08/13/18. Copyright ASCE. For personal use only; all rights reserved.
1 2 3 4 5 6 7 8 9 10
Factor
AW
IW
GW
Revenue stream Severity of risks involved Net present value Return on investment Construction cost Operation revenue in year Income in year Market situation Traffic count Size of investment
7.438 8.099 6.528 6.363 5.289 6.446 6.28 5.454 6.115 5.619
8.461 7.769 7.881 7.881 8.461 5.923 5.727 6.390 5.597 5.793
62.936 62.923 51.451 50.151 44.753 38.180 35.970 34.853 34.229 32.550
+ or −, respectively. For example, traffic count positively affects the NPV of a project and is marked with a positive sign. Similarly, construction costs negatively affect the NPV, as is evident from the corresponding sign. Thus, all the factors are marked accordingly to represent their positive or negative influence on CP. These influences result in reinforcing and balancing loops whose combination keeps the system in a natural balance. In the International Federation of Consulting Engineers (FIDIC) price adjustment formula (PEC 2009), the value of K comprises fixed and adjustable portions. The formula fixes 35% of cost items and allows for a variable portion of 65%. Because the formula caters for the factors in the same way as intended by the developed model, its logic can be borrowed for the current study. For example, in the formula, 35% items are fixed in any case and should not be
disturbed. Following the same lines, the developed model fixes the influence of the decision of NPV at 29% based on the survey responses. The remaining 71% can be varied based on the identified CSFs and their localized percentage effect. Thus, the value of K will be between 0.29 and 1.71 with 1 as the normal value in expected circumstances, 0.29 meaning a 100% decrease in the value of CP0 and 1.71 meaning a 100% increase in the value of CP0 . Furthermore, the values for the factors should always be used in proportion to 1 and added to or subtracted from 1 depending upon the relations in equations. For example, in case of a project being 20% riskier than normal, the CP value will be factored in at 1.2. This value will be multiplied by the corresponding coefficient to get the value of K. Similarly, in case of the expected PI being 20% more, the CP value will be factored in at 0.8. Thus, the range is fixed and cannot be altered due to both mathematical and simulation limitations. Future studies can explore other ranges. Based upon these logical constraints and the quantitative model, the SD model was developed. For the synthesis and validation of the proposed model, various iterative simulations were run under best, worst, and normal values. Based on the triangular distribution, corresponding input values were provided to achieve graphical results (Fig. 3). The input values were in the range 0–2, with 1 being the normal value. All cases simulated a test concession of 20 years. The resulting graphs display the number of years on the vertical axis, with the left side showing ranges and the right side showing the exact year. The horizontal axis shows starting and ending years of the concession. The thick lines refer to the trend for concession, whereas thin lines show the randomized values at any point in the project lifecycle. The system was not restricted to a particular value, but used a range of three-point random values as input, giving a
Table 4. Selected CSFs including percentage effect of concession period decision making Factor
Definition
NPV
Value offered by sum of money when it has been invested at compound interest in contrast to some future value it will have (Alireza et al. 2013). All earnings obtained by of selling project services and products, such as toll price and service price (Rouhani et al. 2016; Wang et al. 2011; Yu and Lam 2013). Amount coming to an organization from a particular source or by selling a particular product or service as well as available equities (Hu and Zhu 2014). Intensity of risks involved in a project and changes it experiences over time (Akintoye and Chinyio 2005; Karim 2011; Ke et al. 2010). Market appeal and attraction of particular service or project (Carbonara et al. 2015; Hu and Zhu 2014). Amount of investment made or share in a project (Ng et al. 2007a; Osei-Kyei and Chan 2017).
Project income Revenue stream Severity of risks involved Market situation Size of investment
Total score
Percentage effect
130.42
0.29
124.39
0.28
62.93
0.14
62.92
0.14
34.85 32.55
0.08 0.07
Size of investment Revenue stream
Construction costs
Orignal concession period
Severity of risks involved
Rehabilitation costs Traffic count ++ Salvage value
-
NPV. Estimation Process
-
Concession Period
Market situation
Maintenance costs
Operation revenue per year Income per year
+ Project income + +
Return on investment
Fig. 2. Proposed SD model for calculating concession period. © ASCE
04518022-7
J. Leg. Aff. Dispute Resolut. Eng. Constr., 2018, 10(4): 04518022
J. Leg. Aff. Dispute Resolut. Eng. Constr.
40
To make it further understandable, the maximum extendable and reducible lengths of CPs were checked separately. This was achieved with two-point iterations with values 0 for obtaining maximum reduction and 2 for maximum extension. Fig. 3 shows the resulting graphs. The maximum allowable extension is graphically represented using values of 1 for the 20-year project and 2 for the factors to show the extension. The 20-year concession and the allowable extension are graphed separately.
34.2
30 20 10
5.8
Years 2016
2036
CP Start
CP Finish
40
Model Validation
34.2
Downloaded from ascelibrary.org by Fahim Ullah on 08/13/18. Copyright ASCE. For personal use only; all rights reserved.
30 20
20
10 Years 2016
2036
CP Start
CP Finish
30 20
20 10
5.8 Years 2016
2036
CP Start
CP Finish
Existing Concession Period Legends
Proposed Concession Period
Fig. 3. Maximum allowable variations in concession period of 20 years CP0 for proposed model.
random pattern. To make sense of graphs, focus must be on the trend lines which is the actual CP pattern. The maximum allowable extension for an original period of 20 years is 34.2 (Fig. 3), which is quite logical because the proposed model allows for a 71% extension. In addition, the maximum reducible length of this concession is 5.8 years due to the 29% fixed portion. Thus, the system works in accordance with the developed equation with maximum allowable extension between 0.29 and 1.71.
After obtaining the trend lines for maximum possible variations in the CP0 , the model was validated using five case studies. The case study projects were simulated using the developed model based on the increase (I) or decrease (D) in the value of a particular factor from inception to its current state, the corresponding K, and the CP0 to obtain the MCP. The increase or decrease incorporates the dynamism in values because at any particular time there can be an increase or decrease in the value of a CSF that can be catered for in the upcoming revision of CP. Thus, CP can be revised accordingly to ensure a win-win situation for both public and private entities. Project managers and upper managerial executives ranked and determined the increase or decrease of each CSF for each case study. In the case of a difference in values, multiple rounds of discussions were performed to reach a consensus. Table 5 presents the factors for each project. For example, in the first project, RS increased 11%, as reflected in the corresponding RS column. The resulting K value indicates a reduction in the original concession. Similarly, in the second project IS and SIR decreased and RS and PI increased, which are reflected in the MCP using the obtained K value. Fig. 4 shows detailed simulation output. Although an initial CP of 10 years was awarded to Project 1, the payback was achieved in almost half that time. According to the findings of this study, the postfeasibility studies conducted in 2015 revealed an interesting pattern of recovery according to which the project concession was overestimated. The CP was revised with mutual consent and handed back to NHA after only 6 years in 2015. The calculations suggest a justified CP of 6.1 years (Fig. 4). The calculation only strengthens what was already known in this scenario. The key factor leading to the success of this project was its substantial payback in the form of large toll volume due to increased traffic. Furthermore, due to positive sociopolitical conditions, the market was supportive. In addition, the smaller project size, the less-complicated nature, brownfield construction, and easy access approach due to nonproximity to any urban area aided the quick financial recovery. Had a proper procedure been followed in the planning phase or a revision mechanism for CP existed, the project could have been realistically planned to award a justified concession or revise it accordingly. Project 2 was an extension of an existing route with tolling as the source of major income. The CP0 was 25 years based upon local experience. From the findings, it seems that the project would have
Table 5. Input and result of case study simulations Factors (%)
I
D
I
D
I
D
I
D
I
D
I
D
K
Original concession period
— — — — —
— — — — —
50 11 — — —
— — 5 — 20
— — 15 30 40
70 — — — —
70 10 — — —
— — — 15 10
50 — — — —
— — — 8 30
— — 10 10 10
20 — — — —
0.61 0.985 1.012 1.082 1.127
10 25 20 25 25
NPV Project 1 2 3 4 5 © ASCE
RS
SIR
PI
MS
IS
04518022-8
J. Leg. Aff. Dispute Resolut. Eng. Constr., 2018, 10(4): 04518022
Modified concession period 6.1 24.6 20.4 27.04 28.17
J. Leg. Aff. Dispute Resolut. Eng. Constr.
12 8
10
24
6.1
16
4
8
0 Years
2009 CP Start
0 Years 2003
2015
CP Start
CP Finish
(a)
20.4 20
20 Downloaded from ascelibrary.org by Fahim Ullah on 08/13/18. Copyright ASCE. For personal use only; all rights reserved.
25 24.6
2028
(b)
27 25
24
13.3
16
6.5
8
CP Finish
0 Years
2014 CP Start
Years
2034
(c)
2016 CP Start
CP Finish
2041
(d)
CP Finish
28.2 25
24 16 8 0 Years
2016
2041
(e)
CP Start
Legends
CP Finish
Existing Concession Period Proposed Concession Period
Fig. 4. SD simulations of case project concession periods: (a) Project 1; (b) Project 2; (c) Project 3; (d) Project 4; and (e) Project 5.
been justified even with a CP of 24.5 years under the existing conditions. This reduction in concession is associated with an average growth of 30% in the number of vehicles or transportation means during years 2003–2005. No route promotion was required to attract new traffic because the route was already well established. High tolling was possible during the years of the concession. The companies involved in construction have high expertise in field of highway construction. Based on this finding, it can be recommended that if the preceding conditions prevail, the CP can be shortened. In the current form, the concessionaire seems to have been incentivized to commit to the project. This must be appreciated, but not at the cost of opportunities for public revenue generation. This warrants the dynamism in CP which is at the core of this study. Project 3 output suggests that, based upon the current situation, the CP must be increased to almost 20.5 years to incorporate the additional risks and decreasing RS. Because only 3 years have passed since the start of construction, the situation seems very alarming and demands keeping the concession in check; otherwise the project will need extension for proper financial recovery or may © ASCE
fuel disputes among the key stakeholders. Among other factors, PI and MS balance each other because of soon-to-be-constructed interchanges and, subsequently, more toll production. Therefore, there will be no overall change in expected motorway usage. The main reason for the increase in CP can be linked to the lack of coordination and communication between the stakeholders, as noted by the PM representatives, and the increased risks of rework due to poor quality management and schedule crashing. A followup inspection issued nonconformance for a 6-km patch and served a reconstruction notice. This validates the findings of the model and points to the need for early corrective actions to avoid a required concession extension. Project 4 originally sought CP of 25 years. Because of the risky nature of the project due to lack of proper tolling, a prequalification technique was used to shortlist the potential contractors. The PI is supposed to follow the tolling stream mainly along with government subsidies because tolls are not expected to entirely meet the contractor’s expenses. The total project cost was estimated at PKR 52 billion (USD 0.50 billion). The Ministry of Planning and Development committed PKR 18 billion (USD 0.17 billion) under
04518022-9
J. Leg. Aff. Dispute Resolut. Eng. Constr., 2018, 10(4): 04518022
J. Leg. Aff. Dispute Resolut. Eng. Constr.
Downloaded from ascelibrary.org by Fahim Ullah on 08/13/18. Copyright ASCE. For personal use only; all rights reserved.
viability gap funding (VGF), and the Ministry of Finance will lend PKR 5 billion (USD 0.048 billion) to NHA. The accumulated sum of PKR 23 billion (USD 0.22 billion) will be provided to FWO as financial assistance during the construction phase. The results indicate that the CP should be increased to 27.04 years to incorporate the additional financial risks associated with the project due to lack of tolling and required traffic. Furthermore, because it is a greenfield construction, the project risk is high. Thus, the originally determined CP is not feasible for the project and is recommended for revision based upon the findings. Project 5 is an example of a poorly planned project and has faced several procurement failures, and serves as a bad example of project planning. Because the project could not start in last three procurements, its cost has jumped from an originally estimated PKR 7 billion (USD 0.067 billion) in 2005 to PKR 36 billion (USD 0.34 billion) in 2015. The main reason for the unsuccessful procurement is lack of political will of the prime stakeholders. Sociopolitical complexity in the form of land acquisition has been one of the primary issues in this project. As a result, the government awarded the project to FWO, which is a state-owned enterprise with similar success stories to its credit. The input values were obtained from project experts in accordance with the previously mentioned experience guidelines. The simulation results (Fig. 4) point to an increased CP of over 28 years. This increase in concession is directly associated with increased risks, deteriorating MS, and lesser revenue availability. The concessionaire confidence is also disturbed by the project history of previous failures to start, as reflected by the values assigned to each factor. If these conditions prevail, the findings advocate a concession extension up to 28.2 years to incorporate the increased risks and poor MS.
Discussion The findings of the simulated case projects show that considering all risks in concession estimation is a challenging task due to data demands and analytical complexities. The proposed methodology advocates revisiting the originally awarded concessions to accommodate complex emergent risk. This points to a weak PPP system in the country, which is primarily due to the recent and immature focus on this delivery mechanism. The system is infested with weak legal, contractual, and methodical mechanisms. Because only one PPP project has completed its concession, the possible documented repercussions cannot be discussed with proper reference. This study highlights the upcoming problem of possible concession extension which can cause disputes. Therefore, proactive management is required to get the projects back on track by either developing contingency plans or increasing the concessions, as highlighted by the findings. The inability to do so may not only result in failure of specific projects but will paint a negative picture of the entire PPP procurement capability of the concerned authorities. Such a negative image will discourage investors who may otherwise be agents of running the engine of the economy and uplifting social standards by providing jobs and better infrastructure (Rahmani et al. 2017). The proposed model can be used to verify an estimated concession and dynamically revise it at regular preagreed intervals. This will help the local stakeholders in realistic concession assignment and subsequent modification. Other market segments can modify the model according to their contextual needs and priorities. As mentioned, the revision mechanism along with incorporating the strategy offered by this study may help rationalize concession lengths. This may result in increased investor confidence in two ways: working out holistic concession agreements that consider © ASCE
the locally focused CSFs, and ensuring timely recovery of capital as well as interest due to realistic assessment at the planning stage and reliable monitoring during the project life. The increased confidence will boost the infrastructure procurement, resulting in better and more-economically constructed facilities. The agencies will also benefit in the form of better estimates of total project cost during the prefeasibility phase in which the financial evaluation is performed incorporating country-specific factors that affect private and public stakeholders. With this knowledge, public agencies may better perform the concession negotiation and set the toll rules, keeping in view not only the present economic conditions but also the financial projections (Ullah and Thaheem 2017). End users will benefit in the form of nominal tariff charges and improved quality of service because the probabilistic analysis, considering the performance curves, will dictate maintenance and rehabilitation decisions, ensuring top-quality road conditions resulting in reduced travel time and improved ride quality. Thus, the models provide reliable estimation and reassessment of CP at any stage within the project lifecycle.
Conclusions This study identified 59 CSFs that affect CP. The results of the survey of 26 industrial and 30 academic experts determined that NPV, PI, RS, SIR, MS, and IS are the most influential aspects, with a minimum of 8% influence by MS and IS, and a maximum of 29% influence by NPV. Further analysis showed that NPV received the highest value, which is in accordance with the published literature and its association with financial concerns and return, which is seemingly the top priority in PPP projects. Additionally, a quantitative model based on the top influential factors was developed and served as an input to develop a SD model to determine the CP under the influence of CSFs. Because the existing models are not capable of meeting the increasing complexities and demands of PPP concessions and a universal model may not be the best solution, the proposed model solves this dilemma through localized CSFs. The proposed model was validated by simulating five local case studies of completed and ongoing infrastructure projects with a minimum concession of 10 years to forecast the required concession under current circumstances. Case Projects 3–5 indicated that due to nonconsiderations of the identified CSFs, an extension is necessary. The reasons for this anomaly include quality management, risky greenfield construction, and lack of promotion and interests of the public bodies in the form of local PPP policies. The projects in initial stages of execution can still be controlled if the identified CSFs are incorporated; otherwise extension will be the remedy, as shown by the simulation results. Furthermore, the conclusions were strengthened by the findings of Project 1 which clearly highlighted an erroneous CP assessment, and had the concessionaire not presented the idea of transfer, the project would have been a failure based upon postcompletion assessments. Project 2 was the only project demanding concession reduction, pointing to its better assessment mainly due to the increased traffic and usage of the route. The key takeaway from this study is the introduction of the dynamic CP modification model. Thus, a CP can be estimated properly if localized CSFs used in this model are incorporated. Even if because of unforeseen reasons an unrealistic CP is estimated, the model provides a dynamic recovery mechanism through which the CP can be revised after a preagreed interval on a regular basis. This will not only ensure that the project is progressing well, but will also entail the ever-required partnership and win-win situation for both parties. If the project is progressing well and preagreed
04518022-10
J. Leg. Aff. Dispute Resolut. Eng. Constr., 2018, 10(4): 04518022
J. Leg. Aff. Dispute Resolut. Eng. Constr.
Downloaded from ascelibrary.org by Fahim Ullah on 08/13/18. Copyright ASCE. For personal use only; all rights reserved.
(NPV-based) recovery can be achieved in less time than original CP, the CP can be reduced. Otherwise, in the case of a poorly performing project due to changes in condition or underestimating the original CP (not based on a contractor default), the CP can be increased to ensure no loss to the private entity. Thus, it will increase investor confidence in the public authorities by ensuring a no-loss situation in case of no default. This will foster a positive image of PPPs and attract more private investment, which is an asset for developing countries. Because of the limited results of the real-life PPP projects, the potential repercussions of unrealistic concession assignments are not known. Therefore, in the face of complex emergent scenarios, this study suggests that local practitioners should proactively manage the concession risks. The proposed models, treating the CP as a dynamic concept, contribute to a more transparent concession system by introducing the possibility of systematic modification and enhancing the chances to achieve a win-win scenario. It is the first step toward enhancing the CP revision in developing countries, and further exploratory studies are required to enrich its potential by incorporating the effects of social welfare and user expectations on CP length. The proposed model is highly adaptive and flexible, allowing incorporation of additional factors. Furthermore, management research, being ontological in nature, will always be subjective, which may allow for disagreements, because the current study was largely influenced by experts from developing countries with limited resources and unique constraints. The study can yield different results when repeated in a different context, and this is a future direction for expansion of the proposed model.
References Works Cited Akintoye, A., and E. Chinyio. 2005. “Private finance initiative in the healthcare sector: Trends and risk assessment.” Eng. Constr. Archit. Manage. 12 (6): 601–616. https://doi.org/10.1108/09699980510634155. Akintoye, A., and J. Main. 2007. “Collaborative relationships in construction: The UK contractors’ perception.” Eng. Constr. Archit. Manage. 14 (6): 597–617. https://doi.org/10.1108/09699980710829049. Albalate, D., G. Bel, P. Bel-Pi˜nana, and R. R. Geddes. 2015. “Risk mitigation and sharing in motorway PPPs: A comparative policy analysis of alternative approaches.” J. Comp. Policy Anal. Res. Pract. 17 (5): 481–501. https://doi.org/10.1080/13876988.2015.1010788. Albalate, D., L. Fernández, and A. Yarygina. 2013. “The road against fatalities: Infrastructure spending vs. regulation?” Accid. Anal. Prev. 59 (10): 227–239. https://doi.org/10.1016/j.aap.2013.06.008. Alireza, V., Y. Mohammadreza, R. M. Zin, N. Yahaya, and N. M. Noor. 2013. “An enhanced multi-objective optimization approach for risk allocation in public–private partnership projects: A case study of Malaysia.” Can. J. Civ. Eng. 41 (2): 164–177. https://doi.org/10 .1139/cjce-2013-0342. Carbonara, N., N. Costantino, L. Gunnigan, and R. Pellegrino. 2015. “Risk management in motorway PPP projects: Empirical-based guidelines.” Transp. Rev. 35 (2): 162–182. https://doi.org/10.1080/01441647 .2015.1012696. Carmona, M. 2010. “The regulatory function in public-private partnerships for the provision of transport infrastructure.” Res. Transp. Econ. 30 (1): 110–125. https://doi.org/10.1016/j.retrec.2010.10.012. Cheung, E., A. P. Chan, and S. Kajewski. 2010. “Suitability of procuring large public works by PPP in Hong Kong.” Eng. Constr. Archit. Manage. 17 (3): 292–308. https://doi.org/10.1108/09699981011038088. Cruz, C. O., and R. C. Marques. 2012. “Risk-sharing in highway concessions: Contractual diversity in Portugal.” J. Prof. Issues Eng. Educ. Pract. 139 (2): 99–108. https://doi.org/10.1061/(ASCE)EI.1943-5541 .0000131. © ASCE
De Marco, A., G. Mangano, A. Corinna Cagliano, and S. Grimaldi. 2012. “Public financing into build-operate-transfer hospital projects in Italy.” J. Constr. Eng. Manage. 138 (11): 1294–1302. https://doi.org/10.1061 /(ASCE)CO.1943-7862.0000545. Ding, Z., G. Yi, V. W. Tam, and T. Huang. 2016. “A system dynamics-based environmental performance simulation of construction waste reduction management in China.” Waste Manage. 51 (4): 130–141. https://doi.org /10.1016/j.wasman.2016.03.001. Domingues, S., and D. Zlatkovic. 2015. “Renegotiating PPP contracts: Reinforcing the ‘P’ in partnership.” Transp. Rev. 35 (2): 204–225. https://doi.org/10.1080/01441647.2014.992495. Edkins, A. J., and H. J. Smyth. 2006. “Contractual management in PPP projects: Evaluation of legal versus relational contracting for service delivery.” J. Prof. Issues Eng. Educ. Pract. 132 (1): 82–93. https://doi .org/10.1061/(ASCE)1052-3928(2006)132:1(82). Gurgun, A. P., and A. Touran. 2013. “Public-private partnership experience in the international arena: Case of Turkey.” J. Manage. Eng. 30 (6): 04014029. https://doi.org/10.1061/(ASCE)ME.1943-5479.0000213. Hu, B., A. Leopold, and S. Pickl. 2015. “Concept and prototype of a web tool for public–private project contracting based on a system dynamics model.” Cent. Eur. J. Oper. Res. 23 (2): 407–419. https://doi.org/10 .1007/s10100-014-0378-z. Hu, H., and Y. Zhu. 2014. “Social welfare–based concession model for build/operate/transfer contracts.” J. Constr. Eng. Manage. 141 (1): 04014064. https://doi.org/10.1061/(ASCE)CO.1943-7862.0000920. Jefferies, M., and W. McGeorge. 2009. “Using public-private partnerships (PPPs) to procure social infrastructure in Australia.” Eng. Constr. Archit. Manage. 16 (5): 415–437. https://doi.org/10.1108 /09699980910988348. Karim, N. A. A. 2011. “Risk allocation in public private partnership (PPP) project: A review on risk factors.” Int. J. Sustainable Constr. Eng. Technol. 2 (2): 8–16. Ke, Y., S. Wang, A. P. Chan, and P. T. Lam. 2010. “Preferred risk allocation in China’s public–private partnership (PPP) projects.” Int. J. Project Manage. 28 (5): 482–492. https://doi.org/10.1016/j.ijproman.2009.08 .007. Khan, K. I. A., R. Flanagan, and S.-L. Lu. 2016. “Managing information complexity using system dynamics on construction projects.” Constr. Manage. Econ. 34 (3): 192–204. https://doi.org/10.1080/01446193 .2016.1190026. Khanzadi, M., F. Nasirzadeh, and M. Alipour. 2012. “Integrating system dynamics and fuzzy logic modeling to determine concession period in BOT projects.” Autom. Constr. 22 (2): 368–376. https://doi.org/10 .1016/j.autcon.2011.09.015. Kumaraswamy, M. M., F. Y. Ling, A. M. Anvuur, and M. Motiar Rahman. 2007. “Targeting relationally integrated teams for sustainable PPPS.” Eng. Constr. Archit. Manage. 14 (6): 581–596. https://doi.org/10 .1108/09699980710829030. Liu, T., and S. Wilkinson. 2014. “Using public-private partnerships for the building and management of school assets and services.” Eng. Constr. Archit. Manage. 21 (2): 206–223. https://doi.org/10.1108/ECAM-10 -2012-0102. Love, P. E., J. Liu, J. Matthews, C.-P. Sing, and J. Smith. 2015. “Future proofing PPPs: Life-cycle performance measurement and building information modelling.” Autom. Constr. 56 (8): 26–35. https://doi.org/10 .1016/j.autcon.2015.04.008. Marsden, G. 2005. “The multi modal study of transport investment plans.” Transport 158 (2): 75–87. https://doi.org/10.1680/tran.2005.158.2.75. Meng, Q., and Z. Lu. 2017. “Quantitative analyses of highway franchising under build-operate-transfer scheme: Critical review and future research directions.” Transp. Res. Part B Methodol. 102 (8): 105–123. https://doi .org/10.1016/j.trb.2017.05.009. Morecroft, J. D. 2015. Strategic modelling and business dynamics: A feedback systems approach. Hoboken, NJ: Wiley. Mouraviev, N., and N. K. Kakabadse. 2017a. “Critical issues in PPP development, an emerging policy paradigm and the future of PPPs.” In Public–private partnerships, 203–220. London: Palgrave Macmillan. Mouraviev, N., and N. K. Kakabadse. 2017b. “PPP meanings and forms: A critical appraisal.” In Public–private partnerships, 1–16. London: Palgrave Macmillan.
04518022-11
J. Leg. Aff. Dispute Resolut. Eng. Constr., 2018, 10(4): 04518022
J. Leg. Aff. Dispute Resolut. Eng. Constr.
Downloaded from ascelibrary.org by Fahim Ullah on 08/13/18. Copyright ASCE. For personal use only; all rights reserved.
MWAA (Metropolitan Washington Airports Authority). 2015. Road usage charging and transportation finance summit April 26–28. Portland, OR: MWAA. Ng, S. T., J. Xie, Y. K. Cheung, and M. Jefferies. 2007a. “A simulation model for optimizing the concession period of public–private partnerships schemes.” Int. J. Project Manage. 25 (8): 791–798. https://doi.org /10.1016/j.ijproman.2007.05.004. Ng, S. T., J. Xie, M. Skitmore, and Y. K. Cheung. 2007b. “A fuzzy simulation model for evaluating the concession items of public–private partnership schemes.” Autom. Constr. 17 (1): 22–29. https://doi.org/10 .1016/j.autcon.2007.02.010. NHA (National Highways Authority). 2015. List of public private partnerships. Islamabad, Pakistan: NHA. NHA (National Highways Authority). 2017. List of public private partnership (PPP) projects. Islamabad, Pakistan: NHA. Opawole, A., and G. O. Jagboro. 2016. “Factors influencing the scope of private party’s obligations in concession-based PPP projects in Nigeria.” Struct. Surv. 34 (3): 297–314. Osei-Kyei, R., and A. P. Chan. 2015. “Review of studies on the critical success factors for public–private partnership (PPP) projects from 1990 to 2013.” Int. J. Project Manage. 33 (6): 1335–1346. https://doi .org/10.1016/j.ijproman.2015.02.008. Osei-Kyei, R., and A. P. Chan. 2017. “Perceptions of stakeholders on the critical success factors for operational management of public-private partnership projects.” Facilities 35 (1–2): 21–38. https://doi.org/10 .1108/F-10-2015-0072. PEC (Pakistan Engineering Council). 2009. Vol. 1 of Standard procedure and formula for price adjustment. 1st ed. Islamabad, Pakistan: PEC. Rahmani, F., T. Maqsood, and M. Khalfan. 2017. “An overview of construction procurement methods in Australia.” Eng. Constr. Archit. Manage. 24 (4): 593. https://doi.org/10.1108/ECAM-03-2016-0058. Rashedi, R., and T. Hegazy. 2016. “Examining budget policies for new and existing facilities: A system dynamics approach.” Can. J. Civ. Eng. 43 (6): 511–522. https://doi.org/10.1139/cjce-2015-0486. Razzaq, A., M. J. Thaheem, A. Maqsoom, and H. F. Gabriel. 2016. “Critical external risks in international joint ventures for construction industry in Pakistan.” Int. J. Civ. Eng. 16 (2): 189–205. https://doi .org/10.1007/s40999-016-0117-z. Rouhani, O. M., R. R. Geddes, H. O. Gao, and G. Bel. 2016. “Social welfare analysis of investment public–private partnership approaches for transportation projects.” Transp. Res. Part A: Policy Pract. 88 (6): 86–103. Shi, S., Y. Yin, and X. Guo. 2016. “Optimal choice of capacity, toll and government guarantee for build-operate-transfer roads under asymmetric cost information.” Transp. Res. Part B Methodol. 85 (3): 56–69. https://doi.org/10.1016/j.trb.2015.12.019. Sterman, J. D. 2001. “System dynamics modeling: Tools for learning in a complex world.” California Manage. Rev. 43 (4): 8–25. https://doi.org /10.2307/41166098. Tieva, A., and J. M. Junnonen. 2009. “Proactive contracting in Finnish PPP projects.” Int. J. Strategic Property Manage. 13 (3): 219–228. https:// doi.org/10.3846/1648-715X.2009.13.219-228. Trangkanont, S., and C. Charoenngam. 2014. “Critical failure factors of public-private partnership low-cost housing program in Thailand.”
© ASCE
View publication stats
Eng. Constr. Archit. Manage. 21 (4): 421–443. https://doi.org/10 .1108/ECAM-04-2012-0038. Trebilcock, M., and M. Rosenstock. 2015. “Infrastructure public-private partnerships in the developing world: Lessons from recent experience.” J. Dev. Stud. 51 (4): 335–354. https://doi.org/10.1080/00220388.2014 .959935. Ullah, F., B. Ayub, S. Q. Siddiqui, and M. J. Thaheem. 2016. “A review of public-private partnership: Critical factors of concession period.” J. Financial Manage. Property Constr. 21 (3): 269–300. https://doi .org/10.1108/JFMPC-02-2016-0011. Ullah, F., and M. J. Thaheem. 2017. “Concession period of public private partnership projects: Industry–academia gap analysis.” Int. J. Constr. Manage. 18 (5): 418–429. https://doi.org/10.1080/15623599.2017 .1333400. Ullah, F., M. J. Thaheem, S. Q. Siddiqui, and M. B. Khurshid. 2017a. “Influence of Six Sigma on project success in construction industry of Pakistan.” TQM J. 29 (2): 276–309. https://doi.org/10.1108/TQM -11-2015-0136. Ullah, F., M. J. Thaheem, and M. Umar. 2017b. “Public-private partnerships in Pakistan: A nascent evolution.” Vol. 1 of Public-private partnerships in transitional nations: Policy, governance and praxis, edited by N. Mouraviev and N. Kakabadse, 127–150. Newcastle upon Tyne, UK: Cambridge Scholars. Wang, J. Y., R. Lindsey, and H. Yang. 2011. “Nonlinear pricing on private roads with congestion and toll collection costs.” Transp. Res. Part B Methodol. 45 (1): 9–40. https://doi.org/10.1016/j.trb.2010.05.004. Wang, Y. 2015. “Evolution of public-private partnership models in American toll road development: Learning based on public institutions’ risk management.” Int. J. Project Manage. 33 (3): 684–696. https://doi .org/10.1016/j.ijproman.2014.10.006. Wibowo, A., and H. Wilhelm Alfen. 2013. “Fine-tuning the value and cost of capital of risky PPP infrastructure projects.” Eng. Constr. Archit. Manage. 20 (4): 406–419. https://doi.org/10.1108/ECAM-11-2011 -0097. Wibowo, A., and H. Wilhelm Alfen. 2014. “Identifying macroenvironmental critical success factors and key areas for improvement to promote public-private partnerships in infrastructure: Indonesia’s perspective.” Eng. Constr. Archit. Manage. 21 (4): 383–402. https://doi.org /10.1108/ECAM-08-2013-0078. Xu, Y., M. J. Skibniewski, Y. Zhang, A. P. Chan, and J. F. Yeung. 2012. “Developing a concession pricing model for PPP highway projects.” Int. J. Strategic Property Manage. 16 (2): 201–217. https://doi.org/10.3846 /1648715X.2012.688071. Yu, C., and K. C. Lam. 2013. “A decision support system for the determination of concession period length in transportation project under BOT contract.” Autom. Constr. 31 (3): 114–127. https://doi.org/10.1016/j .autcon.2012.11.012. Zhang, S., Y. Gao, Z. Feng, and W. Sun. 2015. “PPP application in infrastructure development in China: Institutional analysis and implications.” Int. J. Project Manage. 33 (3): 497–509. https://doi.org/10.1016 /j.ijproman.2014.06.006. Zhang, X., and S. M. AbouRizk. 2006. “Determining a reasonable concession period for private sector provision of public works and service.” Can. J. Civ. Eng. 33 (5): 622–631. https://doi.org/10.1139/l06-010.
04518022-12
J. Leg. Aff. Dispute Resolut. Eng. Constr., 2018, 10(4): 04518022
J. Leg. Aff. Dispute Resolut. Eng. Constr.