Massachusetts Institute of Technology Engineering Systems Division Working Paper Series ESD-WP-2003-01.13-ESD Internal Symposium
SYSTEM DYNAMICS: SYSTEMS THINKING AND MODELING FOR A COMPLEX WORLD
John D. Sterman MIT Sloan School of Management
MAY 29-30, 2002
System Dynamics: Systems Thinking and Modeling for a Complex World John D. Sterman MIT Sloan School of Management Cambridge MA 02421 617.253.1951 (voice) 617.258.7579 (fax)
[email protected] web.mit.edu/jsterman/www
April 2002
Abstract
Today s problems often arise as unintended consequences of yesterday s solutions. Social systems often suffer from policy resistance, the tendency for well-intentioned interventions to be defeated by the response of the system to the intervention itself. The field of system dynamics, created at MIT in the 1950s by Jay Forrester, is designed to help us learn about the structure and dynamics of the complex systems in which we are embedded, design high-leverage policies for sustained improvement, and catalyze successful implementation and change. Drawing on engineering control theory and the modern theory of nonlinear dynamical systems, system dynamics often involves the development of formal models and management flight simulators to capture complex dynamics, and to create an environment for learning and policy design. Unlike pure engineering problems if any exist human systems present unique challenges, including long time horizons, issues that cross disciplinary boundaries, the need to develop reliable models of human behavior, and the great difficulty of experimental testing. Successful change in social systems also requires the active participation of a wide range of people in the modeling and policy design process, people who often lack technical training. In this paper I discuss requirements for the effective use of system dynamics and illustrate with a successful application to a difficult business issue.
In a world of accelerating complexity and change, thoughtful leaders increasingly recognize that the tools we have been using have not only failed to solve the persistent problems we face, but may in fact be causing them. All too often, well-intentioned efforts to solve pressing problems create unanticipated side effects. Our decisions provoke reactions we did not foresee. The result is policy resistance, the tendency for interventions to be defeated by the response of the system to the intervention itself. From California s failed electricity reforms, to road building programs that create suburban sprawl and actually increase traffic congestion, to pathogens that evolve resistance to antibiotics, our best efforts to solve problems often make them worse (Exhibit 1). While we like to imagine new technologies and accelerating change pose new and unique challenges, policy resistance is nothing new. In 1516, Sir Thomas More wrote in Utopia about the problems of policymaking, saying
And it will fall out as in a complication of diseases, that
by applying a remedy to one sore, you will provoke another; and that which removes the one ill symptom produces others. On Meddling,
1
More recently, the late biologist Lewis Thomas, in an essay entitled
(1974, 90) provided both a diagnosis and a solution:
When you are confronted by any complex social system, such as an urban center or a hamster, with things about it that you re dissatisfied with and anxious to fix, you cannot just step in and set about fixing with much hope of helping. This realization is one of the sore discouragements of our century...You cannot meddle with one part of a complex system from the outside without the almost certain risk of setting off disastrous events that you hadn t counted on in other, remote parts. If you want to fix something you are first obliged to understand...the whole system. Intervening is a way of causing trouble. But how can one come to understand the whole system and avoid policy resistance? For many, the solution lies in systems thinking the ability to see the world as a complex system, to understand how
everything is connected to everything else.
With a holistic worldview, it is
argued, we would be able to learn faster and more effectively, identify high leverage points, avoid policy resistance and make decisions consistent with our long-term best interests.2
1
More, T. (1516) Utopia. This translation is available at eserver.org/fiction/utopia.txt. 2 There are many schools of systems thinking (see Richardson 1991). Some emphasize qualitative methods; others stress formal modeling. They draw on fields as diverse as anthropology, biology, engineering, linguistics, psychology, physics, and Taoism and seek applications in fields still more diverse. All agree, however, that a systems view of the world is still rare.
2
• California’s partial deregulation of the electricity market, touted as a way to lower costs to consumers, led to record rates, rolling blackouts, and economic and political turmoil. • The United States spends more on health care than any other nation in the world (both total and as a fraction of GDP), yet more than 40 million people have no health care coverage, and the US lags behind most other developed nations in life expectancy and infant mortality. • Low tar and nicotine cigarettes actually increase intake of carcinogens and carbon monoxide as smokers compensate for the low nicotine content by smoking more cigarettes per day, by taking longer, more frequent drags, and by holding the smoke in their lungs longer. • Road building programs designed to reduce congestion have increased traffic, delays, sprawl, and pollution. • Despite widespread use of labor-saving appliances, Americans have less leisure today than 50 years ago. • The US government’s war on drugs, focusing on interdiction and supply disruption (particularly cocaine production in South America), with a cost of billions per year, has had only a small impact on cocaine cultivation, production, or smuggling. Drug use in America and elsewhere remains high. • The US policy of fire suppression has increased the number and severity of forest fires. Rather than frequent, small fires, fire suppression leads to the accumulation of dead wood and other fuels leading to larger, hotter, and more dangerous fires, often consuming the oldest and largest trees, which previously survived smaller fires unharmed. • Flood control efforts such as levee and dam construction have led to more severe floods by preventing the natural dissipation of excess water in flood plains. The cost of flood damage has increased as the flood plains were developed by people who believed they were safe. • Imposing 200-mile territorial limits and fishing quotas to protect fish stocks did not prevent the collapse of the George’s Bank fishery off the coast of North America. Once the world’s richest, by the mid 1990s many species were commercially extinct, the fishery was shut down, the fleets were idled, and the local economies were in depression. • Deregulation of the US Savings and Loan industry, designed to save the industry from financial problems, led to a wave of speculation followed by collapse, at a cost to taxpayers in the hundreds of billions of dollars. • Antiretroviral drugs have been a literal lifesaver for people living with HIV, if they can afford them. But the drop in mortality has led to a reduction in the perceived risks of the virus. In some communities people are engaging in more risky behaviors and are less vigilant about safe practices, and the incidence of new cases of HIV infection, after years of decline, is rising. • Antibiotics have stimulated the evolution of drug-resistant pathogens, including virulent strains of TB, strep, staph, and sexually transmitted diseases. Pesticides and herbicides have stimulated the evolution of resistant pests and weeds, killed off natural predators, and accumulated up the food chain to poison fish, birds, and, sometimes, humans.
Exhibit 1 Examples of policy resistance
3
The challenge is how to move past slogans about accelerating learning and systems thinking to useful tools that help us understand complexity, design better operating policies, and guide effective change. However, learning about complex systems when you also live in them is difficult. We are all passengers on an aircraft we must not only fly but redesign in flight. In responding to the challenge of social system complexity, the concepts, tools, and world-view of the engineer and scientist have much to contribute. Scientific method and the concepts of nonlinear dynamics are just as applicable to human systems as they are to physical, biological, and technical issues. System dynamics (Forrester 1961, Sterman 2000) is firmly rooted in these traditions. Growing out of control theory and servomechanisms design and pioneered at MIT in the 1950s by Jay Forrester, system dynamics is, partly, a method for developing and testing formal mathematical models and computer simulations of complex nonlinear dynamical systems; as such it has much in common with other modeling methods. But successful policy design in complex dynamic systems requires more than technical tools and mathematical models. Despite its roots in engineering, system dynamics is not the na ve application of mathematics to social problems. It is not a method for a technical priesthood to dominate policy through
social engineering.
For many of the most important problems there
are no purely technical solutions. Indeed, there are no purely technical problems. To be effective, engineering must consider the social, political, ecological and other impacts of proposed technical solutions.3 Failure to do so leads to unanticipated
side effects
that damage
human welfare, and, more often than not, to the failure of the engineering solution on its own terms (nuclear power provides a textbook example: promising safe power
too cheap to meter ,
it proved to be far more expensive and dangerous and continues to generate unsolved problems with safety, waste disposal, proliferation, and terrorism). To reduce the chance of falling into such traps, system dynamics is fundamentally interdisciplinary. Because we are concerned with the behavior of complex systems, system dynamics is grounded in the theory of nonlinear dynamics and feedback control developed in 3
Likewise, effective social science must expand the boundary of concern to include interactions with the physical, technical, and natural world (and interactions across disciplinary boundaries within the social sciences).
4
mathematics, physics, and engineering. Because we apply these tools to the behavior of human as well as technical systems, system dynamics also draws on cognitive and social psychology, organization theory, economics, and other social sciences. Because we strive to solve important real world problems, we must learn how to work effectively with groups of busy policy makers and how to catalyze change in organizations and in society at large. This paper provides a brief overview of the system dynamics perspective and process. I briefly discuss how policy resistance arises from the mismatch between the dynamic complexity of the systems we have created and our cognitive capacity to understand that complexity. Research shows that policy resistance most often arises not because we lack the technical knowledge and tools to model the problem, but because our mental models systematically lead us to incorrect inferences about the dynamics of even the simplest systems. Therefore I do not dwell on the technical characteristics of the models or software. Readers interested in learning more about the method should refer to Sterman (2000) and the growing scholarly and practitioner literature. Instead I illustrate how system dynamics is used through a case study of a successful application. Dynamic Complexity As wonderful as the human mind is, the complexity of the world dwarfs our understanding.4 Our mental models are limited, internally inconsistent, and unreliable. Our ability to understand the unfolding impacts of our decisions is poor. We take actions that make sense from our short-term and parochial perspectives, but these decisions often feed back to hurt us in the long run. To understand the sources of policy resistance we must therefore understand both the complexity of systems and the mental models of those systems we use to make decisions. Complexity is often defined in terms of the number of, or links among, the elements of a system, or the dimensionality of a search space. Such systems have high combinatorial complexity. However, most cases of policy resistance arise from dynamic complexity the often counterintuitive behavior of complex systems that emerges from the interactions of the agents over time (Exhibit 2).
4
See the late Herbert Simon’s concept of bounded rationality, e.g., Simon (1969/1996).
5
Dynamic complexity arises because systems are • Constantly changing: Heraclitus said, “All is change.” What appears to be unchanging is, over a longer time horizon, seen to vary. Change in systems occurs at many time scales, and these different scales sometimes interact. A star evolves over billions of years as it burns its hydrogen fuel, then can explode as a supernova in seconds. Bull markets can go on for years, then crash in a matter of hours. • Tightly coupled: The actors in the system interact strongly with one another and with the natural world. Everything is connected to everything else. As a famous bumper sticker from the 1960s proclaimed, “You can’t do just one thing.” • Governed by feedback: Because of the tight couplings among actors, our actions feed back on themselves. Our decisions alter the state of the world, causing changes in nature and triggering others to act, thus giving rise to a new situation which then influences our next decisions. Dynamics arise from these feedbacks. • Nonlinear: Effect is rarely proportional to cause, and what happens locally in a system (near the current operating point) often does not apply in distant regions (other states of the system). Nonlinearity often arises from the basic physics of systems: Insufficient inventory may cause you to boost production, but production can never fall below zero no matter how much excess inventory you have. Nonlinearity also arises as multiple factors interact in decisionmaking: Pressure from the boss for greater achievement increases your motivation and effort—up to the point where you perceive the goal to be impossible. Frustration then dominates motivation—and you give up or get a new boss. • History-dependent: Taking one road often precludes taking others and determines where you end up (path dependence). Many actions are irreversible: You can’t unscramble an egg (the second law of thermodynamics). Stocks and flows (accumulations) and long time delays often mean doing and undoing have fundamentally different time constants: During the 50 years of the Cold War arms race the nuclear nations generated more than 250 tons of weapons-grade plutonium (239Pu). The half-life of 239 Pu is about 24,000 years. • Self-organizing: The dynamics of systems arise spontaneously from their internal structure. Often, small, random perturbations are amplified and molded by the feedback structure, generating patterns in space and time. The pattern of stripes on a zebra, the rhythmic contraction of your heart, the persistent cycles in the real estate market, and structures such as sea shells and markets all emerge spontaneously from the feedbacks among the agents and elements of the system. • Adaptive: The capabilities and decision rules of the agents in complex systems change over time. Evolution leads to selection and proliferation of some agents while others become extinct. Adaptation also occurs as people learn from experience, especially as they learn new ways to achieve their goals in the face of obstacles. Learning is not always beneficial, however. • Characterized by trade-offs: Time delays in feedback channels mean the long-run response of a system to an intervention is often different from its short-run response. High leverage policies often cause worse-before-better behavior, while low leverage policies often generate transitory improvement before the problem grows worse. • Counterintuitive: In complex systems cause and effect are distant in time and space while we tend to look for causes near the events we seek to explain. Our attention is drawn to the symptoms of difficulty rather than the underlying cause. High leverage policies are often not obvious. • Policy resistant: The complexity of the systems in which we are embedded overwhelms our ability to understand them. The result: Many seemingly obvious solutions fail or actually worsen the problem.
Exhibit 2. Dynamic complexity
6
Dynamic complexity can arise even in simple systems with low combinatorial complexity. For example, courses in system dynamics often begin with the
Beer Distribution Game,
a role-
playing board game simulating a manufacturing supply chain (Sterman 1989a). There is only one SKU, not tens of thousands. Each player has exactly one customer and one supplier. Yet players consistently generate wild fluctuations in production and inventory, and average costs are ten times greater than optimal. Intricate and dysfunctional dynamics arise from a game you can learn in 15 minutes and play on your dining room table. Exhibit 2 describes some of the characteristics of complex dynamic systems. These attributes are common, but counterintuitive. Where the world is dynamic, evolving, and interconnected, we tend to make decisions using mental models that are static, narrow, and reductionist. Among the elements of dynamic complexity people find most problematic are feedback, time delays, and stocks and flows. The heuristics we use to make causal attributions frequently fail to overcome these problems, and instead often reinforce erroneous beliefs. Feedback One cause of policy resistance is our tendency to interpret experience as a series of events, for example,
inventory is too high,
or
sales fell last month.
Accounts of who did what to whom
are the most common mode of discourse, from the mailroom to the boardroom, from the headlines to the history books. We are taught from an early age that every event has a cause, which in turn is an effect of some still earlier cause:
Inventory is too high because sales
unexpectedly fell. Sales fell because the competitors lowered their price. The competitors lowered their price because.
Such event-level explanations can be extended indefinitely.
They allow us to blame others for our difficulties, but also, as a consequence, reinforce the belief that we are powerless, mere leaves tossed on winds of change we can neither predict nor control. The event-oriented, open-loop worldview leads to an event-oriented, reactionary approach to problem solving (Exhibit 3). We assess the state of affairs and compare it to our goals. The gap between the situation we desire and the situation we perceive defines our problem. For example, suppose your firm s profits fall below Wall Street expectations. You need to boost profits, or you ll be searching for a new job. You consider various courses of action, select the options you
7
deem best, and implement them. You might initiate various process improvement programs to boost productivity, increase the number of new products in the development pipeline to boost sales, and announce a round of layoffs to cut expenses. Your consultants and pro forma analyses suggest these decisions will restore growth and profitability. The consultants move on, and you turn to other pressing issues. Problem solved or so it seems.
Goals Problem
Decision
Results
Situation
Exhibit 3 The open-loop, event-oriented view of the world
Contrary to the sequential, open-loop view in Exhibit 3, real systems react to our interventions. There is feedback: The results of our actions define the situation we face in the future. The new situation alters our assessment of the problem and the decisions we take tomorrow (see the top of Exhibit 4). And, as shown in the bottom of Exhibit 4, our actions may also trigger side effects we didn t anticipate. Other agents, seeking to achieve their goals, react to restore the balance we have upset. Policy resistance arises because we do not understand the full range of feedbacks operating in the system. The improvement initiatives you mandated never got off the ground because layoffs destroyed morale and increased the workload for the remaining employees. New products were rushed to market before all the bugs were worked out, so now warranty claims explode while sales slump. Customer complaints overwhelm your call centers and service organization. Stressed by long hours and budget cuts, your most talented engineers and managers quit to take better jobs with your competitors. Yesterday s solutions become today s problems. Without an understanding of the feedback processes that create these outcomes as a consequence of our own decisions, we are likely to see these new crises as more evidence confirming our view that the world is unpredictable and uncontrollable.
8
Decisions Goals
Environment Our decisions alter our environment, leading to new decisions, Decisions Side Effects
Goals Environment
Goals of Other Agents
Actions of Others
but also triggering side effects, delayed reactions, changes in goals and interventions by others. These feedbacks may lead to unanticipated results and ineffective policies.
Exhibit 4 The feedback view of the world
Time Delays Time delays between taking a decision and its effects on the state of the system are common and particularly troublesome. Delays in feedback loops create instability and increase the tendency of systems to oscillate.5 Driving a car, drinking alcohol, and building a new semiconductor wafer fab all involve time delays between the initiation of an action (accelerating/braking, deciding to
have another,
developing a new fab) and its effects on the state of the system. As a
result, decision makers often continue to intervene to correct apparent discrepancies between the desired and actual state of the system long after sufficient corrective actions have been taken to 5
Time delays add phase lag elements to feedback loops. In negative loops, delays reduce the phase margin of the linearized system. Enough phase lag causes some system eigenvalues to become complex conjugates, allowing oscillatory modes to arise. More phase lag can easily cause these eigenvalues to cross into the right half plane (e.g., in a Hopf bifurcation), causing the (linearized) system to become locally unstable. For example, the time delays in the Beer Distribution Game and even simpler management flight simulators interact with the decision rules of many players to create limit cycles and chaotic fluctuations (Sterman 1989a, 1989b, 1989c).
9
restore the system to equilibrium. The result is overshoot and oscillation: stop-and-go traffic, drunkenness, and boom-and-bust cycles in the semiconductor industry. Research shows convincingly that people commonly ignore time delays, even when the existence and contents of the delays are known, leading to overshoot and instability (e.g., Sterman 1989a, 1989b). More subtly, delays reduce our ability to accumulate experience, test hypotheses, and learn. Schneiderman (1988) estimated the process improvement half-life in a wide range of firms. The improvement half-life is the time required to cut the defects generated by a process in half. Improvement half-lives were as short as a few months for simple processes with short cycle times, for example reducing operator error in a job shop, while complex processes with long cycle times such as product development had improvement half lives of several years or more. Long delays slow learning and often thwart the efforts of organizations to improve their core processes (see Sterman, Repenning and Kofman 1997 and Repenning 2001 for examples). Stocks and flows Stocks and flows are fundamental to the dynamics of complex systems. State variables and the rates that alter them are, of course, the core concept of the calculus and differential equations, among other modeling paradigms; these concepts are central in the education of every scientist and engineer. Of course calculus is not needed to understand stocks and flows. People routinely fill and drain their bathtubs and manage their bank balances. Yet research shows that people have only weak intuitive understanding of stocks and flows. Exhibit 5 illustrates with one of the simplest examples: a bathtub. The stock of water in the tub is filled by the inflow and drained by the outflow there are no feedbacks, time delays, nonlinearities, or other complexities. From the graphs of the flows it is easy to infer the trajectory of the stock, and without use of calculus or any mathematics beyond simple arithmetic. However, the average performance of graduate students at the MIT Sloan School of Management was only 46%. In this and related stock-flow problems, many people drew trajectories that violated basic laws of physics such as conservation of matter; for example, less than half showed the water rising when the inflow exceeds the outflow (for the solution and other examples see Booth Sweeney and Sterman (2000) and Sterman and Booth Sweeney (2002)).
10
Consider the bathtub shown below. Water flows in at a certain rate, and exits through the drain at another rate:
The graph below shows the hypothetical behavior of the inflow and outflow rates for the bathtub. From that information, draw the behavior of the quantity of water in the tub on the second graph below. Assume the initial quantity in the tub (at time zero) is 100 liters. 100 Inflow
Flows (liters/minute)
75 Outflow
50
25
0
0
2
4
6
8 10 Time (minutes)
12
14
16
0
2
4
6
8 10 Time (minutes)
12
14
16
Quantity in Tub (liters)
200
150
100
50
0
Exhibit 5 A simple challenge to test how well people understand stocks and flows
11
Many technically trained readers suggest that such poor performance is only to be expected from MBA students. In fact, many were graduate students in engineering or science at MIT. All had taken calculus. Two-thirds had undergraduate degrees in engineering, science, or mathematics and most of the rest were trained in economics. Only 4% had degrees in the humanities. Onethird had previous masters or doctoral degrees, most in technical fields. The best technical education still leaves many unable to grasp the relationship between stocks and flows. Attribution Errors and False Learning Some people believe that experience and market forces enable us to learn quickly about the feedbacks and side effects of our decisions. On the contrary, research shows learning in complex dynamic systems is slow and often harmful (Paich and Sterman 1993, Diehl and Sterman 1995, D rner 1996). The heuristics we use to judge causal relationships are insensitive to feedbacks, nonlinearities, time delays, and other elements of dynamic complexity. To judge causality we use cues such as temporal and spatial proximity of cause and effect, temporal precedence of causes, covariation, and similarity of cause and effect. But in complex systems cause and effect are often distant in time and space, and the delayed and distant consequences of our actions are different from and less salient than their proximate effects or are simply unknown. In complex systems many variables are highly correlated, confounding the task of judging cause. Research shows that few mental models incorporate feedback loops. For example, Axelrod (1976) found virtually no feedback loops in of the cognitive maps of political leaders; rather, they focused on particular decisions they might make and their likely consequences an event-level representation (see also D rner 1996). People tend to assume each event has a single cause and often cease their search for explanations when the first sufficient cause is found (see Plous 1993). In complex systems different people placed in the same structure tend to behave in similar ways. However, we have a strong tendency to attribute the behavior of others to dispositional rather than situational factors, that is, to character and especially character flaws rather than to the system in which these people are embedded, a phenomenon so prevalent psychologists call it the fundamental attribution error Plous ( 1993, Ross 1977). In a famous study, Rosenthal and Jacobson (1992) told grade school teachers that test scores showed a particular 20% of their
12
students would bloom academically in the year ahead. Lo and behold, at the end of the year those students showed larger increases in IQ than the others. There was only one problem: the gifted
students had been chosen entirely at random. The teachers, without realizing it
themselves, set higher expectations for the students labeled as gifted, gave them more help, provided more praise. Thus nurtured, these lucky students did bloom, though they were no different to start than the other children. The others necessarily received less attention, less help, and less praise, falling farther and farther behind. Without the ability to see how they themselves were part of the classroom and community system, how their own behavior helped some to excel while undermining others, the teachers interpreted events such as test grades and class participation as evidence confirming their preconceptions: The high performance of the students in the gifted group proved that they were truly gifted, and the poor performance of the rest proved that these were in fact low achievers. Because they were unaware of the ways in which the system structure shaped their behavior, the teachers learned a false lesson with pernicious consequences. The attribution of behavior to individuals and their character rather than system structure diverts our attention from the high leverage points where redesign of the system can have significant, sustained, beneficial effects on performance. When we attribute behavior to people rather than system structure the focus of management becomes scapegoating and blame rather than the design of organizations in which ordinary people can achieve extraordinary results. System Dynamics Tools and Process System dynamics models are usually formulated as systems of high-order, nonlinear, possibly stochastic differential equations portraying the decision rules of the agents, natural processes, and physical structures relevant to the purpose of the model.6 All nontrivial models will be of such high order and include so many nonlinearities that no analytic solutions are known and the equations are solved by numerical methods. What distinguishes system dynamics models from many other dynamic models is not the mathematics, but the specification of the equations and the modeling process. Good system 6 The
models often include discrete elements, queuing structures, and individual agents, depending on the purpose.
13
dynamics models have a broad model boundary. There should be few exogenous variables. The specification of models should not be compromised (e.g., simplified, linearized) to achieve analytic tractability (though simplification and linearization are often helpful in understanding the behavior of the full model). Statistical methods for parameter estimation should be used where possible and helpful, but good models include all variables thought to be important, whether numerical data to estimate the parameters are available or not. Omitting such so-called soft
variables is less scientific and less accurate than using your best judgment to estimate their
values.
To omit such variables is equivalent to saying they have zero effect probably the only
value that is known to be wrong! (Forrester 1961, 57). Models should be grounded in and tested against the widest array of data, including numerical data, archival information, and qualitative data gleaned from interviews, observation, and other ethnographic methods. The rate equations capturing the decision rules of the agents must be based only on information known to be available to the agents, and capture delays and distortions introduced by measurement and reporting systems, perception processes, and administrative procedures. Models must be robust under extreme conditions and conform to the basic laws of physics, for example, production in a model of a firm cannot proceed without labor, operable equipment, materials, and energy; shipments must be zero when finished inventory is zero. These principles may seem to be nothing more than common sense. It s obvious that people can t use information they don t have, and that physical impossibilities are, well, impossible. Yet many models routinely violate these principles. Economists routinely assume people have perfect information about the customer preferences and production possibilities, perfect knowledge of the future and the ability to predict how others would behave in hypothetical situations information that real people perceive through a fog, if at all. Despite many successes, the history of mathematical modeling is filled models that violate basic physical principles, such as economic models in which production occurs without energy or equipment, climate change models that violate conservation of matter, a hydrological model in which water flowed uphill, or the leather market model that, during economic downturns, turned surplus leather back into cows (see Sterman 2000, Ch. 21, for discussion and examples).
14
System dynamics also addresses the root causes that allow such errors to go undetected and uncorrected: experts who often seek to defend their favored method, fail to make their work available for replication and review, use data selectively, and build models that answer unimportant questions (see Meadows and Robinson 1985). Part of the solution to these problems is opening the process to participation by the widest group of stakeholders, and modern software makes it possible for anyone, not only a technically trained priesthood, to participate in the modeling process.7 Graphical user interfaces enable modelers to quickly capture the feedbacks, stocks and flows, time delays, and nonlinearities they identify. Equations can be written using friendly algebra
so that advanced mathematical training is no longer necessary. Modeling can
now be done in real-time, and with groups. Simulation results can be viewed immediately. Sensitivity analysis, optimization, and parameter estimation can be largely automated. A model can easily be converted into an interactive flight simulator with an intuitive interface. Yet while the software becomes ever easier to use, modeling is not computer programming. Better software does not replace thinking. Tools for learning about complexity must also facilitate the process of systems thinking and policy design. While simulations enable controlled experimentation, they do not require us to apply the principles of scientific method. Our inquiry skills often reinforce rather than correct our biases and judgmental errors. Confirmation and hindsight bias, defensive routines and groupthink can thwart learning from models just as they do in the real system. Effective modeling often requires members of the client team to recognize the limitations of their inquiry skills and address their own defensive behaviors. People unaccustomed to disciplined scientific reasoning and an open, trusting environment with learning as its goal will have to build these basic skills before a system dynamics model or indeed, any model can prove useful. Developing these skills takes effort and practice (see Morecroft and Sterman 1994, Senge 1990). To illustrate these themes, I now describe a successful application of system dynamics to a difficult business issue.
7
See, e.g., iThink (www.hps-inc.com), Powersim (www.powersim.com), and Vensim (www.vensim.com). Sterman (2000) includes a CD containing versions of these programs with more than 60 models in each format.
15
System Dynamics in Action: Automobile Leasing Strategy In 1995 Ron Zarrella, a senior executive (later president) of General Motor s North American Operations (NAO), grew concerned about the impact of used car superstores on new car sales. Chains like CarMax and AutoNation offered low-mileage late-model cars with warranties and other amenities previously available only to new car buyers. Superstore sales grew from nothing in 1992 to more than $13 billion in 1998. How should GM respond? There was little research on the used car market available to help. For many decades the new and used car markets were only loosely coupled because people kept their cars an average of more than 6 years, so used vehicles were poor substitutes for new cars. The prevailing mental model in Detroit was that auto companies were in the business of selling new cars; the old vehicles people traded in effectively disappeared into a separate system, the used car market. There are really two markets new and used,
the executive director of sales operations at Ford
told The Wall Street Journal in 1994 (3 June, p. B1). Zarrella asked Nick Pudar, then a senior business analyst in GM s Corporate Strategy and Knowledge Development organization, to work on the superstore issue. Pudar told Zarrella he would need to commit to a several hour meeting each week for a month working on the right problem.
to be sure we are
While Zarrella s schedule was extremely tight he offered to meet
Pudar the next day. Pudar and Mark Paich, an external system dynamics consultant, spent the rest of the day developing a simple diagram representing the stocks and flows of cars through the new and used markets and some of the feedbacks that might couple them. That night Pudar converted the conceptual map into a working simulation model. The model included sectors for new and used cars and tracked vehicles from production through initial sale or lease, trade-in, the used car market, and, ultimately, scrapping. It included a simple consumer choice model for the new/used purchase decision. Pudar used data at hand and judgment to estimate parameters. Exhibit 6 shows a simplified diagram of the initial model. The structure in black captures the prevailing mental model focused on the new car market. The left side tracks the stocks and flows of vehicles.
16
DELAY
Production
R
Reinforcing Feedback
B
Balancing Feedback
B1 Production Control
New Car Inventory
Inventory Coverage
+
Pricing
-
New Car Sales + Late Model Cars
Lease Term
B4
B3
Lease Term
Trade-In
-
Relative Attractiveness of New Cars -
Average Trade-In Time
-
+
Subvention
+ Late Model Used Car Sales
New Car Price & APR
+ Lease Subvention
-
Late Model Cars On Road
-
B2
-
-
B6
DELAY
Used Car Quality
Off-Lease Retention Fraction
Late Model Used Car Inventory
-
Attractiveness of Late Model Cars
Average Quality of Used Cars
+
+
-
R1
Aging Rate
B5
Purchase Option
Used Car Market
Older Cars Used Car Price
Scrap Rate
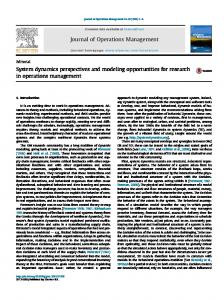
Exhibit 6 Causal diagram showing interactions between new and used car markets Rectangles represent stocks of cars; pipes and valves represent flows; e.g., t
New Car Inventory(t) =
[Production(s) – New Car Sales(s)]ds + New Car Inventory(t0 ) t0
+
–
Arrows and polarities indicate causal influences: x → y ⇔ ∂y/∂x > 0; x → y ⇔ ∂y/∂x < 0 so, e.g., higher (lower) inventory coverage leads to more (less) lease subvention, and lower (higher) new car prices. Structure shown in gray was not captured in the prevailing industry mental model in which new and used car markets do not interact.
17
Starting at the top, the inventory of unsold new cars is increased by production and drained by new car sales. New car sales add to the stock of late model cars on the road. People sell or trade in their car and buy a new one with a frequency defined by the average trade-in time. Exhibit 6 also shows the main feedbacks in the market. Manufacturers and dealers pay close attention to the stock of new cars. If coverage rises above normal, carmakers cut production, forming the balancing (negative) Production Control feedback, B1. However, cutting production is expensive and takes time. The second main response to excess inventory is lower prices and financing rates, making new cars more affordable and boosting new car sales until inventories fall back to normal (the negative Pricing loop, B2). Challenging the conventional wisdom, the team expanded the stock and flow structure to include late model used cars. Instead of disappearing, trade-ins add to inventories of late model used cars on dealer lots. When these cars are purchased, they reenter the stock of late model cars on the road. The sum of the cars on the road and cars on dealer lots is the total stock of late model vehicles (shown by the large rectangle); these cars gradually age into the population of older cars and are eventually scrapped. The stock and flow perspective motivated the team to ask where the superstores got the large inventories of late-model cars they required. The answer was leasing. Leasing increased from 4.1% of all new car sales in 1990 to more than 22% in 1997. From the perspective of the prevailing mental model, leasing was a boon. First, quality improvements meant the market value of two and three year old cars was higher than in the past. Higher lease end (residual) values enable lower lease payments, boosting sales. Whenever inventories rose, carmakers could lower monthly lease payments through subvention (setting residual values higher than used car guidebook values). More people then trade their current car for a new leased vehicle, clearing out the excess inventory (forming the negative Lease Incentive loop B3). Second, typical lease terms are 2 to 4 years, boosting sales by cutting the trade-in cycle time (the negative Lease Term loop B4). If all new car buyers switched to leases with an average term of 3 years, the trade-in cycle time would be cut in half and new car sales would double all else equal . The modeling team quickly challenged the assumption that all else was equal. While 6-year old 18
cars are poor substitutes for new cars, 1- to 3-year old cars are attractive to many people. As the growing volume of leases expired the used car market could be flooded with high-quality nearly new cars. Used car prices might plummet. People who might have traded their current cars for new ones opt instead for off-lease vehicles, raising the average trade-in time and returning more late model cars to the stock of cars on the road (the balancing Used Car Market loop, B5). Leasing also shortens the average trade-in cycle time, raising the average quality of used cars for sale. More people then opt for off-lease instead of new vehicles, forming the negative Used Car Quality loop, B6. More interesting, if used car prices drop below residuals, the retention fraction (the fraction of customers who exercise their option to buy when their lease expires) falls. As more customers return their cars to the lessor, stocks of late model cars balloon, forcing used car prices down still more, in a vicious cycle (the positive Purchase Option loop, R1.8 The feedbacks shown in gray operate with a long delay (roughly equal to the average lease term) and were poorly understood in the industry. Unaware of the structure shown in gray, the experience of the early 1990s taught carmakers that leasing works and they diverted still more marketing dollars to subvention and shorter terms. Expanding the model boundary to include the used market, however, suggested that leasing would eventually create a glut of high-quality nearly new cars. Late model used car prices would plummet, and new car sales would suffer as consumers opted for cheap off-lease vehicles. The carmakers
credit companies (e.g., General Motors Acceptance Corporation [GMAC] and
Ford Credit Corporation) would face losses as market values fell short of the residual value they had booked and as fewer consumers exercised their option to buy. The initial modeling process dramatically redefined the problem. Superstores were only a symptom. Carmakers 8
own leasing policies were creating a glut of high quality used cars at
The Purchase Option loop is partially offset because customers turning their cars back to lessors purchase another vehicle. If lease customers used their purchase option to make a pure arbitrage play when used car prices fell below residual values by turning their cars in and immediately buying identical ones at the lower market price, then the net effect of changes in the retention fraction on prices would be zero (though the financing company would still take a loss). However, some customers turning their cars back to lessors will buy a different type of vehicle, possibly from a competitor. On net a lower retention fraction for a given make and model will tend to push prices for that car down still more, triggering even lower retention. These effects were captured in the full model but for clarity are not shown in Exhibit 6.
19
attractive prices. In the old days, people kept their cars long enough that trade-ins effectively disappeared from concern. But in a world of short-term leases, new cars are
gone today, here
tomorrow . Superstores were simply the market response to an opportunity carmakers themselves had created. These effects may seem obvious (especially now that you have read the description of the model above), and auto industry executives did know that some off-lease cars would reenter the market. However, most discounted the possibility of any problems. In 1994, USA Today quoted a General Motors leasing executive who said, supply. Lease-end cars have
The demand for cars coming off leases is triple the
not created a bottleneck in the industry
(2 November). A
Detroit-area Cadillac dealer scoffed at any linkage between the new and used markets: never get a luxury buyer to take a car with 30,000 miles on it
You ll
(The Wall Street Journal, 3 June
1994). In the same article, the Journal went on to note that Ford s executive director of sales operations argues that the industry has had a chronic shortage of good two-year-old cars to sell . This [short-term leasing] brings the cars back at just the right time, when demand is highest, he says. Moreover, the used-car market is at least twice as big as the new-car market and can easily absorb the projected volumes. The underlying strength in used-car demand will safely absorb the volume of used vehicles coming off lease, without cannibalizing new-car sales, predicts [an] auto securities analyst at Saloman Bros. There appeared to be ample evidence for these views. Used car sales grew from 37.5 million in 1990 to nearly 42 million in 1995; 1995 new car sales were about 15 million. Used car prices rose more than 6%/year between 1990 and 1995, much faster than inflation. With rising used car prices, more and more people opted to keep their vehicle when their lease expired. Executives throughout the auto industry argued that strong demand and rising used car values justified even higher residual values, allowing lower lease payments and boosting new car sales still more. The following day Pudar and his team presented their initial model to Zarrella. Realizing that superstores were an endogenous consequence of the carmakers
own actions dramatically
redefined the focus of the work, from superstores to leasing policy. Initial model analysis suggested GM should de-emphasize leasing, exactly counter to industry trends. Yet more work
20
was needed before credible policy recommendations could be made. Even if leasing was a devil s bargain, unilaterally backing away from leasing might risk too much market share. Zarrella asked the team to continue the modeling to address these questions. They had 20 days. The modeling team interviewed people throughout the organization to understand the issues and gather data. Through these meetings they opened up the model to critical review and presented interim results for discussion. One area for improvement was the segmentation of the market. Some argued for explicit treatment of every major manufacturer and market segment. Brand loyalty is important: People who bought GM cars last time are more likely to buy another GM car than non-GM owners. They also argued that markets for luxury cars, family sedans and SUVs were all different. The team countered that the huge data requirements for such a detailed model would delay development of a useful model. They preferred an iterative approach, with limited disaggregation; if sensitivity analysis showed that further segmentation was needed they could then revise the model to include more detail. They agreed to separate the market into GM and non-GM vehicles but to represent only a single aggregate vehicle type. Another important area of discussion was disaggregation of the customer base. Changes in the relative attractiveness of new and used cars shift the proportion of drivers in the market opting for a new car. The choice between new and used vehicles also depends on their past behavior. The chance a customer will lease, buy new, or buy used depends on whether he or she leased, bought new, or bought used last time. Exhibit 7 shows a simplified representation of the resulting transition matrix. The transition probabilities varied endogenously as the prices and quality of new and used cars changed. Even with limited disaggregation the data challenges were formidable. Given the 20-day deadline, the team had to use data already available in various parts of the organization. The market research data for new cars were excellent. Data on leasing, a relatively new phenomenon, were sketchy. And consistent with prevailing mental models that downplayed the used car market, there was almost no research describing how people traded off new and late model used vehicles. They drew on the best data sources available and used judgment and qualitative data where numerical data were lacking.
21
Pu rc ha C se ar L ea 1Yr se -O ld U se 2d Yr C -O ar ld U 3se Yr d -O C ar ld U se 4Yr d C -O ar ld U se d C ar ew
N
N ew
FROM:
C ar
TO:
New Car Purchase New Car Lease
p(i,j)
1-Yr-Old Used Car 2-Yr-Old Used Car 3-Yr-Old Used Car 4-Yr-Old Used Car
Exhibit 7 Transition matrix for consumer choice model The matrix shows the probability p(i, j) that customers in each category shown in row i will, on trade-in, move to the category in column j. These transition probabilities are endogenous functions of relative prices and vehicle quality. The full matrix disaggregates GM and non-GM vehicles. Source: Adapted from GM diagram. Used with permission. After 20 days the team met again with Zarrella and other senior executives. They configured the model as an interactive management flight simulator. A
dashboard
contained dials and gauges
reporting information such as inventories, sales volumes, prices, market share, and profitability. Players set production targets, incentives, lease terms, and so on. By clicking a button on the screen players could explore the structure and assumptions of the model. By playing the game instead of listening to a presentation, Zarrella and his team explored the dynamics of leasing for themselves. They could try various strategies, from aggressive subvention to pulling out of the lease market altogether, and see the impact on sales and profits in the short and long run. They discovered that the full impact of leasing decisions took up to five years to play out. The more leasing lifted sales in the short run, the greater the problems when those cars returned to the market. To involve a wider group of stakeholders, the modeling team next began to work with the Leasing Strategy Implementation Team, a task force including people from marketing, finance,
22
and other functions. Their mandate was to use leasing to boost market share and profitability. They didn t think a model was necessary, didn t trust the model, and opposed the initial recommendations. Viewed through the lens of their mental model, this position was entirely rational. The success of leasing and strength of the used car market provided ample evidence that aggressive leasing was essential to GM s strategy. The two teams met about once a month so the leasing team could critique the model as the modelers refined and tested it. Working with your critics is often the best way to improve your understanding of complex issues. By engaging the leasing strategy team, opening the model to their review, and responding to their criticisms, the formal model improved. More important, that process led to change in the mental models of both the modeling and leasing strategy teams. As their confidence in the model grew, they turned to policy analysis. Policy levers include lease terms and subvention levels, along with purchase incentives, fleet sales, and various decision rules for production. The impact of each policy combination depended on the policies of the competitors and a host of market uncertainties, from the economy, demographics, gasoline prices, and interest rates to changes in carmaker costs, car quality, and brand loyalty. The team used the model to seek robust policies across a wide range of assumptions. Exhibit 8 shows a sample illustrating the net present value of GM profits as a function of leasing policy across competitor strategies and economic conditions. The policy analysis showed that there was no going back: Profits without leasing were consistently negative, reflecting the attractiveness of leasing to consumers and the prisoner s dilemma that unilaterally stopping leasing dramatically reduced GM sales. The analysis also showed, contrary to then-current policy, that GM profits were consistently higher with longer lease terms. Longer terms were superior over a wide range of competitor strategies and uncertainties. Longer terms have two main beneficial effects. First, short terms generate a glut of high-quality nearly new cars that compete strongly with new cars. In terms of Exhibit 6, the Used Car Market, Used Car Quality, and Purchase Option loops overwhelm the Lease Term and Lease Incentive loops. Longer terms mean the cars coming off lease are less attractive substitutes for new cars, while still speeding the trade-in cycle somewhat.
23
Competitor Lease Term
3 Yr
4 Yr
3 Yr
4 Yr
None
2 Yr
3 Yr
4 Yr
None
2 Yr
3 Yr
4 Yr
NPV
4 Yr
2 Yr
None 2 Yr
3 Yr
4 Yr
NPV
3 Yr
None
None
2 Yr
3 Yr
4 Yr
NPV
4 Yr
NPV
NPV NPV
None 2 Yr
3 Yr
4 year
NPV
NPV
Stable
None 2 Yr
3 year
NPV
Boom
None 2 Yr
Recession
Economic Scenario
2 year
None
2 Yr
3 Yr
4 Yr
Exhibit 8 Policy analysis The simulated net present value (NPV) of GM profits as a function of GM s leasing policy (no leasing or 2- to 4-year terms) for different combinations of economic scenario and competitor strategy; vertical scale disguised. Source: Adapted from GM diagram. Used with permission.
The second benefit of longer terms is a more subtle, disequilibrium effect. Short-term leases increase the vulnerability of earnings to industry downturns as vehicles leased during booms reenter the market. The glut of nearly-new cars would cut profits three ways: first, used prices fall, forcing GM to take a significant charge against earnings for residual reconciliation; second, new car sales suffer as customers opt for late model off-lease vehicles; third, lower new car sales and low used car prices force new car prices down. The team made several recommendations. First, GM should shift to longer lease terms. Second, sales incentives should be changed to include the profit or loss GMAC realized on leases. Third, all new pricing and marketing proposals should formally include analysis of their impact on the used car market and its feedback to the new car market. Finally, market research should be commissioned to assess new/used/lease consumer choice behavior on an ongoing basis. Many brand managers strongly opposed these recommendations. They argued that consumers had been conditioned to prefer short-term leases. Ford, in particular, was aggressively pushing 2-year leases with significant subvention; unless GM responded in kind, they argued, market 24
share would suffer. The sales organization put strong pressure on senior management to increase residual levels, arguing that strong used car demand and rising used car meant subvention could safely be increased still more. Finally, they argued for a decrease in the fraction of off-lease vehicles GM predicted it would have to take back at lease end. Accounting rules require carmakers to set aside reserves to cover the expected cost of subvention, reducing current period earnings. Required reserves depend on the fraction of cars they expect to be returned. Many brand managers believed that the strong used car market meant more people would opt to buy at lease end, so reserves could safely be cut, allowing them to show higher profits while increasing market share. They supported their case with spreadsheets in which recent trends toward higher used car prices and higher lease-end vehicle retention were assumed to continue, that is, in which all feedbacks between the new and used markets were cut. Dueling experts with competing models rarely change deeply entrenched beliefs. Those who oppose your model will dismiss it by saying it s a black box and it ignores critical factors while intoning
garbage in, garbage out.
Instead of relying on diagrams such as Exhibit 6 to explain
counterintuitive model results, Pudar developed Exhibit 9, showing the stock of late model vehicles as a bathtub. The stock of new and new-car substitutes is increased by production and the flow of late model used cars coming off lease. Sales drain the tub. During recessions, auto sales drop below production. The water level rises. However, the flow of new car substitutes into the market from expiring leases cannot be turned off. When a recession hits, leases sold during the preceding boom continue to expire, boosting the level in the tub. The larger the share of new cars sold through leasing, the larger the unstoppable flow of returning vehicles. Prices are forced down even farther, and production cuts must be even deeper, significantly eroding profits. The team used the bathtub diagram in presentations to senior managers throughout the firm. Of course the formal model, careful calibration, and sensitivity analysis were necessary. But they were not sufficient to change people s minds. The bathtub diagram distilled the essence of an important dynamic insight that is difficult for people to grasp (see Exhibit 5), but, once presented, was obvious to all, speeding the difficult process of changing mental models.
25
Why do short-term leases make us more vulnerable during an economic downturn? Production
New Car Substitutes
Stock
Strength of Economy Sales Price • When industry demand falls, the flow of returning lease cars cannot be stopped: - Prices of used cars will be driven down; - New car transaction prices will be forced down; - Some returning lessees will opt for cheap used cars. • Price does not alter the supply of new car substitutes
Exhibit 9 Bathtub diagram to illustrate the impact of leasing Source: GM. Used with permission.
Armed with their new understanding, senior management adopted all the major policy recommendations above. They decided to focus on 36- to 48-month terms and eliminated 2-year leases. They chose not to increase residual values and mandated full accrual of residual risk in calculating reserves. These decisions cut subvention and raised lease payments. In 1997 a flood of off-lease vehicles inundated the market. Used car prices fell sharply (Exhibit 10). The drop was more severe in the segments in which leasing had grown most rapidly. As prices fell, fewer customers opted to keep their cars. The Consumer Banking Association reported that the fraction of leased vehicles returned to lessors on expiry jumped from 29% in 1997 to 39% in 1998. About three-quarters of all vehicles returned to lessors incurred losses; the average loss in 1998 was $1878 per vehicle, 220% more than the average for 1993. GM s early action helped it avoid these losses, while other carmakers suffered huge reconciliation charges. Losses on off-lease vehicles caused profits at Ford Credit Corporation to fall $410 million from 1996 to 1997, a 28% drop. At GMAC, net income from automotive
26
financing operations fell less than 4%, and overall GMAC profits rose more than 6%. In 1998 Ford and other carmakers, burned by their large losses in leasing, belatedly followed GM s lead and moved away from short-term leasing. GM s early action was worth about $500 million in additional profit in 1997 alone.
160
1982-84 = 100
150 140 130 120 110 1988
1990
1992
1994
1996
1998
2000
Exhibit 10 Used car prices, 1989-1999 Index shows the used-car and truck component of the US Consumer Price Index, seasonally adjusted. Source: US Bureau of Labor Statistics, series CUSR000SETA02. The leasing model has been updated several times. Pudar, now director of Corporate Strategy and Knowledge Development, continues to apply system dynamics, in combination with other methods, to a wide range of issues, including negotiating joint ventures with foreign governments, designing business plans for new enterprises like OnStar, and top level strategy for GM as a whole. Conclusion The list of successful interventions using system dynamics is growing. Of course there are also failures, as the community of modelers continues to learn. Recent successful projects in the business world include strategy design for a successful wireless communications startup, supply chain reengineering in high technology firms, marketing strategy for a major credit card organization, long-range market forecasts and strategy development for a commercial aircraft manufacturer, clinical trial and marketing strategies for new pharmaceuticals, and effective management of large-scale projects in software, civil construction, shipbuilding, aerospace, defense, and commercial product development, among many others.
27
These successes show that what often prevents us from overcoming policy resistance and achieving high performance is not a lack of technical knowledge or a genuine commitment to change. Modeling takes place in the context of real world problem solving, with all its messiness, ambiguity, time pressure, politics, and interpersonal conflict. The purpose is to solve a problem, not only to gain insight (though insight is required to design effective policies). Modeling is iterative, a continual process of testing and revision, of both formal and mental models. Experiments conducted in the virtual world inform the design and execution of experiments in the real world; experience in the real world then leads to changes and improvements in the virtual world and in participants’ mental models. As the leasing example illustrates, system dynamics, and any modeling approach, is most effective when: • it is used to solve problems, not model a system, • models have broad boundaries to capture the feedbacks, time delays, and interactions unaccounted for in people s mental models, • modelers draw on the widest array of data, both quantitative and qualitative, • other tools and methods are integrated into the effort, • the clients are actively engaged as partners in the modeling process from the start, • the model is an open box used to catalyze learning rather than a black box used to advocate policy positions, • models are open to review by all relevant stakeholders, including critics, and modelers seek out opportunities to confront the model with data and test assumptions. Such a modeling process can build both the understanding of complexity needed to find effective policies and the confidence to use that understanding to take action.
References Axelrod, R. (1976) The Structure of Decision: The Cognitive Maps of Political Elites. Princeton: Princeton University Press. Booth Sweeney, L. and J. Sterman (2000). Bathtub Dynamics: Initial Results of a Systems Thinking Inventory, System Dynamics Review 16(4): 249-294. Diehl, E. and J. D. Sterman (1995). Effects of Feedback Complexity on Dynamic Decision Making, Organizational Behavior and Human Decision Processes 62(2): 198-215. D rner, D. (1996)The Logic of Failure. New York: Metropolitan Books/Henry Holt.
28
Forrester, J. W. (1961) Industrial Dynamics. Cambridge: MIT Press; Currently available from Pegasus Communications: Waltham, MA. Meadows, D. H. and J. Robinson (1985) The Electronic Oracle: Computer Models and Social Decisions. Chichester, England: John Wiley and Sons. Morecroft, J. and J. Sterman, (eds.) (1994) Modeling for Learning Organizations. Portland, OR: Productivity Press. Paich, M. and J. Sterman (1993). Boom, Bust, and Failures to Learn in Experimental Markets, Management Science 39(12): 1439-1458. Plous, S. (1993) The Psychology of Judgment and Decision Making. New York: McGraw Hill. Repenning, N. (2001). Understanding Fire Fighting in New Product Development. Journal of Product Innovation Management, 18, 5: 285-300 Richardson, G. (1991) Feedback Thought in Social Science and Systems Theory. Philadelphia: University of Pennsylvania Press. Rosenthal, R., and Jacobson, L. (1992) Pygmalion in the classroom. Expanded edition. New York: Irvington. Ross, L. (1977) The intuitive psychologist and his shortcomings: Distortions in the attribution process, in L. Berkowitz (ed.), Advances in Experimental Social Psychology, Vol. 10. New York: Academic Press. Schneiderman, A. (1988) Setting quality goals, Quality Progress (April), 55-57. Senge, P. (1990) The Fifth Discipline: The Art and Practice of the Learning Organization. New York: Doubleday. Simon, H. (1969/1996) The Sciences of the Artificial. (3rd ed.). Cambridge: The MIT Press. Sterman, J. (2000) Business Dynamics: Systems Thinking and Modeling for a Complex World. Boston: Irwin/McGraw-Hill. Sterman, J. (1989a) Modeling managerial behavior: Misperceptions of feedback in a dynamic decision making experiment, Management Science 35(3), 321-339. Sterman, J. (1989b) Misperceptions of feedback in dynamic decision making. Organizational Behavior and Human Decision Processes 43(3), 301-335. Sterman, J. (1989c) Deterministic chaos in an experimental economic system, Journal of Economic Behavior and Organization 12, 1-28. Sterman, J. and L. Booth Sweeney (2002). Cloudy Skies: Assessing Public Understanding of Global Warming, System Dynamics Review 18(2). Sterman, J. , N. Repenning, and F. Kofman (1997) Unanticipated side effects of successful quality programs: Exploring a paradox of organizational improvement, Management Science 43(4), 501-521. Thomas, L. (1974) The Lives of a Cell: Notes of a Biology Watcher. New York: Viking Press.
29


![[Download]PDF Business Dynamics: Systems Thinking and Modeling ...](https://m.moam.info/img/260x300/downloadpdf-business-dynamics-systems-thinking-and_6477ef38097c4737708c4016.jpg)