1648
IEEE PHOTONICS TECHNOLOGY LETTERS, VOL. 15, NO. 11, NOVEMBER 2003
System Performance Variations Due to Partially Polarized Noise in a Receiver Yu Sun, Student Member, IEEE, I. T. Lima, Jr., A. O. Lima, H. Jiao, J. Zweck, L. Yan, Member, IEEE, G. M. Carter, Senior Member, IEEE, and C. R. Menyuk, Fellow, IEEE
Abstract—In this letter, we systematically investigate effects of partially polarized noise in a receiver. We introduce a relationship between the factor and the signal-to-noise ratio (SNR) that accounts for effects of partially polarized noise. We derive an expression for the distribution of the factor for a fixed SNR, and we validate our results by comparison to back-to-back experiments. We show that the system performance varies depending on the angle between the Stokes vectors of the signal and the noise as well as the degree-of-polarization of the noise. Highly polarized noise will cause a larger variation of the system performance. Index Terms—Optical fiber communication, optical fiber polarization, optical noise, optical receivers, factor.
I. INTRODUCTION
P
OLARIZATION effects, such as polarization-dependent loss (PDL), polarization-dependent gain, and polarization-mode dispersion, can significantly impair the system performance [1]. Since polarization effects are random in nature due to the random mode-coupling in birefringent optical fibers, they make it difficult to relate the system performance, usually evaluated by the factor, to the more easily measured signal-to-noise ratio (SNR). Determining this relationship is critical in order to investigate the system performance and to estimate the outage probability due to polarization effects in an optical communications system. The widely used formula due to Marcuse [2] considers only two extreme cases in which the noise is unpolarized or is completely copolarized with the signal. However, partially polarized noise occurs in many optical systems with significant PDL [3]. How the partially polarized noise affects the system performance has been unclear. We systematically investigate, for the first time, effects of partially polarized noise in a receiver, and we derive a formula that relates the factor to the SNR. In contrast to [2], which is based on an integrate-and-dump receiver, our formula takes into account the pulse shape prior to the receiver as well as the shapes of the optical and electrical filters. Our results show that, even with a fixed SNR, the performance of the system can vary widely, depending on the random angle between the Stokes vecManuscript received February 24, 2003; revised July 8, 2003. This work was supported by the National Science Foundation and by the DOE. Y. Sun, I. T. Lima, Jr., A. O. Lima, H. Jiao, J. Zweck, L. Yan, and C. R. Menyuk are with the Department of Computer Science and Electrical Engineering, University of Maryland Baltimore County, Baltimore, MD 21227 USA (e-mail:
[email protected]). G. M. Carter is with the Department of Computer Science and Electrical Engineering, University of Maryland Baltimore County, Baltimore, MD 21227 USA. He is also with the Laboratory for Physical Sciences, University of Maryland, College Park, MD 20740 USA. Digital Object Identifier 10.1109/LPT.2003.818669
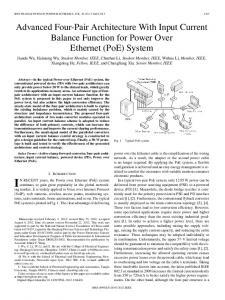
Fig. 1. Schematic diagram of the experimental setup.
tors of the signal and the polarized portion of the noise as well as on the degree-of-polarization (DOP) of the noise. In this letter, we also derive an analytical formula for the distribution of the factor when the SNR and DOP of the noise are fixed. We validate our formula by comparing our analytical and simulation results to results from back-to-back experiments. II. EXPERIMENTAL SETUP In Fig. 1, we show a schematic diagram of the experimental setup. The transmitter generated a 10-Gb/s signal using rePRBS pattern. The turn-to-zero pulses modulated by a receiver includes a 187.5-GHz optical filter, a p-i-n detector, and an electrical amplifier. The electrical bandwidth of the receiver is 10 GHz. The noise source consists of the combined outputs of two erbium-doped fiber amplifiers (EDFAs) without any input power. One EDFA generates unpolarized noise and the other, followed by a polarizer and a polarization controller (PC), provides polarized noise. The PC is used to vary the polarization state of the polarized noise. We vary the DOP of the noise by adjusting the relative power of the two noise sources. The SNR of the electrical current is held fixed at dB by using a variable attenuator to adjust the SNR total noise power. The corresponding optical SNR is monitored using an optical spectrum analyzer. We use the method described in [4] to obtain the factor from margin measurements of the bit-error rate. In order to focus on the behavior of the optical noise, we carefully subtract the electrical noise background, obtained from the back-to-back measurement with both optical noise sources off, from all the experimental data. III. THEORY As is customary, we evaluate the system performance using , the factor, which is defined by and are the mean values of the electrical current where and in the marks and spaces at the sampling time and are the corresponding standard deviations. In practice, the
1041-1135/03$17.00 © 2003 IEEE
SUN et al.: SYSTEM PERFORMANCE VARIATIONS DUE TO PARTIALLY POLARIZED NOISE IN A RECEIVER
factor is often computed from the SNR of the electrical cur, as in [2]. For rent, which is defined as SNR a system that has an infinite extinction ratio, the variances and are related to the noise–noise beating and , as and the signal–noise beating, . In [2], where it is assumed that the noise is unpolarized or completely copolarized with the signal, one finds that a fixed SNR has a single corresponding factor. However, in a system, in which the noise is partially polarized, the relationship between the SNR and the factor is not unique. and , and hence, the SNR, Although the mean currents and are polarization-independent, the beating terms depend on the state of polarization (SOP) of the noise and . and, hence, so do The Stokes parameters of the total noise can be decomposed as the sum of a polarized part of the noise
1649
The parameters and , which are independent of the SOP of the signal and of the noise, depend on the pulse shape prior to the receiver and the shapes of the optical and electrical filters. These parameters are calculated using a theoretical approach similar to that described by Winzer et al. [5]; more details are reported in [6]. In the special case of an integrate-and-dump receiver, where the noise is either unpolarized or completely copolarized with the signal, (2) agrees with the formula for the factor given in and . [2]. For our receiver, From (1) and (2), we observe that, for a fixed SNR, the factor is a function of DOP and of . If the SOP of the signal is fixed and the SOP of the noise uniformly covers the Poincaré is uniformly distributed between 1 and 1 [7]. sphere, Consequently, in this situation, we can derive the probability density function (pdf) of the factor, which is given by
(3)
and an unpolarized part of the noise
One notes that the direction of the noise in the Stokes space only depends on the polarized part of the noise. We use unit vectors and to indicate the direction of the signal and the noise in Stokes space. The DOP of the noise DOP is defined as the power ratio of the polarized noise to the total noise. The varidepends on the DOP ance of noise–noise beating of the noise. If the noise becomes polarized, the noise–noise beating increases. The variance of signal–noise beating depends both on the DOP of the noise and on the angle between the Stokes vectors of the signal and the polarized noise. When the noise is unpolarized, half of the noise beats with the signal. When the noise is completely copolarized with the signal, all the noise beats with the signal and the signal–noise beating is the strongest. On the other hand, if the noise is completely polarized and is antiparallel to the signal in Stokes space, then no signal–noise beating occurs. In order to take into account the effect of the partially polarized noise in the receiver, we now and , which are introduce two parameters given by and (1) , whose value is in the range , takes into account the repolarization of the , whose value is in the range noise. The parameter , gives the proportion of the noise that beats with the signal. In the special cases discussed in [2], with unpoand larized noise, one obtains . When the noise is copolarized with the signal, one obtains and . Consequently, the formula for the factor is given by
The parameter
(2)
and are given by substituting where and , respectively, in (1) and (2). In general, the factor also depends on SNR and DOP [8]. Therefore, for a real transmission system, the pdf of the factor depends not simply , but on the joint probability distribution of on the pdf of . However, a complete analysis of the the SNR, DOP and general case is beyond the scope of this letter. IV. RESULTS AND VALIDATION We studied the factor distributions when the noise was partially polarized as well as the dependence of the factor on the DOP of the noise and on the angle in Stokes space between the signal and the polarized part of the noise. For all our results, the factor is given on a linear scale. In addition, we compared experimental results with numerical simulations to validate the analytical formulae for the factor and the distribution given in (2) and (3). We showed that partially polarized noise causes performance variation even when the SNR is fixed. In the first experiment, we measured the factor as a function . By changing the setting of the PC, we increased of from 1 to 1, thereby increasing the signal–noise beating and when decreasing . In Fig. 2, we plot the factor versus the noise is highly polarized and when it is partially polarized. The agreement between theory and experiment is excellent. In both cases, the value is largest when the signal is antiparallel on the Poincaré sphere to the polarized part of the noise and the signal–noise beating is weakest. Similarly, the value is smallest when the signal is copolarized with the polarized part of the noise and the signal–noise beating is strongest. Furthermore, is varied from 1 to 1, the variation in is smaller as when the noise is less polarized. In the second experiment, we measured the distribution of the factor where the samples were collected using 200 random settings of the PC, chosen so that the polarization state of the polarized part of the noise uniformly covered the Poincaré sphere. We measured the distribution when the DOP of the noise was
1650
IEEE PHOTONICS TECHNOLOGY LETTERS, VOL. 15, NO. 11, NOVEMBER 2003
Q
^^
Fig. 2. factor plotted as a function of s 1 p. The experimental and analytical results when the DOP of the noise was set to 0.95 are shown with filled circles and a solid curve, respectively. The corresponding results when the DOP of the noise is 0.5 are shown with diamonds and a dashed curve.
1
Fig. 4. Variation of the system performance Q as a function of the DOP of the noise. The dots represent the measured Q and the solid line represents the corresponding analytical result from (4) and (5).
1
ized noise will cause a larger system performance variation than unpolarized noise. V. CONCLUSION
Q
= 05
Fig. 3. factor distribution when DOP : . We show the histogram of the measured Q factor distribution with bars, the corresponding analytical result obtained using (6) with a solid curve, and the results that we obtained using a Monte Carlo simulation with 10 000 samples as a dotted curve.
DOP and , when SNR dB. In Fig. 3, we show the histogram of the measured factor dis, the corresponding retribution with bars when DOP sult obtained using (3) with a solid curve, and we also show the results that we obtained using a Monte Carlo simulation with 10 000 samples as a dotted curve. In the simulation, the SNR is fixed and we chose the polarization states of the signal and of the polarized noise prior to the PC to be (1, 0, 0) in Stokes space, and we randomly rotated the polarized noise so that the polarization state of the polarized noise uniformly covered the Poincaré sphere. The theoretical and simulation results both agree very well with the experimental result. The sharp cutoffs in the distribution at and correspond to the cases that the noise is, respectively, parallel and antiparallel to the signal in Stokes space. Since the factor distribution is not symmetric and has sharp distribution as cutoffs, we define the width of the to represent the variation of the system perforas a function of the DOP of the mance. In Fig. 4, we show noise, obtained both from measurements and analytically using increases drastically as the (1) and (2). The system variation DOP of the noise increases. The result shows that highly polar-
In this letter, we systematically investigated effects of partially polarized noise in a receiver. We derived an accurate relationship between the SNR and factor, and we showed that this relationship is not unique. Therefore, the SNR alone does not give a complete picture of the system performance. The system performance variation caused by partially polarized noise depends on the angle between the Stokes vectors of the signal and polarized part of the noise, as well as the DOP of the noise. Highly polarized noise will cause a larger variation in the system performance. We presented an expression for the distribution of the factor and validated it by comparison to back-to-back experiments and Monte Carlo simulations. Our work suggests that in order to reduce the variation of the system performance, one should keep the noise unpolarized. One way to do so is to reduce the PDL in the system. REFERENCES [1] E. Lichtman, “Limitations imposed by polarization-dependent gain and loss on all-optical ultralong communication systems,” J. Lightwave Technol., vol. 1, pp. 906–913, May 1995. [2] D. Marcuse, “Derivation of analytical expressions for the bit-error probability in lightwave systems with optical amplifiers,” J. Lightwave Technol., vol. 8, pp. 1816–1822, Dec. 1990. [3] C. R. Menyuk, D. Wang, and A. N. Pilipetskii, “Repolarization of polarization-scrambled optical signals due to polarization dependent loss,” IEEE Photon. Technol. Lett., vol. 9, pp. 1247–1249, Sept. 1997. [4] N. S. Bergano, F. W. Kerfoot, and C. R. Davidsion, “Margin measurements in optical amplifier system,” IEEE Photon. Technol. Lett., vol. 5, pp. 304–306, Mar. 1993. [5] P. J. Winzer, M. Pfennigbauer, M. M. Strasser, and W. R. Leeb, “Optimum filter bandwidths for optically preamplified NRZ receivers,” J. Lightwave Technol., vol. 9, pp. 1263–1273, Sept. 2001. [6] I. T. Lima, Jr., A. O. Lima, J. Zweck, and C. R. Menyuk, “Performance characterization of chirped return-to-zero modulation format using an accurate receiver model,” IEEE Photon. Technol. Lett., vol. 15, pp. 608–610, Apr. 2003. [7] C. D. Poole and D. L. Favin, “Polarization-mode dispersion measurements based on transmission spectra through a polarizer,” J. Lightwave Technol., vol. 12, pp. 917–929, June 1994. [8] Y. Sun, A. O. Lima, I. T. Lima, Jr., J. Zweck, L. Yan, C. R. Menyuk, and G. M. Carter, “Statistics of the system performance in a scrambled recirculating loop with PDL and PDG,” IEEE Photon. Technol. Lett., vol. 15, pp. 1067–1069, Aug. 2003.