1970
JOURNAL OF HYDROMETEOROLOGY
VOLUME 13
Systematic Patterns of the Inconsistency between Snow Water Equivalent and Accumulated Precipitation as Reported by the Snowpack Telemetry Network JONATHAN D. D. MEYER Department of Watershed Sciences, Utah State University, Logan, Utah
JIMING JIN Department of Watershed Sciences, and Department of Plants, Soils, and Climate, Utah State University, Logan, Utah
SHIH-YU WANG Department of Plants, Soils, and Climate, Utah State University, Logan, Utah (Manuscript received 11 May 2012, in final form 6 August 2012) ABSTRACT The authors investigated the accuracy of snow water equivalent (SWE) observations compiled by 748 Snowpack Telemetry stations and attributed the systematic bias introduced to SWE measurements to drifting snow. Often observed, SWE outpaces accumulated precipitation (AP), which can be statistically and physically explained through 1) precipitation undercatchment and/or 2) drifting snow. Forty-four percent of the 748 stations reported at least one year where the maximum SWE was greater than AP, while 16% of the stations showed this inconsistency for at least 20% of the observed years. Regions with a higher likelihood of inconsistency contained drier snow and are exposed to higher winds speeds, both of which are positively correlated to drifting snow potential as well as gauge undercatch. Differentiating between gauge undercatch and potential drifting scenarios, days when SWE increased but AP remained zero were used. These drift days occurred on an average of 13.3 days per year for all stations, with 31% greater wind speeds at 10 m for such days (using reanalysis winds). Findings suggest marked consistency between SWE and AP throughout the Cascade Mountains and lower elevations of the interior west while indicating notable inconsistency between these two variables throughout the higher elevations of the Rocky Mountains, Utah mountain ranges, and the Sierra Nevada.
1. Introduction This study investigates sources responsible for a frequently observed inconsistency between measurements of snow water equivalent (SWE) and accumulated precipitation (AP) reported by the Snowpack Telemetry (SNOTEL; Schaefer and Paetzold 2001) network in the western United States. The inconsistency occurs in the sense that SWE exceeds AP (which is physically unlikely) at some point in time or throughout the snow season. Possible biases of the SNOTEL observations have been attributed to the two distinct measuring devices in observing SWE and AP (Johnson and Marks 2004): while
Corresponding author address: Jiming Jin, 4820 Old Main Hill, Utah State University, Logan, UT 84322. E-mail:
[email protected] DOI: 10.1175/JHM-D-12-066.1 Ó 2012 American Meteorological Society
SWE is measured using a snow pillow sensor equipped with a pressure transducer, AP is measured with a standard 30.5-cm orifice storage-type gauge (equipped with an alter shield to reduce turbulence around the gauge orifice and maximize catch efficiency). Bias in SWE measurement occurs when temperature differences exist between surrounding ground cover and the pillow sensor, creating uneven distribution of snow between the sensor and the surrounding ground cover. However, these conditions can lead to both under- and overmeasurement depending on the snowmelt conditions and the snow density rate of change (Johnson and Marks 2004), so the bias should be random throughout the whole network. Regarding AP, it is known that the accuracy of precipitation catchment decreases with increasing wind speed (Neff 1977). The types of gauge similar to those of the SNOTEL network have a margin
DECEMBER 2012
MEYER ET AL.
of error between 10% and 50%, possibly more in mountainous regions (WMO 2008). Losses in AP due to wetting or evaporation and trace underestimates may also contribute to the bias (Groisman and Legates 1994). While numerous papers acknowledge the ability of wind drift and scour to affect SWE measurements, none have fully investigated the matter on a large scale. This study focuses on the effect of blowing snow on measurement accuracy in various environmental regimes throughout the western United States. The SNOTEL network was designed to observe surface meteorological variables for hydrologic and climatic uses. Given the now-30-yr data period, SNOTEL observations have been used extensively for the depiction of decadal trends in surface hydrological conditions (Serreze et al. 1999, 2001; Fassnacht et al. 2003; Mote et al. 2004; Hamlet et al. 2005; Carson 2007; Pederson et al. 2011) and to evaluate against climate model simulations (e.g., Jin and Miller 2011). Serreze et al. (1999) used SWE to correct for rain gauge undercatchment bias in AP, while acknowledging that SWE measurements are potentially affected by wind scour and drifting. This paper addresses areas where SWE is prone to bias from wind drift, potentially introducing errors in AP correction. Additionally, SNOTEL SWE data are commonly used for model data assimilation as well as validation of snow models (e.g., He et al. 2011) and remote sensing observations (Mote et al. 2003), as well as for water resource management. He et al. (2011) concluded that SWE errors have a small impact on snow model calibration compared to other sources of error. Despite He et al.’s (2011) findings, the variety of uses of SWE today dictate the need for a comprehensive understanding of possible biases influencing the SNOTEL data. This paper examines the full archive of SNOTEL data excluding the state of Alaska, and addresses one potential cause for the frequently observed systematic inconsistency between SWE and AP.
2. Data SNOTEL stations operate on a water year (1 October– 30 September) and report at least daily values of SWE and AP (near-surface air temperature is also measured but is not examined in this study). SWE and AP values are reset to zero on 1 October of each year. SWE and AP are reported in inches with a sensor resolution of 0.1 in. (2.54 mm). In addition to the ;800 SNOTEL stations currently in operation [Natural Resources Conversation Service (NRCS); http://www.wcc.nrcs.usda. gov/nwcc/inventory), This study also utilized 6-hourly 10-m winds from the North American Regional Reanalysis (NARR) for investigation of drifting snow.
1971
NARR assimilates meteorological and land surface observations and outputs data on a 32-km horizontalresolution grid (Mesinger et al. 2006). Accurate representation of 10-m wind conditions over complex terrain on daily scales is not possible; however, comparison of ambient wind conditions of each SNOTEL site under various synoptic scenarios is still useful. To avoid undue biases in the daily measurements of SWE and precipitation due to reporting errors, data used in this study was subjected to two quality control (QC) filters. QC filters address the following issues: 1) reset and daily corrections of SWE and AP for new water years and 2) allowable number of missing data points in a usable year for either SWE or AP. Water years with missing values for at least half of the data spanning 1 October–1 April (182 days; 183 for leap years) were considered unusable. These filters ensure the most reliable daily measurements as well as remove years with large gaps in the data where the accuracy of observations is questionable. A final count of 748 stations remained after exclusion of stations throughout the state of Alaska and unfit stations removed through QC filtering. Additionally, ice-bridging conditions leading to uneven distribution of snow are assumed to have negligible effects on daily observations as they typically occur during the transition from late winter to spring, and this study focuses on the snow accumulation period before melt conditions occur.
3. Results Under ideal conditions, any measurements of SWE greater than AP suggest that more water is contained within the snowpack than has been observed as precipitation. Figure 1 illustrates (Fig. 1a) such a situation between SWE and AP, and (Fig. 1b) the daily difference between the two variables measured at Tony Grove, Utah (UT), for water year 2005 (areas of red/blue indicate where SWE is greater/less than AP). SWE remains below AP in the early water year, as expected, but then increases to exceed and outgrow AP around January. SWE then remains greater than AP until the maximum SWE (MSWE) value predates the spring melt off. By using the difference between the MSWE and the associated AP this study also utilized examine the frequency and magnitude of the inconsistency between SWE and AP throughout the SNOTEL network. Instances when the MSWE was at least 5% greater than the associated AP were used to identify ‘‘inconsistent years’’ of a particular station, ignoring years with smaller differences. Figure 1c illustrates the actual number of occurrences throughout the network, while Fig. 1d shows the percentage of occurrence (number of years divided by total
1972
JOURNAL OF HYDROMETEOROLOGY
VOLUME 13
FIG. 1. (a) 2005 measurements of SWE and AP for the Tony Grove, UT, site, (b) the 2005 difference between daily SWE and AP, (c) total number of years for each SNOTEL station where the MSWE was greater than AP, (d) percentage of each station’s period of record where the MSWE was greater than AP (number of years divided by total number of years on record), and (e) percentage difference between each SNOTEL station’s MSWE and AP values averaged over all inconsistent years [(MSWEavg 2 APavg)/APavg]. Light brown contours found in (c)–(e) represent elevations above 1500 m with dark brown representing above 2000 m. Increasing circle size represents increasing magnitude, while black dots in (c),(d) represent stations with no instances of MSWE greater than AP. Black dots in (e) represent stations where the average differences was below 5%, while red dots represent stations with less than 5 years of operation.
number of years on record). Forty-four percent of the 748 stations studied reported at least one year where the maximum SWE was greater than AP, with inconsistencies found in at least 20% of the observed years for 16% of the stations. Computed differences between the average MSWE and AP for all years when MSWE was
greater than AP are shown in Fig. 1e to illustrate regions with the largest inconsistency throughout the network. It is apparent that the inconsistency between MSWE and AP is geographically dependent. For instance, a much higher and concentrated likelihood of inconsistency occurs in the Rocky Mountains, the Utah mountain ranges,
DECEMBER 2012
MEYER ET AL.
1973
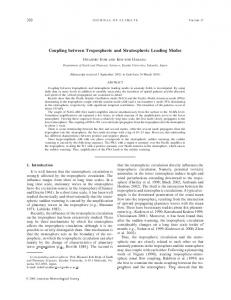
FIG. 2. (a) NARR average DJF 10-m wind vectors from January/February 1979 to December 2011/January and February 2012 overlaid on Fig. 1d and (b) a 30-yr climatology of DJF SLR from 1971–2000 adapted from Baxter et al. (2005). High- (boxes 1, 2, and 3) and low-bias SWE regions (boxes 4, 5, and 6) illustrated by the six green boxes.
and the Sierra Nevada. Conversely, stations throughout the Pacific Northwest generally show few to no occurrences of yearly MSWE greater than AP. Geographical correlation of inconsistencies between MSWE and AP (Figs. 1c–e) provides evidence for a systematic (regional) controlling factor for the frequency and magnitude of such inconsistencies. It should be noted that some stations within the areas where inconsistencies and biases are more likely to occur exhibit little or no inconsistency. These stations provide evidence for the interaction between station placement and surrounding topography or land cover. Stations located in similar environmental conditions can exhibit opposite biases depending on the interaction of surrounding surface characteristics controlling wind drift (positive bias), scour (negative bias), or neither on SWE measurement. We next examine whether or not the geographically systematic inconsistency between MSWE and AP, as shown in Fig. 1, is related to biases resulting from precipitation undercatchment or snow drifting. Since a region’s proclivity for snow drifting is a function of snow condition and wind speed, where snow condition determines the necessary wind speed threshold to initiate transport of the snow particles, we first analyze the climatological 10-m wind fields. Figure 2a shows the climatological (1979–2011) 10-m wind vectors for December, January, and February (DJF) overlaid on Fig. 1d and Fig. 2b shows the DJF climatological (1971– 2000) snow-to-liquid ratio (SLR) contours adapted from
Baxter et al. (2005). Stronger wind speeds appear over higher elevations because of their approximate position to midtropospheric westerlies. SLR values reveal climatological dry (high SLR) snow conditions over the Rockies and wet (low SLR) snow conditions over the Cascade Mountains—the former suggesting a higher tendency to drift. Figure 2a also portrays six subdomains over which average station bias (Fig. 1d), DJF climatological NARR 10-m winds (Fig. 2a), and SLR (Fig. 2b) values are computed for high- and low-biased regions. These averages are presented in Table 1 with high-biased domains (boxes 1, 2, and 3) showing higher 10-m wind speeds and SLR values when compared to the low-biased domains (boxes 4, 5, and 6). SNOTEL stations that exhibited higher frequency and magnitude of inconsistent yearly MSWE and AP occur in regions with dry snow and high average wind speeds. Li and Pomeroy (1997) found that on average, wind speed thresholds for dry snow to drift were 7.7 m s21 compared to 9.9 m s21 for wet snow (snow conditions defined by snowpack cohesiveness). Regions with dry snow conditions surpass the drift threshold more frequently when combined with higher average wind speeds, leading to a higher potential for positively biased SWE observation owing to wind drift and vice versa for regions where wet snow and lower average wind speeds occur. To isolate days when the most likely source of inconsistency leans toward snow drifting as opposed to precipitation undercatchment, we used days when
1974
JOURNAL OF HYDROMETEOROLOGY
VOLUME 13
TABLE 1. Comparison of high- (boxes 1, 2, and 3) and low-bias SWE regions (boxes 4, 5, and 6) illustrated by the six green boxes in Fig. 2a. Domain averages of SNOTEL stations percent number of years on record where MSWE was greater than AP (Fig. 1d), DJF climatological NARR 10-m winds (m s21), and snow-to-liquid ratio values are shown as well as the latitude–longitude boundaries of each region. Domain average Region
MSWE . AP (%)
10-m wind (m s21)
Snow-to-liquid ratio
1. Northern Utah 2. Northwest Wyoming 3. Colorado 4. Southern Idaho 5. Arizona/New Mexico 6. Pacific Northwest
14.9 15.4 12.5 7.7 4.0 1.9
1.9 3.8 2.9 2.4 1.2 2.3
14.4 16.3 15.1 14.0 12.4 11.7
SWE increased and no precipitation was observed (now referred to as drift days). Figure 3 illustrates spatial drift-day anomaly (Fig. 3a), spatial no-precipitationday anomaly (Fig. 3b), relative percentage anomaly for the ratio between Figs. 3a and 3b (Fig. 3c), and NARR 10-m average wind difference (vectors) between drift days and nondrift days (Fig. 3d; i.e., constant daily SWE with no observed precipitation). The anomaly here represents station values with respect to the network average. For the 672 stations with at least 5 years of observation, network averages are 13.3 days for drift days, 107.9 days for no-precipitation days, and 12.5% for the relative percentage. Accounting for the difference in frequency of no-precipitation days across the network (Fig. 3b), Fig. 3c better illustrates the anomaly of the frequency of drift days and displays a similar spatial pattern shown in Fig. 3a. The most notable differences exist over the Cascade Mountains, where Fig. 3c shows above-average relative percentage anomaly, which can be explained by the strong negative disparity found in this region for days with no precipitation compared to the rest of the network. Also of interest, negative correlation exists between MSWE and AP inconsistencies (Figs. 1c,d,e) and relative percentage anomalies of drift days (Fig. 3c) for the Sierra Nevada. Based on this negative correlation, it is likely that precipitation undercatchment plays a larger role in the MSWE bias shown in Fig. 1 than drifting snow. Additionally, a 31% stronger wind speed was observed for the drift days, although wind direction differences were less substantial. For stations with above-average drift days shown in Fig. 3a, the wind differences show universal westerly to southwesterly anomalies west of the Rockies, suggesting the influence of incoming Pacific troughs. Compared with the patterns of MSWE and AP inconsistency shown in Fig. 1, drift-day anomaly (Fig. 3a) corresponds well with where more frequent MSWE and AP inconsistencies exist (Rocky Mountains, and higher
Boundaries 40.08–42.58N 43.08–45.58N 36.68–41.58N 43.28–45.58N 32.58–35.58N 41.58–49.28N
113.08–110.08W 111.58–109.08W 108.78–104.58W 116.58–113.08W 113.08–107.08W 123.08–120.58W
elevations of the Intermountain West region). Most notably seen over the Cascade Mountain range, station placement relative to windward or leeward mountain slope illustrates opposing drift-days anomaly. Most likely, this pattern is controlled by the rain shadow effect (Smith 1979), which could produce a relatively quick transition from wet (windward) to dry (leeward) snow conditions.
4. Conclusions and discussion Agreement between patterns of snow-drift mechanisms (wind and SLR conditions) and drift-day anomalies, as well as the greater wind speeds shown during drift scenarios, provides evidence to support the hypothesis that geographical dependence of the MSWE and AP inconsistency (where SWE outpaces AP) is predominantly a result of drifting snow. It appears that SNOTEL stations at higher elevations (Rocky and Sierra Nevada Mountains, and the Uinta/Wasatch ranges in Utah) and stations within the interior west have an increased potential for yearly MSWE values to grow higher than AP values. With the exception of the Sierra Nevadas, these regions commonly exhibit dry snow conditions and high westerly wind speeds—together they increase the potential for drifting snow. Conversely, stations throughout the Cascade Mountains as well as lower-elevation stations in the interior of the western United States seldom reported any inconsistency, possibly because of the wet snow conditions and/or the lower average wind speeds. Despite numerous high-biased stations, evidence of drifting over the Sierra Nevadas was less apparent, indicating a stronger gauge undercatchment effect on the inconsistency between MSWE and AP. While this study focused mainly on positive bias (overestimate) of SWE observations by drifting snow, snow scour (removal of snow from the column) should be considered. It is presumed that station interaction with surrounding topography and land cover will factor into how drifting/scour biases SWE observations
DECEMBER 2012
MEYER ET AL.
1975
FIG. 3. (a) Anomaly number of drifting days per year (DriftDaystn 2 DriftDayNetworkavg) for each SNOTEL station, where red/blue triangles represent above-/below-average drift days per year with increasing triangle size representing increasing magnitude anomaly. Black circles represent stations that never experienced a ‘‘drift day,’’ while black dots represent stations that had less than 5 years of operation. (b) As in (a), but for the anomaly of average days per year with no precipitation. (c) As in (a), but for the percent relative anomaly of drift days [(drift days/no-precipitation days)stn average 2 (drift days/no-precipitation days)network average]. (d) Difference vectors from NARR 10-m winds between drifting and nondrifting scenarios (see text for scenario descriptions). Red dots represent stations with less than 5 years of observation. All panels are shown with elevation contours as in Fig. 1.
(positively or negatively). This surface cover interaction could partially explain the various (yet scattered) stations where drifting/scouring is more likely to occur, but positive SWE inconsistency is very difficult to observe. Without additional observations, it is impossible to make a judgment that MSWE less than AP is because of
melting, sublimation, or scouring. In addition, these numerous sites are likely ideally placed with regard to the surrounding land cover—minimizing the effects of snowdrift and therefore minimizing positive SWE inconsistency. Future work should merge surrounding land-cover metadata with daily wind data observed by
1976
JOURNAL OF HYDROMETEOROLOGY
enhanced SNOTEL sites to gain a more comprehensive understanding of the effect snow drift/scour has on the daily SWE and AP relationship. Acknowledgments. This work was supported by the National Science Foundation Microsystem Program Project NSFEF-1065730 and the Bureau of Reclamation Project R11AC81456. The authors wish to thank Martin A. Baxter of Central Michigan University for providing the snow-to-liquid ratio data. The authors also would like to acknowledge and thank the three anonymous reviewers who provided useful comments. REFERENCES Baxter, A. M., C. E. Graves, and J. T. Moore, 2005: A climatology of snow-to-liquid ratio for the contiguous United States. Wea. Forecasting, 20, 729–744. Carson, E. C., 2007: Temporal and seasonal trends in streamflow in the Uinta Mountains, northeastern Utah, and relation to climatic fluctuations. Arct. Antarct. Alp. Res., 39, 521–528. Fassnacht, S. R., K. A. Dressler, and R. C. Bales, 2003: Snow water equivalent interpolation for the Colorado River Basin from snow telemetry (SNOTEL) data. Water Resour. Res., 39, 1208, doi:10.1029/2002WR001512. Groisman, P. Ya, and D. R. Legates, 1994: The accuracy of United States precipitation data. Bull. Amer. Meteor. Soc., 75, 215– 227. Hamlet, A. F., P. Q. Mote, M. P. Clark, and D. P. Lettenmaier, 2005: Effects of temperature and precipitation variability on snowpack trends in the western United States. J. Climate, 18, 4545–4561. He, M., T. S. Hogue, K. J. Franz, S. A. Margulis, and J. A. Vrugt, 2011: Corruption of parameter behavior and regionalization by model and forcing data errors: A Bayesian example using the SNOW17 model. Water Resour. Res., 47, W07546, doi:10.1029/2010WR009753. Jin, J., and N. L. Miller, 2011: Improvement of snowpack simulations in a regional climate model. Hydrol. Processes, 25, 2202– 2210, doi:10.1002/hyp.7975.
VOLUME 13
Johnson, J. B., and D. Marks, 2004: The detection and correction of snow water equivalent pressure sensor errors. Hydrol. Processes, 18, 3513–3525, doi:10.1002/hyp.5795. Li, L., and J. W. Pomeroy, 1997: Estimates of threshold wind speeds for snow transport using meteorological data. J. Appl. Meteor, 36, 205–213. Mesinger, F., and Coauthors, 2006: North American Regional Reanalysis. Bull. Amer. Meteor. Soc., 87, 343–360. Mote, P. W., M. P. Clark, and A. F. Hamlet, 2004: Variability and trends in mountain snowpack in western North America. Preprints, 15th Symp. on Global Change and Climate Variations, Seattle, WA, Amer. Meteor. Soc., 5.1. [Available online at https:// ams.confex.com/ams/84Annual/techprogram/paper_71019.htm.] Mote, T. L., A. J. Grundstein, D. J. Leathers, and D. A. Robinson, 2003: A comparison of modeled, remotely sensed, and measured snow water equivalent in the northern Great Plains. Water Resour. Res., 39, 1209, doi:10.1029/2002WR001782. Neff, E. L., 1977: How much rain does a rain gage gage? J. Hydrol., 35, 213–220. Pederson, G. T., S. T. Gray, T. Ault, W. Marsh, D. B. Fagre, A. G. Bunn, C. A. Woodhouse, and L. J. Graumlich, 2011: Climatic controls on the snowmelt hydrology of the northern Rocky Mountains. J. Climate, 24, 1666–1687. Schaefer, G. L., and R. F. Paetzold, 2001: SNOTEL (SNOwpack TELemetry) and SCAN (Soil Climate Analysis Network). Automated Weather Stations for Applications in Agriculture and Water Resources Management: Current Perspectives. K. G. Hubbard and M. V. K. Sivakuman, Eds., WMO/TD 1074, 187–194. [Available online at http://www.wamis.org/ agm/pubs/agm3/WMO-TD1074.pdf.] Serreze, M. C., M. P. Clark, R. L. Armstrong, D. A. McGinnis, and R. S. Pulwarty, 1999: Characteristics of the western United States snowpack from snowpack telemetery (SNOTEL) data. Water Resour. Res., 35, 2145–2160, doi:10.1029/ 1999WR900090. ——, ——, and A. Frei, 2001: Characteristics of large snowfall events in the montane western United States as examined using Snowpack Telemetry (SNOTEL) data. Water Resour. Res., 37, 675–688, doi:10.1029/2000WR900307. Smith, R. B., 1979: The influences of mountains on the atmosphere. Adv. Geophys., 21, 87–230, doi:10.1016/S0065-2687(08)60262-9. WMO, 2008: Guide to meteorological instruments and methods of observation. World Meteorological Organization Publ. WMO-No. 8, 681 pp.