Interdiscip Toxicol. 2014; Vol. 7(2): 73–84. doi: 10.2478/intox-2014-0010
interdisciplinary
Copyright © 2014 SETOX & IEPT, SASc. This is an Open Access article distributed under the terms of the Creative Commons Attribution License (http://creativecommons.org/licenses/by/2.0), which permits unrestricted use, distribution, and reproduction in any medium, provided the original work is properly cited.
ORIGINAL ARTICLE
Systems toxicology approaches enable mechanistic comparison of spontaneous and cigarette smoke-related lung tumor development in the A/J mouse model Karsta LUETTICH 1#, Yang XIANG 1#, Anita ISKANDAR 1, Alain SEWER 1, Florian MARTIN 1, Marja TALIKKA 1, Patrick VANSCHEEUWIJCK 1,2, An BERGES 2, Emilija VELJKOVIC 1, Ignacio GONZALEZ-SUAREZ 1, Walter SCHLAGE 1, Julia HOENG 1, Manuel PEITSCH 1 1 Biological Systems Research, Philip Morris International Research and Development, CH-2000 Neuchâtel, Switzerland 2 Philip Morris Research Laboratories bvba, 3001 Leuven, Belgium # Both authors contributed equally to this manuscript.
ITX070214A01 • Received: 28 April 2014 • Revised: 23 June 2014 • Accepted: 26 June 2014
ABSTRACT The A/J mouse is highly susceptible to lung tumor induction and has been widely used as a screening model in carcinogenicity testing and chemoprevention studies. However, the A/J mouse model has several disadvantages. Most notably, it develops lung tumors spontaneously. Moreover, there is a considerable gap in our understanding of the underlying mechanisms of pulmonary chemical carcinogenesis in the A/J mouse. Therefore, we examined the differences between spontaneous and cigarette smokerelated lung tumors in the A/J mouse model using mRNA and microRNA (miRNA) profiling. Male A/J mice were exposed whole-body to mainstream cigarette smoke (MS) for 18 months. Gene expression interaction term analysis of lung tumors and surrounding nontumorous parenchyma samples from animals that were exposed to either 300 mg/m3 MS or sham-exposed to fresh air indicated significant differential expression of 296 genes. Ingenuity Pathway Analysis® (IPA®) indicated an overall suppression of the humoral immune response, which was accompanied by a disruption of sphingolipid and glycosaminoglycan metabolism and a deregulation of potentially oncogenic miRNA in tumors of MS-exposed A/J mice. Thus, we propose that MS exposure leads to severe perturbations in pathways essential for tumor recognition by the immune system, thereby potentiating the ability of tumor cells to escape from immune surveillance. Further, exposure to MS appeared to affect expression of miRNA, which have previously been implicated in carcinogenesis and are thought to contribute to tumor progression. Finally, we identified a 50-gene expression signature and show its utility in distinguishing between cigarette smoke-related and spontaneous lung tumors. KEY WORDS: A/J mouse; lung tumorigenesis; cigarette smoke exposure; gene expression; microRNA (miRNA) expression
Introduction Mouse models have been employed to study the carcinogenicity of chemical compounds including cigarette smoke and to infer underlying mechanisms of lung tumor development in humans (Meuwissen & Berns, 2005). Different strains of mice display markedly varied sensitivity to lung tumor development (Gordon & Bosland,
Correspondence address: Karsta Luettich, PhD. Philip Morris Products S.A., Philip Morris International Research and Development, Quai Jeanrenaud 5, CH-2000 Neuchâtel, Switzerland TEL.: + 41 58 242 23 16 • E-MAIL:
[email protected]
2009). For example, strain A mice spontaneously develop pulmonary tumors with age and in response to treatment with chemical carcinogens or cigarette smoke. In this model, K-ras oncogene activation is associated with enhanced risk of lung tumor susceptibility, illustrated by presentation of pulmonary adenoma (Chen et al., 1994). However, the A/J mouse model has other disadvantages including the fact that there is only a small increase in the number of mostly benign lung tumors after chemical exposure and a shallow dose-response curve (Coggins, 2010). In the past, a number of A/J mouse studies with cigarette smoke were performed in which mice were exposed to either mainstream cigarette smoke (MS) or
74
Cigarette smoke-related lung tumorigenesis in A/J mouse Karsta Luettich, et al.
a combination of MS and sidestream cigarette smoke (SS), which is used as an experimental surrogate for environmental tobacco smoke exposure (Coggins, 2010). Although a considerable number of studies failed to produce significant increases of either tumor incidence or multiplicity in A/J mice that were chronically exposed to cigarette smoke, other studies, including those that were performed by our group, successfully demonstrated significantly more lung tumors following exposure to MS or the combination of MS and SS relative to sham (Stinn et al., 2010; Stinn et al., 2005). Moreover, an 18-month MS exposure regimen has been shown to be sufficient in eliciting a concentration-dependent lung tumor response (Stinn et al., 2013a). This is in contrast to the previously reported exposure regimen that included a 5-month exposure followed by a 4-month post-inhalation period which was thought to be required and optimal for the full development of cigarette smoke-associated pulmonary lesions in this mouse model (Witschi, 2005). Although some evidence supports cigarette-smokeinduced inflammation as a major contributor to lung tumor formation in the A/J mouse (Bauer & Rondini, 2009), there is a gap in our understanding of the underlying mechanisms of A/J pulmonary carcinogenesis related to proven and suspected lung carcinogens. One major limiting factor in elucidating the molecular events leading to tumor formation in the context of cigarette smoking is the inherently high susceptibility to spontaneous lung tumor development in air-exposed or sham A/J mice (Chen et al., 1994). We therefore conducted this study to examine the differences between spontaneous and cigarette smoke-related lung tumors in the A/J mouse model of lung tumorigenesis using gene expression and miRNA profiling and sought to identify possible discriminators between these two tumor entities.
Materials and methods Animal Experiments The current study was a sub-study of an A/J mouse validation study, and its design has been previously described in detail (Stinn et al., 2013a; Stinn et al., 2013b). Briefly, male A/J mice aged between 8 and 12 weeks received whole-body exposure to MS at concentrations of 75, 150, and 300 mg/m3 of total particulate matter (TPM) (animal groups MS-75, MS-150, and MS-300, respectively) from the 3R4F reference cigarette (University of Kentucky, Lexington, KY, USA) for 6 h/day and 5 days/week for 18 months. A group of age-matched male mice exposed to air was included as sham control. A 2-day post-inhalation period was added to allow for the down-regulation of most of the acute effects of MS exposure on gene expression, thus enabling the examination of longer-term effects that show the characteristics of the tumorigenic process. All animal experimental procedures were in conformity with the American Association for Laboratory Animal Science (AALAS) Policy on the Humane Care and Use of Laboratory Animals (AAALAC, 1991) and ISSN: 1337-6853 (print version) | 1337-9569 (electronic version)
were approved by the Institutional Animal Care and Use Committee (IACUC, Leuven, Belgium).
Histopathology Histopathologic evaluation was conducted on mice exposed to air (sham control, N=27) and to MS of the 3R4F cigarette smoke, (N=33, 37, and 34 mice of the MS-75, MS-150 and MS-300 groups, respectively) by a certified pathologist, who was blinded to the individual treatment of the animals, as reported previously (Stinn et al., 2013a).
Gene expression analysis Gene expression analysis was performed on pairs of matched tumor nodule (T) and surrounding, nontumorous parenchyma (P) tissues from the cigarette smoke-exposed mice and sham controls as described previously (Stinn et al., 2013a). Frozen sections (20 μm) from whole lung tissue were placed on sterilized glass slides and stained with cresyl violet (Sigma, Taufkirchen, Germany). Lung tumor and parenchyma tissues were collected from these slides using laser capture microdissection (PALM® Microbeam, Zeiss, Jena, Germany). One slide was preserved for the histopathologic characterization of the tumor. The tissues were immediately lysed with Qiazol lysis buffer (Qiagen, Hilden, Germany), and RNA was isolated using the miRNeasy Mini Kit (Qiagen) according to the manufacturer’s protocol. All RNA samples had an RNA integrity number (RIN) ≥6.0. Transcriptomic analysis was performed using the Affymetrix Gene Chip® Mouse Genome 430 v2.0 (Affymetrix, Santa Clara, CA, USA). After synthesis of double-stranded cDNA, biotinylated complementary RNA (cRNA) was generated and fragmented. The degree of fragmentation and the length distribution of this fragmented biotinylated cRNA was checked by capillary electrophoresis using the Agilent 2100 Bioanalyzer (Agilent Technologies, Waldbronn, Germany). Ten micrograms of biotinylated fragmented cRNA was hybridized to the GeneChip® for 16 h at 60 rpm in a 45 °C GeneChip® Hybridization Oven 640 (Affymetrix). The arrays were washed and stained on the GeneChip® Fluidics Station 450 (Affymetrix), followed by antibody signal amplification, washing, and staining on using streptavidin R-phycoerythrin. The arrays were scanned using the Agilent Gene Array Scanner 3000 7G. Scanned image files were visually inspected for artifacts and then submitted to analysis.
MicroRNA analysis The same preparations of total RNA were used for miRNA expression profiling. The dual-channel Exiqon miRCURY LNA™ platform was used for hybridization, which was performed directly by Exiqon (Vedbaek, Denmark). The FirstChoice Human Total RNA Survey Panel (Ambion, Austin, TX, USA) was used for the reference RNA. Total RNA samples (500 ng) and reference RNA samples (100 ng) were labeled with Hy3™ and Hy5™ fluorescent labels, respectively, using the miRCURY™ Hy3/Hy5 Power labeling kit (Exiqon, Vedbaek, Denmark). Each total RNA sample was mixed with a reference RNA
Interdisciplinary Toxicology. 2014; Vol. 7(2): 73–84 Full-text also available online on PubMed Central
sample and hybridized in a randomized order to the miRCURY LNA™ miRNA arrays (version 11), following a common reference design where each experimental sample is hybridized against a common reference sample. The arrays were annotated for the probes targeting all miRNAs for human, mouse, or rat registered in the miRBASE miRNA registry version 16. The hybridization was performed using a Tecan HS4800 hybridization station (Tecan, Vienna, Austria). Following hybridization and processing, the arrays were scanned using the Agilent G2565BA Microarray Scanner System (Agilent Technologies, Santa Clara, CA) and quantification of the signals was performed using ImaGene 9.0 software (BioDiscovery, Hawthorne, CA, USA). Raw data were provided in an ImaGene text file format.
Statistical and computational analysis Gene expression data processing The quality of the Affymetrix .CEL files was checked by utilizing the R packages affy, gcrma, and affyPLM (Bolstad et al., 2003; Gautier et al., 2004; Wu et al., 2005). Normalized unscaled standard error (NUSE) and relative log expression (RLE) box plots were generated to identify potential outliers. Microarray expression values were generated from the .CEL files using background correction, quantile normalization, and median polish summarization.
Gene expression interaction analysis Surrounding, non-tumorous parenchyma (P) and matched tumor tissue (T) samples from 2 sham controls, 2 MS-75, 5 MS-150 and 5 MS-300 animals were available for gene expression analysis (Table 1). Interaction effects between tissue type (T or P) and cigarette smoke concentration on gene expression were determined using the following linear model: GxP = β0 + β1 × CeT + β2 × doL + β3 × doM + β4 × doH + β5 × CeT : doL + β6 × CeT : doM + β7 × CeT : doH + ε with L, M, and H denoting MS-75 (L), MS-150 (M), and MS-300 (H) groups, respectively, and ε is the error term. The term CeT represents the effects of tumor tissue, and the terms doL, doM and doH indicate the effects of the different MS concentrations. The interaction coefficient CeT:doH describes the difference in gene expression between tumor and parenchyma of the mice from the MS-300 group as compared to the sham controls. For the MS-75 and MS-150 groups, the interaction terms were defined similarly. The cutoff for the false-discovery rate (FDR) was 0.01. Genes that were significantly altered under the interaction analysis were further analyzed with respect to their functions and roles in signaling pathways using Ingenuity Pathway Analysis® (IPA®; build version 212183, content version 14855783 (release date 2013-02-05); Ingenuity Systems, Redwood City, CA, USA). In addition, IPA® and its knowledge base were also used to generate biological networks reflecting gene-gene relationships.
Gene expression signature generation A gene expression signature able to discriminate between spontaneously arising tumors and tumors that developed following cigarette smoke exposure was extracted from the interaction coefficient CeT:doH by using an in-house developed program, GenSigPred. For any gene expression profile T and phenotype G, the size of the gene expression signature, N, and the number of resamplings R were predefined. GenSigPred used a multistep process whereby the data set was randomly split into two parts, consisting of a training set with 20% of the samples and a test set with the remaining 80% samples. In the training data set, the genes were ranked based on statistics obtained by supervised machine-learning approaches including significance analysis of microarrays (SAM) (Tusher et al., 2001) and the top N probe sets/genes GS(N, iter) in the rank list were selected. In the second step a classifier C(N, iter) was built based on the N genes by using a support vector machine (SVM) algorithm (Cortes & Vapnik, 1995) from the R package e1071. The predictions for every sample in the test set and the prediction performance P(N, iter) were recorded. The above procedure was performed R=50 times. The overall prediction error for specific N, Per(N) = Average(P(N,1), P(N,2), …, P(N,R)), was estimated. The union of genes was defined as GSA = {GS(N,1), GS(N,2), …, GS(N,R)}. The consensus of top genes in the R rank lists was selected based on the frequency of emergence of genes in the union of genes. Different values of N were tried and the value with good performance was selected.
MicroRNA microarray data preprocessing Following the Hy3™-based “pseudo-single-color” pipeline used by Exiqon (Vedbaek, Denmark), the raw data were preprocessed by using the Bioconductor limma package in the R statistical computing environment (Smyth, 2004). A normexp background subtraction (offset=10) was first applied (Ritchie et al., 2007) followed by a probe-level quantile normalization (Bolstad et al., 2003). The probe set intensities were obtained by median summarization.
Table 1. Summary of tissue samples used for gene expression analysis. Number of Mice Tissue
Sham
MS-75
MS-150
MS-300
Parenchyma
2
2
5
5
Tumor
8
8
6
9
Table 2. Summary of tissue samples used for miRNA expression analysis. Number of Mice Tissue
Sham
MS-75
MS-150
MS-300
Parenchyma
10
10
10
10
Tumor
8
7
6
9
Copyright © 2014 SETOX & Institute of Experimental Pharmacology and Toxicology, SASc.
75
Cigarette smoke-related lung tumorigenesis in A/J mouse Karsta Luettich, et al.
All arrays satisfied the standard quality control criteria. However, one outlier was detected based on betweenarray correlations and was excluded from further analysis. The probe sets were then filtered for the mouse miRNA, “present” in at least half of the samples of at least one of the four sample groups. The “present”/”absent” calls were based on Exiqon’s recommendation to take a detection threshold at the 5th percentile of the distribution of the intensities measured in a given array. This yielded a final 260*70 miRNA expression matrix.
MicroRNA microarray data analysis The data available for miRNA expression analysis are summarized in Table 2. In some cases, technical replicates were incorporated to obtain the final number of samples per experimental group. Increasing the number of samples to 10 in this fashion resulted in a decrease of the noise which was expected to occur from miRNA hybridization analysis. Correlations between a small number of samples due to their provenance from the same animal were not taken into account and independence between all of the samples was assumed. This assumption enabled us to use the same linear model that was used for gene expression analysis (see Gene Expression Interaction Analysis). Here, the interaction coefficient CeT:doH signifies the difference in miRNA expression between tumor and parenchyma of the mice from the MS-300 group as compared to the difference in miRNA expression between tumor and parenchyma of sham controls. A less stringent FDR cutoff of 0.05 was applied.
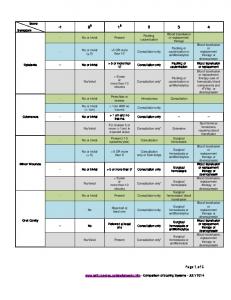
Sham Exposure
Smoke Exposure Tumor (T) Non-tumor parenchyma (P)
Tumor region Level of gene expression
76
Non-tumor parenchyma region
Sham Exposure
Smoke Exposure
Figure 1. Illustration of the interaction analysis. The upper panel shows the two different tissue types (tumor (T) and nontumorous parenchyma (P)) that were isolated from animals following sham and mainstream cigarette smoke (MS) exposure. Rectangles (blue or red) illustrate various expression levels of a gene. The lower panel depicts the interaction term reflecting the changes of gene expression which were different in T as compared to the surrounding P tissues following MS exposure. In other words, the genes with significant interaction are those whose levels were differentially affected between the two tissue types upon MS exposure.
ISSN: 1337-6853 (print version) | 1337-9569 (electronic version)
Results Histopathology The results of the histopathologic evaluation of tumors from both sham control and MS-exposed A/J mice have been reported previously (Stinn et al., 2013a). Briefly, adenomas presented the highest contribution to lung tumor incidence, followed by carcinomas and nodular hyperplasias, independent of exposure conditions (MS or sham). In addition, while the incidence of nodular hyperplasia was widely independent of MS exposure, there was a higher incidence of both adenomas and carcinomas in the cigarette-smoke-exposed animals, compared to animals in the sham control group. However, only adenoma incidence in the MS-150 and MS-300 groups was significantly different from that observed in the sham control animals (p