The Journal of Immunology
Differential Suppression of Tumor-Specific CD8+ T Cells by Regulatory T Cells Edward James,* Alex Yeh,*,1 Cathy King,* Firouzeh Korangy,† Ian Bailey,* Denise S. Boulanger,* Benoıˆt J. Van den Eynde,‡ Nicholas Murray,* and Tim J. Elliott* In the CT26 BALB/c murine model of colorectal carcinoma, depletion of regulatory T cells (Tregs) prior to tumor inoculation results in protective immunity to both CT26 and other BALB/c-derived tumors of diverse histological origin. In this paper, we show that cross-protection can be conferred by adoptively transferred CD8+ CTLs. Other schedules for inducing immunity to CT26 have been described, but they do not lead to cross-protection. We show that Treg ablation facilitates the development of new CTL specificities that are normally cryptic, and have mapped the root epitope of one of these responses. This work has allowed us to demonstrate how the specificity of CTL responses to tumor Ags can be controlled via differential suppression of CTL specificities by Tregs, and how this can result in very different physiological outcomes. The Journal of Immunology, 2010, 185: 5048–5055.
S
tudies in mouse models of cancer have shown that the acquired immune system can prevent both onset and progression of tumors and that Ag-specific T cells may confer lifelong protection against malignancy (1). Descriptive studies in human cancers, particularly melanoma, ovarian cancer, and colonic cancer, have strongly suggested that the presence of tumorinfiltrating lymphocytes is associated with better survival outcomes (2–4). Tumors, however, possess many strategies for evading the immune system. One critical pathway is the induction of tumor Ag-specific immune tolerance mediated through the generation of T regulatory cells (Treg), and several lines of evidence support the immunosuppressive role of Tregs in influencing cancer prognosis (5, 6). There is an increase in the number of CD4+CD25+ Tregs in the peripheral blood of cancer patients in parallel with advancing stage of disease, and this plays a major part in the failure of many immunotherapies against tumors. Patients with early non-small cell lung and breast cancer with higher proportions of tumor Tregs relative to tumor-infiltrating lymphocytes had a significantly higher risk of recurrence, and in melanoma this predicted reduced patient survival (7–9). In ovarian cancer, the absolute numbers of Tregs in tumor tissue was shown to be a significant, independent predictor of mortality even after controlling for stage, surgical debulking, *Cancer Sciences Division, School of Medicine, University of Southampton, Southampton, United Kingdom; †Department of Gastroenterology, Hepatology, and Endocrinology, Hannover Medical School, Hannover, Germany; and ‡Brussels Branch and Cellular Genetics Unit, Ludwig Institute for Cancer Research, Catholic University of Louvain, Brussels, Belgium 1 Current address: Department of Surgery, Kaohsiung Veterans General Hospital, Kaohsiung, Taiwan, Republic of China.
Received for publication January 21, 2010. Accepted for publication August 30, 2010. This work was supported by grants from Cancer Research UK (to T.E. and E.J.), the Medical Research Council (T.E.), and the Wellcome Trust (E.J.). Address correspondence and reprint requests to Dr. Edd James, University of Southampton, Somers Cancer Research Building, MP824 Tremona Road, Southampton, Hampshire SO166YD, United Kingdom. E-mail address:
[email protected] The online version of this article contains supplemental material. Abbreviations used in this paper: CCD2, CT26-specific Balb/c H2-d restricted T cell clone 2; HERV, human endogenous retroviruses; lacZ, b-galactosidase; MuLV, murine leukemia virus; Treg, regulatory T cell. Copyright Ó 2010 by The American Association of Immunologists, Inc. 0022-1767/10/$16.00 www.jimmunol.org/cgi/doi/10.4049/jimmunol.1000134
and other factors known to affect survival (5). Patients with high numbers of Tregs in ovarian tumor tissue were observed to have a mortality of 100% at 5 y, compared with 50% in the low-Treg group. In addition, Tregs capable of inhibiting tumor-associated Ag-specific immune responses were increased in patients with colorectal cancer (10). These data indicate an important role of Tregs in modulating the antitumor immune response, and the induction of Tregs may present a significant barrier to the successful application of anticancer immunotherapy. In mouse models, depletion of Tregs generally results in better immune protection against tumors (11–14), and we have shown that mice depleted of Tregs can reject the colorectal tumor line CT26, which is not normally immunogenic. The rejection of the primary tumor was accompanied by development of protective immunity, because mice vaccinated with CT26 were able to reject the same tumor when rechallenged 50–74 d later. Both CD4+ and CD8+ T cells could mediate immunity to the second CT26 challenge. In addition, mice rendered CT26 immune following antiCD25 mAb treatment were able to reject other tumor lines of diverse histological origin (12). Our results indicate, therefore, that depletion of Tregs uncovers cryptic responses to Ags that are shared among different tumor cell lines. CT26-specific T cell responses can be elicited by different forms of vaccination in the presence of regulatory cells, but in these cases T cell responses are highly focused on a single tumor-specific epitope, AH1 (corresponding to amino acids 423–431 of the endogenous murine leukemia virus [MuLV], gp90 gene), presented by MHC class I H-2Ld (15). Taken together, these data suggest that immune responses to some Ags are more tightly regulated than others. This may be a consequence of the types of Ags that have the ability to activate Tregs. We therefore undertook to identify the Ag or Ags recognized by cross-protective CD8+ CTLs and to determine the immunological correlates of cross-protection.
Materials and Methods Mice, Abs, and in vivo depletion BALB/c mice were bred locally under specific pathogen-free conditions in Southampton, U.K. Female or male mice (6–8 wk old) were used in all experiments. During experimental procedures, mice were housed in conventional facilities. Hybridomas secreting CD25 (PC61, rat IgG1)-specific
The Journal of Immunology mAb have been described previously (16, 17) and were grown in culture and mAb purified by precipitation in saturated ammonium sulfate. For depletion, mice received 1 mg mAb PC61 injected i.p. in volumes of 100– 200 ml, twice with a 1-d interval. The Ab was administered 3 and 1 d prior to the injection of tumor cells.
Tumor cells Cultures of the cell lines, CT26, CT26/GM-CSF, P815, MCFL, Renca, and A20 (American Type Culture Collection, Manassas, VA), were maintained in RPMI 1640 (Sigma-Aldrich, St. Louis, MO) supplemented with 10% FCS (Globepharm, Surrey, U.K.), 2 mM L-glutamine, penicillin/streptomycin (Sigma-Aldrich), 50 mM 2-ME, 1 mM sodium pyruvate (Life TechnologiesBRL, Rockville, MD), and 1mM HEPES (PAA Laboratories, Dartmouth, MA). CT26/GM-CSF was derived as described (18). BCL1 was passaged in vivo only (19). MCFL was a generous gift from Dr. Mario Colombo (Instituto Nazionale Tumori, Milan, Italy). In all experiments, mice were injected s.c. with 105 tumor cells in PBS. All these cell lines were tested and were found to be mycoplasma free.
Isolation and adoptive transfer of lymphocyte subsets Single-cell suspensions were prepared from the spleens of donor mice. The cells were labeled with MACS Abs for CD4+ and CD8+ T cells and purified using MACS VS+ separation columns according to the manufacturer’s instructions (Miltenyi Biotec, Bisley, U.K.). Following elution of the purified cells off the columns, the purity of the cells (.90%) was confirmed by FACS analysis. Cells were resuspended in PBS at a concentration of 5 3 107/ml. Mice were injected i.v. with 200 ml cell suspension.
Cell lines and hybridomas Generation of CTL lines, clones, b-galactosidase (lacZ)-inducible T cell hybrids has been described (20, 21). Briefly, spleen cells from CT26immune Treg-depleted BALB/c mice were removed of CD4+ T cells, as described above, and stimulated in vitro every 12–14 d with irradiated CT26 cells and 20 IU/ml rIL-2. CTL clones were generated using limiting dilution of the parental CTL lines. The lacZ-inducible T cell hybridoma CCD2Z was generated by fusing the CTL clone CT26-specific Balb/c H2-d restricted T cell clone 2 (CCD2) with the BWZ.36/CD8a fusion partner, as described (21).
T cell activation assays LacZ-inducible T cell hybrids were cocultured with APCs that either were transfected with Ag cDNAs or were pulsed with exogenous peptides. The lacZ activity was measured as described previously (22). CTL lysis assays were performed with 51Cr-labeled tumor cells. WEHI killing was carried out using supernatant from CTL lines/clones cultured in the presence of tumor cells overnight. WEHI cells (TNF sensitive) were exposed to the supernatant and the level of killing measured.
Ab blocking For inhibition of presentation by MHC class I molecules, tumor cells were incubated for 1 h at 4˚C with anti–H-2Dd (34-5-8S), -Ld (B22.249) or Kd (SF1.1) before being cultured together with CCD2Z hybridoma cells, as described above.
cDNA library and expression screens A cDNA library using mRNA from CT26 cells was cloned into the EcoRI site of the mammalian expression vector pcDNA3 (Invitrogen, Carlsbad, CA). The cDNA library was screened in pools of 50–100 CFUs by transforming bacteria with recombinant plasmids, as described previously (23, 24). Briefly, cDNA pools were cultured, isolated, and screened in 96-well plates by transient transfection into recipient COS cells cotransfected with the relevant MHC class I cDNA. At 2 d later, 105 CTL clones were added to the wells and cocultured overnight. Supernatant from the overnight cultures was incubated with the TNF-b–sensitive cell line, WEHI, and the level of cell death measured by the MTT colorimetric assay (Sigma-Aldrich). The level of WEHI cell death is directly related to the amount of TNF-b present in the supernatant and thus indicates the level of stimulation of the CTL clones. The positive pool was identified by repeating the screening with individual cDNA clones from the positive cDNA pool. The P20E8A1 cDNA sequence is available from the NCBI Genbank (http://www.ncbi.nlm.nih.gov/genbank/) with the accession number GU441834.
Expression constructs and peptides All plasmid constructs were in the expression vector pcDNA3. Nested deletions were generated by PCR of the P20E8A1 cDNA with a vector-
5049 specific forward primer and a P20E8A1-specific reverse primer C2 (59GACTCTAGATTACTGTGATGTAGTCCCAG-39); C3 (59-GACTCTAGAAGTTTTTGGTCTGGTGCCGG-39), C7 (59-GACTCTAGAGAAGGATTCTGGACCACCAC-39), and C8 (59-GACTCTAGAGTGGTTTCGCAGCCCCAAGA-39) with KOD polymerase (Merck, Darmstadt, Germany). PCR fragments were digested with EcoRI and XbaI and cloned into the corresponding sites of pcDNA3. The synthetic peptides GSA9 (GGPESFYCA), GSS10 (GGPESFYCAS), GSW11 (GGPESFYCASW), GSG12 (GGPESFYCASWG), GFC13 (GGPESFYCASWGC), GSI11 (GGPESFYCASI), GSF11 (GGPESFYCASF), AH1 (SPSYVYHQF) (15), QL9 (QLSPFPFDL) (25), and YF9 (YGPSLYRRF) (26) were purified by HPLC and confirmed by mass spectrometry (GL Biochem, Shanghai, China).
Extraction and HPLC analysis of endogenously processed peptides Total acid-soluble peptide pools from tumor cells CT26, CT26/GM-CSF, A20, and MCFL were extracted as described (27). Briefly, 108 CT26 and CT26/ GM-CSF, 4 3 108 MCFL, 109 A20, 109 Renca, and 109 P815 cells were washed with PBS and extracted with 800 mL 10% boiling formic acid in the presence of a 10-mM “martyr” peptide ASNENMETM for 10 min. Cellular debris was removed by centrifugation and fractionated by HPLC after filtration through a 10-KDa filter (Millipore, Billerica, MA). Reverse-phase C18 ˚ ) was run column (Grace-Vydac, Hesperia, CA, 2.1 3 250 mm, 5 mM, 300 A in 0.1% trifluoroacetic acid in water (solvent A) and 0.1% trifluoroacetic acid in acetonitrile (solvent B). The gradient was from 17 to 45% (solvent B) at a rate of 1%/min. Flow rate was maintained at 0.25 ml/min, and 150-ml fractions were collected and dried in a vacuum centrifuge. Mock injections with sample buffer alone were performed prior to each extracted sample, using the same column and identical run conditions. The collected fractions were assayed in the same experiment, using the same APCs and T cells, in parallel with fractions from the cell extracts and synthetic peptide standards.
RMA-S stabilization RMA-S–Dd, –Ld cells were cultured overnight at 26˚C and then for 60 min in the presence of a saturating concentration of peptide (100 mM). Thecells were washed twice with PBS, then cultured for the indicated times at 37˚C. Cells were taken at the indicated times and stained with either antiDd Ab (34-5-8S) or anti-Ld Ab (30-5-7S) mAbs conjugated with PE (BD Biosciences, San Jose, CA). The cells were washed twice and analyzed by FACSCanto (BD Biosciences). Flow cytometry analysis was performed using FlowJo software (Tree Star, Ashland, OR).
CD8 T cell responses Spleen cells from CT26-challenged mice (Treg depleted or replete) were harvested between days 12 and 14. The CD8+ T cell responses to the CT26 Ags GSW11 and AH1 were measured by assay of inducible IFN-g by those cells in response to incubation with peptide or CT26. CD8+ T cells, APCs, and peptides/tumors were cultured together for 4 h in the presence of brefeldin A before being stained for surface CD8 and intracellular IFN-g (BD Biosciences). Cells were then analyzed on a FACSCanto (BD Biosciences) and data analyzed with FlowJo Software (Tree Star). Numbers are reported as above the background response of T cells alone. For in vitro restimulation, 5 3 106 spleen cells were cultured with 20 IU/ml rIL-2 (PeproTech, Rocky Hill, NJ) and 1 mM peptide (AH1 or GSW11). After 7 d, cells were harvested and assessed for AH1- and GSW11-specific CD8 T cell responses, as described above. For the second round of restimulation, cultures were harvested and live cells purified using Ficoll-Paque (GE Healthcare, Chalfont, U.K.). A total of 1 3 106 purified cells were incubated with 5 3 106 irradiated (10 Gy) BALB/c spleen cells, 20 IU/ml rIL2, and 1 mM AH1 or GSW11 peptide. As for the first round of stimulation, cells were harvested at day 7 and analyzed for AH1- and GSW11specific CD8 T cells.
Cytotoxic T cell lysis CT26 cells were stained with PKH26 (Sigma-Aldrich) according to the manufacturer’s instructions and incubated with AH1-specific CTLs at 37˚C for 2 h; then they were stained for 30 min on ice with 1 mM YoPro-1 (Molecular Probes, Eugene, OR) and analyzed by flow cytometry. Specific lysis of the PKH+ target cells was calculated as 100p[%YoPro1+ 2 %YoPro1+E:T = 0]/[100 2 %YoPro1+E:T = 0]. As negative controls, we included AH1-specific CTLs with BALB/c splenocytes.
Statistical analysis Analyses were performed using the Prism software (GraphPad, San Diego, CA). The p values were calculated using either the two-tailed unpaired t test or the paired t test.
5050
SUPPRESSION OF TUMOR-SPECIFIC CD8+ T CELLS
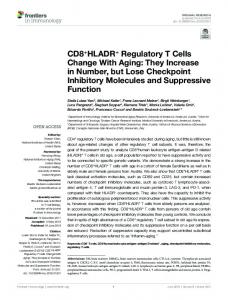
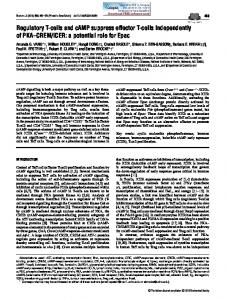
Results Derivation of cross-reactive CD8+ T cells in mice primed to CT26 in the absence of Tregs We have previously shown that both CD4+ and CD8+ effector T cells generated to the transplantable colon carcinoma CT26 in the absence of Tregs can mediate cross-protection and possibly act synergistically (12). Because, in the presence of Tregs, other forms of vaccination to CT26 using whole cells (either irradiated or transfected with GM-CSF) result in a protective CTL response that is highly focused on a single epitope (Ld-restricted AH1) and are not cross protective, our results suggested that depletion of Tregs uncovers responses to cryptic Ags that are shared among different tumor cell lines. We therefore sought to identify the source Ag(s) recognized by cross-protective CD8+ T cells, to improve our understanding of their apparent suppression by Tregs. To this end, we set out to establish CD8+ T cell lines that were representative of the cross-protective response in terms of their pattern of tumor recognition. T cell lines were generated from pooled purified CD8+ splenocytes from three mice immunized with live CT26 after Treg ablation. The splenocytes were shown to confer cross-protection to tumors of diverse origin when transplanted into SCID mice with a high potency (Fig. 1A). Several lines were generated in this way and found to contain predominantly H-2Dd- and H-2Kd-restricted reactivities (data not shown). H2-Ld-restricted responses, which would include responses to the previously described immunodominant epitope from CT26, AH1 (SPSYVYHQF) derived from an endogenous ecotropic leukemia virus, were rarely seen, although in one case, the H-2Ld-restricted AH1 reactivity, which we detected with fluorescent tetramers, appeared after months in culture and came to dominate after a period of 6 mo in continuous culture (data not shown). The anti-AH1 response was, however, the dominant reactivity when splenocytes from CT26 tumor-bearing, Tregreplete mice were cultured in the same way (data not shown). Thus, the CD8+ responses elicited to CT26 in the absence of Tregs appeared qualitatively different from those previously described, even at this low level of resolution. One T cell line, CCD, which contained reactivities that were inhibited by anti–H2-Kd and anti– H2-Dd but not anti–H2-Ld Abs, was selected for its ability to recognize CT26, A20, and Renca, but not the mastocytoma cell line P815, in both IFN-g secretion and killing assays (Fig. 1B), therefore displaying a pattern of reactivity that closely matched the bulk culture of CT26-stimulated splenocytes for Treg-depleted mice. We generated CTL clones from this line, of which one, designated CCD2, was prosecuted in detail. Clonality was confirmed with a panel of anti-TcRVa and Vb Abs (Va8.3b8.3 and continuously monitored by nested-set PCR). CCD2 reacted strongly against CT26, A20, and BCL-1; however, the response to Renca was significantly lower (Fig. 1C; p = 0.001). Further characterization showed the response to CT26 was inhibited by anti-Dd and -Dd/Kd but not anti-Ld or isotype control Abs (Fig. 1D). Thus the CCD2 CTL displayed an H-2Dd–restricted pattern of cross-reactivity that was representative of the cross-protective CD8+ T cell response in Treg-depleted, CT26-immunized mice. Identification of a cross-reactive Ag by expression cloning To identify the Ag recognized by the cross-reactive CTL CCD2, we employed an expression cloning technique (20). A cDNA library was prepared from CT26, composed of inserts with a size range of 0.4–5 kb cloned nondirectionally into pcDNA3 and organized into pools of 100 clones. The CCD2 T cell clone was used as a probe for expression of the cognate ligand in Dd-expressing COS-7 cells that were transiently transfected with pools of a plasmid cDNA expression library prepared from CT26. Representative data from
FIGURE 1. CD8 T cell adoptive transfer confers cross-protection in vivo. A, CD8 T cells isolated from CT26-immune Treg-depleted BALB/c mice and 106 cells injected into SCID recipients. Following transfer, mice were challenged with 105 CT26 (n = 5), BCL-1 (n = 5), or A20 (n = 5) tumor cells. B, CTL lines were generated from CT26-immune Treg-depleted BALB/c mice by in vitro restimulation with 20 IU/ml rIL-2 and 104 irradiated CT26. CTL lines were assessed for stimulation by CT26, A20, Renca, and P815 by cytotoxicity assay (top panel) and IFN-g production (bottom panel). C, CTL clones were generated from CCD CTL lines by limiting dilution of the CTL lines. One clone, CCD2, was assayed for stimulation by CT26, A20, BCL-1, and Renca, using the WEHI killing assay. Results are the mean 6 SEM. D, MHC blocking Abs against Ld (B22) and Dd (34-5-8S) were used to assess the MHC restriction of the CCD2 response to CT26 in a cytotoxicity assay. Data are representative of two or three independent experiments.
one of twenty 96-well plates show two cDNA pools with above background killing of WEHI cells (Fig. 2A). Indeed, several stimulatory plasmid clones were found after fractionating the mixture into individual colonies (Fig. 2B). One of these plasmids, P20E8A1, was further tested for its ability to stimulate CCD2 in an Ag-specific and MHC-restricted manner. COS-7 cells transfected with P20E8A1 generated the T cell epitope in a dose-dependent manner—only when P20E8A1 cDNA was cotransfected with cDNA encoding the MHC molecule Dd, but not Kd (Fig. 2C, 2D). In addition, the response to P20E8A1 was inhibited by anti-Dd Abs, as seen previously with the CCD2 anti-CT26 response. To facilitate the subsequent identification of the immunostimulatory epitope, we generated a lacZ-inducible hybridoma, CCD2Z, from fusion of the CCD2 T cell and the BWZ.36/CD8+ fusion partner (21), which displayed
The Journal of Immunology
FIGURE 2. Expression cloning and mapping of a cross-protective tumor Ag. A, Primary screen of a CT26 cDNA plasmid library in which the cDNA pools were transiently transfected into recipient COS cells along with Dd MHC class I. The WEHI killing assay was used to assess CCD2 stimulation. Dashed line represents background WEHI killing. B, A secondary screen of individual colonies from the cDNA pool P20E8 transfected into recipient cells was performed as above. The full-length clone, P20E8A1, was selected for further study. Dashed line represents background WEHI killing. C, Recipient COS cells were transfected with 1 mg of the P20E8A1 plasmid DNA or vector alone and cDNA encoding either the Dd or the Kd MHC I molecule. In addition, incubation with an a-Dd blocking Ab was also used. Stimulation of CCD2 was assessed by WEHI killing. D, COS cells were transfected as above and assayed for stimulation of CCD2Z measured by the LacZ response. Data are representative of two or three independent experiments.
exactly the same recognition properties (Supplemental Fig. 1A). In addition, CCD2Z was stimulated by most tumor cell lines, apart from P815, which also did not stimulate CCD2 (Supplemental Fig. 1B). The cross-reactive epitope is encoded by the endogenous ecotropic murine leukemia virus Sequencing of the P20E8A1 cDNA insert revealed 99% sequence identity with the final 600 bp of pol and entire env (gp90) genes of an endogenous ecotropic MuLV, emv-1 (Fig. 3A). The minimal sequence required to confer antigenic activity within P20E8A1 was determined by testing the functional activity of 39 deletion constructs. As determined by the stimulation of CCD2Z, the antigenic peptide was encoded within the gp90 protein, because the C3 truncation encoding the 39 600 bp of pol failed to stimulate (Fig. 3A, 3C). Interestingly, the Ld-restricted AH1 epitope is encoded within the same MuLV gene, gp90 (800 bp downstream of GSW11) in reading frame +1. Further truncations indicated that the epitope was encoded within or overlapped the 51 nucleotides represented by the C7 and C8 constructs (Fig. 3B, 3C). There was no contiguous sequence in any of the three reading frames within this region that
5051
FIGURE 3. Genetic mapping of a cross-protective Ag and its characterization. A, Schematic of the alignment of a P20E8A1 cDNA insert with the endogenous ecotropic MuLV. Nested deletions C2, C3, C7, and C8 of the P20E8A1 cDNA were generated with P20E8A1-specific primers C2, C3, C7, and C8, respectively. Response of CCD2Z to truncated P20E8A1 constructs is indicated. B, The minimal region encoding the cross-protective Ag between the C7- and C8-truncated P20E8A1. The peptide epitope is highlighted in the gray box. C, CCD2Z responses to COS cells transfected with C2, C3, C7, and C8 reveal the minimal region encoding the crossprotective Ag. D, CCD2Z responses to candidate Dd restricted synthetic peptides titrated on P815 cells. The peptide identities are shown below the graph. E, Dd and Ld MHC binding by GSW11 (Dd) or AH1 (SPSYVYHQF; Ld) was measured by RMA-S stabilization assay with Dd or Ld mAb. YF9 (YGPSLYRRF) and QL9 (QLSPFPFDL) served as Dd and Ld binding controls, respectively. Data are representative of three independent experiments.
coded for the optimal H-2Dd binding motif of XGPXXXXX[I,L,F], although one sequence contained the N-terminal XGP motif without a typical hydrophobic C terminus. We therefore synthesized the 13-mer GGPESFYCASWGC (GFC13), as well as sequential C-terminal truncations, down to the 9-mer GGPESFYCA (GSA9), and measured their ability to stimulate CCD2Z when added to P815. All peptides assayed showed a degree of stimulation, but one peptide, GGPESFYCASW (GSW11), stimulated CCD2Z at 5- to 10-fold lower concentrations (∼10 nM) than the other peptides assayed. Thus, GSW11 is likely to represent the naturally processed cross-protective tumor Ag. It is of particular note that GSW11 does not conform to the canonical Dd binding peptide, having tryptophan as the C-terminal anchor residue rather than the more typical isoleucine, leucine, or phenylalanine. To measure binding of GSW11 to MHC class I molecules, Dd-expressing TAP2/2 RMA-S cells were incubated
5052
SUPPRESSION OF TUMOR-SPECIFIC CD8+ T CELLS
with peptide at saturating concentrations overnight at 26˚C. Cells were washed of unbound peptide and incubated at 37˚C. Peptide binding was measured as the rate at which MHC expression was lost at the cell surface: a commonly used surrogate measurement of peptide off-rate. As a further comparison, binding of the previously characterized AH1 Ag was assessed using Ld-expressing RMAS cells. GSW11 was found to have a very rapid half-life for stabilization of Dd (20 min) and was faster than a second known Dd epitope, YGPSLYRRF (YF9) (26), which had a half-life of 50 min (Fig. 3E). AH1 binding to Ld had a slower half-life still of 60 min, yet this was significantly faster than that of the control high-affinity peptide QLSPFPFDL (QL9), derived from P1 mastocytoma cells (25), which had a half-life of .120 min. Surprisingly, when we made C-terminal variants of GSW11 to include either the “classical” anchor variants I or F, neither of these, GSI11 or GSF11, showed improved affinity for Dd (half-life = 20 min; Supplemental Fig. 2). This finding indicated that the unstable nature of the interaction with Dd was not due to the C-terminal tryptophan residue. GSW11 is generated in multiple tumor cell lines We next wanted to confirm that GSW11 was endogenously generated in tumors recognized by the cross-protective CTL response. To achieve this, we generated peptide extracts from live tumor cells, fractionated them by reverse-phase HPLC, and assayed for the presence of GSW11 in the fractionated mixture by its ability to stimulate CCD2Z. Calibration with synthetic peptides indicated that differential identification of GSA9 and GSW11 peptides was possible (Fig. 4A). The profile obtained from CT26 peptide extracts revealed one significant peak that coeluted with synthetic GSW11 (Fig. 4B). A minor peak eluting ahead of GSW11 was shown to be an oxidized adduct (or dimer) that probably formed during the extraction process, because treatment of peptide extracts before and following fractionation with DTT, or treatment of cells with methyl methanethiosulfonate (which binds to free sulfhydryl groups on cysteine side chains and prevents interaction with other sulfhydryl groups) prior to extraction, resulted in loss of this peak and recovery of a single peak corresponding to the synthetic GSW11 (Supplemental Fig. 3). Extraction of peptides using a freeze/thaw method also led to the disappearance of the additional minor peak. We were able to determine the relative quantity of GSW11 generated by different tumor cell lines by comparing the activity of the recovered natural peptide with synthetic GSW11. Thus, we estimated ∼500 pM GSW11 was generated per 106 CT26 cells; 750 pM/106 cells from CT26/GM-CSF (Fig. 4C); and only 10 pM/106 cells from A20 (Fig. 4D). MCFL cells were observed to generate GSW11 at ∼5-fold lower quantity than were CT26 (∼100 pM/106 cells; Fig. 4E). However, we were unable to detect GSW11 peptide in extracts from Renca and P815 tumor cell lines (Supplemental Fig. 4). These results revealed that GSW11 could be detected only in tumor cell lines that strongly stimulate either CCD2 or CCD2Z T cells. It is important to note that the amount of GSW11 generated in the different tumor cell lines did not correlate to the level Dd cell surface expression (data not shown). Anti-GSW11 and anti-AH1 CD8+ T cells are differentially suppressed by Tregs Having identified GSW11 as the source epitope of a cryptic response to CT26, we wanted to determine whether GSW11-specific CD8+ T cells are important in the cross-protective responses observed in the absence of Tregs; to achieve this, we investigated CD8+ responses in BALB/c mice inoculated with CT26 in the presence and absence of Tregs. Spleens and draining lymph nodes were assayed for GSW11- and AH1-specific CD8+ T cells, using in-
FIGURE 4. Endogenous processing of the cross-protective Ag. A, GSA9 and GSW11 peptides were fractionated by HPLC and fractions assessed for the presence of CCD2Z-stimulating activity, using P815 as APCs. The arrows highlight the retention times of GSA9 and GSW11 peptides. “Mock” indicates fractions collected in an identical run with sample buffer alone prior to the peptides. B–E, The naturally processed cross-protective Ag coelutes with GSW11. CT26 (B), CT26/GM-CSF (C), A20 (D), and MCFL (E) peptide extracts were fractionated by HPLC and fractions assayed for CCD2Z activity, as above. Data are representative of three independent experiments.
tracellular cytokine staining after 12 d. This schedule allowed us to measure T cell responses in Treg-replete, tumor-bearing mice— even though the majority of these would eventually succumb to tumor growth. In the presence of Tregs, we were able to detect GSW11-specific T cells in only 4 of 11 mice investigated, with only ∼0.04% of CD8 T cells being GSW11 specific in the four mice that responded. These were not considered genuine anti-GSW11 responses because they failed to expand when stimulated in vitro (Supplemental Fig. 5). By contrast, all mice mounted a strong response to AH1, with 0.2–1% of CD8+ T cells being AH1 specific (Fig. 5A). This AH1-specific response is nevertheless insufficient to reject the tumor. A similar response is seen in mice vaccinated with irradiated CT26/GM-CSF. However, a different response profile was observed in Treg-depleted mice. In this case, all mice contained GSW11-specific CD8+ T cells, with an average of ∼1.5%, representing an ∼300-fold increase in numbers compared with Treg-replete mice. We also observed a 2- to 3-fold elevation of the anti-AH1 response in Treg-depleted mice (Fig. 5A). Overall, GSW11-specific T cells were seen to be codominant with AH1specific T cells (∼1.5% versus ∼1.3%). A similar response pattern was seen in CT26/GM-CSF primed in Treg-depleted mice. Codominance between AH1- and GSW11-specific T cells was also seen at an earlier time point, day 8; however, the responses were much lower (data not shown). Because Treg-depleted mice reject tumor, the correlation of protection could be either the appearance of new specificities (exemplified by GSW11), broadening of the response to allow interclonal synergy, or enhancement of the immunodominant AH1 response. The last option would seem unlikely, given
The Journal of Immunology
5053
FIGURE 6. AH1-specific CD8 T cells are functionally identical when primed in the presence or absence of Tregs. A, At 12 d after CT26 challenge, AH1-specific CD8 T cell responses from Treg-replete (left) or -depleted (right) BALB/c mice were measured with intracellular IFN-g staining. The mean fluorescence intensity of IFN-g–producing AH1-specific CD8 T cells is indicated on the dot plots. B, The comparative mean fluorescence intensity of AH1-specific CD8 T cells from CT26-challenged Treg-depleted or -replete BALB/c mice was assessed. Results are the mean 6 SEM of six mice from two separate experiments. NS, p = 0.22. C, Following in vitro stimulation with AH1 pulsed irradiated BALB/c splenocytes, specific lysis of CT26 cells by AH1-specific CD8 T cells was measured. Data are representative of two independent experiments. FIGURE 5. GSW11-specific CD8 T cells are observed only in Tregdepleted mice. A, Treg-depleted or -replete BALB/c mice were challenged with CT26. After 12 d, CD8 T cell responses to AH1 and GSW11 were measured with intracellular IFN-g staining following in vitro stimulation with either AH1 or GSW11 peptides. B, Anti-AH1 and -GSW11 CD8 T cell responses of individual Treg-depleted mice challenged with CT26 are indicated by joining lines. Each data point is from one mouse, with results pooled from three separate experiments.
the small increase in AH1-specific CD8 T cells observed in Tregdepleted mice, but it is still possible that in the absence of Tregs, T cells (including anti-AH1) develop more potent effector function. To investigate this further, we analyzed AH1-specific CD8 T cells for their level of IFN-g production in response to peptide stimulation and their ability to kill CT26 tumor cells from both Tregdepleted and -replete CT26-challenged mice. The level of IFN-g produced from individual CD8 T cells derived from Treg-depleted or -replete splenocytes was found to be the same following stimulation by AH1 peptide (Fig. 6A, 6B). Owing to the lower quantity of AH1-specific CD8 T cells in Treg-replete mice, we were unable to purify enough to ascertain their ex vivo CTL killing capacity. To address this, we assessed the CTL cytotoxicity of splenocyte cultures from Treg-depleted and -replete CT26-challenged mice stimulated in vitro for 7 d in the presence of AH1. These cultures showed expansion of AH1-specific CD8 T cells (Supplemental Fig. 5) and did not contain any detectable GSW11-specific CD8 T cells (data not shown). The ability of these AH1 CTL lines to kill CT26 target cells was found to be the same (Fig. 6C). These results support the interpretation that the protection observed in the absence of Tregs is due to a broadening of the immune response rather than the acquisition of a more potent effector function. Interestingly, the codominance of AH1 and GSW11 responses seen in these ex vivo experiments was rarely recapitulated in short-term
CT26-stimulated T cell cultures from Treg-depleted CT26immunized mice. In this instance, the AH1 response was not easily detected, with GSW11 and other non–Ld-restricted responses predominating. A clue to why this might be the case came from closer examination of each response in individual mice in which there was a suggestion that high responders for GSW11 tended to be lower responders for AH1 and vice versa (Fig. 5B). This finding suggests a dynamic relationship between competing reactivities as they are established within the responding individual and may represent the process that is targeted by Tregs, resulting in differential suppression of the two responses.
Discussion We have used an expression cloning technique to reveal the molecular identity of what we believe is a novel murine crossprotective tumor Ag. We have previously shown that removal of Tregs through Ab depletion induced a robust protective immunity upon subsequent CT26 tumor challenge. More importantly, the antitumor immunity induced was found to be cross protective to challenge with histologically distinct tumors (12). In this paper, we describe the characterization of one of the tumor Ags responsible for the cross-protective immunity, GGPESFYCASW (GSW11), derived from the gp90 gene of an endogenous ecotropic MuLV, emv-1; this has provided valuable insights into the role of Treg suppression in the generation of a protective antitumor response. The binding of GSW11, which does not conform to the consensus Dd binding motif XGPXXXXX[I,L,F] (28), to Dd was relatively weak compared with other Dd-restricted peptides. The precise structural basis for this is not known because substitution of the C-terminal tryptophan to residues that conform to the canonical Dd binding motif (isoleucine or phenylalanine) did not enhance binding (Supplemental Fig. 2). The extended length of
5054 GSW11 may be a factor, although this is likely to be a minor consideration because there are multiple Dd-restricted peptides that are longer than the typical 9-mers suggested (29–31). A further anchor residue is suggested at position 5 (28); manipulation of this residue may enhance its binding to Dd. CD8+ T cell responses to GSW11 are absent in naive mice following CT26 challenge; GSW11-specific responses are observed only when Tregs are depleted prior to challenge. This finding is in contrast to AH1-specific T cell responses, which are present in naive and Treg-depleted mice. The appearance of GSW11-specific T cells indicates a broadening of the antitumor response in the absence of Tregs. Indeed, in the absence of Tregs, the anti-CT26 response consists of at least an additional two Ags, apparent from CTL clones generated from spleens of Treg-depleted CT26-challenged mice; in addition to anti-GSW11–specific T cells, further Dd- and Kd-restricted CD8+ T cell responses are observed (data not shown). These responses are likely to account for the inability of CCD2 T cells to be stimulated by Renca (Fig. 1C). The antiGSW11 response is, therefore, a surrogate marker for the induction of a broader antitumor response in Treg-depleted mice, which is not solely restricted to anti-AH1 T cells and is ultimately protective. This broadening of the T cell response has also been confirmed from spectrotyping studies (32). Depletion of Tregs in mice has been shown to result in enhancement of T cell responses directed to many pathogen- and tumor-derived epitopes (11–13, 33). These studies showed stronger responses and, in most cases, a better outcome against pathogens or tumors. However, none of these investigations distinguished between a quantitative and a qualitative mechanism for improved immunity. In the majority of these studies, peptide-specific T cell responses were not measured, and in those that did, no new T cell reactivities were observed. In fact, examination of antiviral CD8+ T cell responses directed to influenza A-, vaccinia virus-, or SV40-transformed cells by Haeryfar et al. (33) identified that the greatest Treg suppression was observed to the most immunodominant CD8+ T cells, which in some instances altered the immunodominance of the response. Our study is, therefore, the first to our knowledge to isolate the source epitope of a cryptic CTL response that is uncovered by Treg ablation. AH1-specific CD8+ T cells are immunodominant in naive mice challenged with CT26, with no other CD8+ T cell response detectable (Fig. 4; Ref. 15). CT26-challenged Treg-depleted mice show a codominant phenotype, with anti-GSW11 T cells being equivalent to those directed against AH1. However, upon closer examination, individual mice have a tendency toward clonal immunodomination of either GSW11 (4 of 10) or AH1 (3 of 10), with 3 of 10 mice maintaining the codominant phenotype, suggesting that competition between GSW11- and AH1-specific CD8+ T cells exists in vivo. Nevertheless, all mice elicit a GSW11 response that is at least 50 times higher in the absence of Tregs than in their presence. We do not know the precise mechanism underlying this competition for dominance, but we note that in medium-term cultures of splenocytes from Treg-depleted CT26immune mice, the GSW11 response dominates, even though longterm cultures permit outgrowth of the AH1 response (data not shown). Interestingly, we have found that AH1-specific lines grown from these cultures following peptide stimulation expand more slowly than similarly derived GSW11-specific lines, which may account for the dominance observed in vitro. The presence of codominance between AH1- and GSW11-specific responses is an unexpected finding. In the vast majority of cases, Ags with low MHC binding induce only subdominant T cell responses and are outcompeted by those responses directed against Ags with high MHC binding (34).
SUPPRESSION OF TUMOR-SPECIFIC CD8+ T CELLS Being encoded within gp90, which is ubiquitously expressed in BALB/c tumors, means GSW11 is a shared tumor Ag (data not shown and Ref. 35) and is generated in all tumor cell lines assayed (Fig. 3). However, the generation of a cross-protective response is not reciprocal; challenge with A20 in the absence of Tregs does not lead to cross-protection against CT26 (Supplemental Fig. 6). One explanation is the finding that the amount of GSW11 generated by tumor cell lines differs significantly. CT26 generates .50 times more GSW11 than A20, resulting in lower cell surface expression of GSW11/Dd. This is also reflected in the ability of the tumor cell lines to stimulate CCD2Z, which is independent of costimulatory molecules and thus responds in a way directly linked to the number of GSW11/Dd complexes present (Supplemental Fig. 1B). The lower level of cell surface GSW11/Dd complexes may prevent induction of GSW11-specific T cells and thus failure to induce a cross-protective response. Despite its generation of GSW11, the ability to generate antiGSW11 CD8+ T cells following CT26 challenge is observed only in Treg-depleted mice. AH1-specific T cells are observed in all mice; therefore, differential suppression of GSW11 and AH1 T cell responses is apparent in Treg-replete mice. An explanation for this differential suppression of T cell responses may be linked to the low affinity GSW11 has for binding to Dd. GSW11/Dd complexes are very short lived, as determined by MHC binding and from the observation that we have been unable to generate GSW11/Dd tetramers; the interaction between GSW11 and Dd is not strong enough to promote their formation. As these complexes have a short half-life at the cell surface, GSW11-specific CD8+ T cells might be expected to require a high-affinity interaction between the TCR and GSW11/Dd to reach an activation threshold. Differences in T cell avidity have been shown to correlate with differential ability to secrete cytokines, such as IL-2, and may correlate with their dependence on them (36–38). We have observed this difference in GSW11- and AH1-specific T cell lines. GSW11-specific CTLs are more dependent on IL-2 for their activation and growth in culture than are AH1-specific lines, even though they expand more rapidly (data not shown). Because GSW11-specific T cells are suppressed by Tregs, the IL-2 dependence of these CTLs may provide a mechanism of differential suppression. Tregs have been shown to facilitate suppression of CTL responsiveness through acting as an IL-2 “sink,” thus inhibiting their proliferation (39–41). It is likely, therefore, that in situ Tregs could lower local IL-2 concentrations below a critical threshold required for the activation of some T cell clones, such as GSW11-specific ones, but not others, thereby resulting in differential suppression of T cell responses within “reach” of Tregs. It will be interesting to identify whether the Tregs are tumor specific. The emv-1 retrovirus is not active in the neonatal or juvenile thymus but is reactivated in 80% of mice at 6 mo of age (42). Similarly, human endogenous retroviruses (HERV) are present within the human genome and reactivate late in life and are often expressed ectopically in human tumors (43). It is likely that T cell responses to HERV are controlled in the same way as we have described in this paper, perhaps with the development of suppressive immunity accompanying endogenous expression. Therefore, understanding how to break these immunosuppressive networks may offer a therapeutic avenue for HERV-expressing tumors.
Acknowledgments We thank Nasia Kontouli for invaluable assistance and technical support.
Disclosures The authors have no financial conflicts of interest.
The Journal of Immunology
References 1. Dunn, G. P., L. J. Old, and R. D. Schreiber. 2004. The three Es of cancer immunoediting. Annu. Rev. Immunol. 22: 329–360. 2. Clemente, C. G., M. C. Mihm, Jr., R. Bufalino, S. Zurrida, P. Collini, and N. Cascinelli. 1996. Prognostic value of tumor infiltrating lymphocytes in the vertical growth phase of primary cutaneous melanoma. Cancer 77: 1303–1310. 3. Zhang, L., J. R. Conejo-Garcia, D. Katsaros, P. A. Gimotty, M. Massobrio, G. Regnani, A. Makrigiannakis, H. Gray, K. Schlienger, M. N. Liebman, et al. 2003. Intratumoral T cells, recurrence, and survival in epithelial ovarian cancer. N. Engl. J. Med. 348: 203–213. 4. Page`s, F., A. Berger, M. Camus, F. Sanchez-Cabo, A. Costes, R. Molidor, B. Mlecnik, A. Kirilovsky, M. Nilsson, D. Damotte, et al. 2005. Effector memory T cells, early metastasis, and survival in colorectal cancer. N. Engl. J. Med. 353: 2654–2666. 5. Curiel, T. J., G. Coukos, L. Zou, X. Alvarez, P. Cheng, P. Mottram, M. EvdemonHogan, J. R. Conejo-Garcia, L. Zhang, M. Burow, et al. 2004. Specific recruitment of regulatory T cells in ovarian carcinoma fosters immune privilege and predicts reduced survival. Nat. Med. 10: 942–949. 6. Salama, P., M. Phillips, F. Grieu, M. Morris, N. Zeps, D. Joseph, C. Platell, and B. Iacopetta. 2009. Tumor-infiltrating FOXP3+ T regulatory cells show strong prognostic significance in colorectal cancer. J. Clin. Oncol. 27: 186–192. 7. Petersen, R. P., M. J. Campa, J. Sperlazza, D. Conlon, M. B. Joshi, D. H. Harpole, Jr., and E. F. Patz, Jr. 2006. Tumor infiltrating Foxp3+ regulatory T-cells are associated with recurrence in pathologic stage I NSCLC patients. Cancer 107: 2866–2872. 8. Ghebeh, H., E. Barhoush, A. Tulbah, N. Elkum, T. Al-Tweigeri, and S. Dermime. 2008. FOXP3+ Tregs and B7-H1+/PD-1+ T lymphocytes co-infiltrate the tumor tissues of high-risk breast cancer patients: Implication for immunotherapy. BMC Cancer 8: 57–68. 9. Miracco, C., V. Mourmouras, M. Biagioli, P. Rubegni, S. Mannucci, I. Monciatti E. Cosci, P. Tosi, and P. Luzi. 2007. Utility of tumour-infiltrating CD25+FOXP3+ regulatory T cell evaluation in predicting local recurrence in vertical growth phase cutaneous melanoma. Oncol. Rep. 18: 1115–1122. 10. Bonertz, A., J. Weitz, D. H. Pietsch, N. N. Rahbari, C. Schlude, Y. Ge, S. Juenger, I. Vlodavsky, K. Khazaie, D. Jaeger, et al. 2009. Antigen-specific Tregs control T cell responses against a limited repertoire of tumor antigens in patients with colorectal carcinoma. J. Clin. Invest. 119: 3311–3321. 11. Shimizu, J., S. Yamazaki, and S. Sakaguchi. 1999. Induction of tumor immunity by removing CD25+CD4+ T cells: a common basis between tumor immunity and autoimmunity. J. Immunol. 163: 5211–5218. 12. Golgher, D., E. Jones, F. Powrie, T. Elliott, and A. Gallimore. 2002. Depletion of CD25+ regulatory cells uncovers immune responses to shared murine tumor rejection antigens. Eur. J. Immunol. 32: 3267–3275. 13. Onizuka, S., I. Tawara, J. Shimizu, S. Sakaguchi, T. Fujita, and E. Nakayama. 1999. Tumor rejection by in vivo administration of anti-CD25 (interleukin-2 receptor alpha) monoclonal antibody. Cancer Res. 59: 3128–3133. 14. Sutmuller, R. P., L. M. van Duivenvoorde, A. van Elsas, T. N. Schumacher, M. E. Wildenberg, J. P. Allison, R. E. Toes, R. Offringa, and C. J. Melief. 2001. Synergism of cytotoxic T lymphocyte-associated antigen 4 blockade and depletion of CD25(+) regulatory T cells in antitumor therapy reveals alternative pathways for suppression of autoreactive cytotoxic T lymphocyte responses. J. Exp. Med. 194: 823–832. 15. Huang, A. Y. C., P. H. Gulden, A. S. Woods, M. C. Thomas, C. D. Tong, W. Wang, V. H. Engelhard, G. Pasternack, R. Cotter, D. Hunt, et al. 1996. The immunodominant major histocompatibility complex class I-restricted antigen of a murine colon tumor derives from an endogenous retroviral gene product. Proc. Natl. Acad. Sci. USA 93: 9730–9735. 16. Qin, S., S. Cobbold, H. Tighe, R. Benjamin, and H. Waldmann. 1987. CD4 monoclonal antibody pairs for immunosuppression and tolerance induction. Eur. J. Immunol. 17: 1159–1165. 17. Lowenthal, J. W., P. Corthe´sy, C. Tougne, R. Lees, H. R. MacDonald, and M. Nabholz. 1985. High and low affinity IL 2 receptors: analysis by IL 2 dissociation rate and reactivity with monoclonal anti-receptor antibody PC61. J. Immunol. 135: 3988–3994. 18. Dranoff, G., E. Jaffee, A. Lazenby, P. Golumbek, H. Levitsky, K. Brose, V. Jackson, H. Hamada, D. Pardoll, and R. C. Mulligan. 1993. Vaccination with irradiated tumor cells engineered to secrete murine granulocyte-macrophage colony-stimulating factor stimulates potent, specific, and long-lasting antitumor immunity. Proc. Natl. Acad. Sci. USA 90: 3539–3543. 19. Tutt, A. L., R. R. French, T. M. Illidge, J. Honeychurch, H. M. McBride, C. A. Penfold, D. T. Fearon, R. M. Parkhouse, G. G. Klaus, and M. J. Glennie. 1998. Monoclonal antibody therapy of B cell lymphoma: signaling activity on tumor cells appears more important than recruitment of effectors. J. Immunol. 161: 3176–3185. 20. Mendoza, L. M., P. Paz, A. Zuberi, G. Christianson, D. Roopenian, and N. Shastri. 1997. Minors held by majors: the H13 minor histocompatibility locus defined as a peptide/MHC class I complex. Immunity 7: 461–472.
5055 21. Sanderson, S., and N. Shastri. 1994. LacZ inducible, antigen/MHC-specific T cell hybrids. Int. Immunol. 6: 369–376. 22. Kanaseki, T., and N. Shastri. 2008. Endoplasmic reticulum aminopeptidase associated with antigen processing regulates quality of processed peptides presented by MHC class I molecules. J. Immunol. 181: 6275–6282. 23. Brichard, V., A. Van Pel, T. Wo¨lfel, C. Wo¨lfel, E. De Plaen, B. Lethe´, P. Coulie, and T. Boon. 1993. The tyrosinase gene codes for an antigen recognized by autologous cytolytic T lymphocytes on HLA-A2 melanomas. J. Exp. Med. 178: 489–495. 24. Coulie, P. G., V. Brichard, A. Van Pel, T. Wo¨lfel, J. Schneider, C. Traversari, S. Mattei, E. De Plaen, C. Lurquin, J. P. Szikora, et al. 1994. A new gene coding for a differentiation antigen recognized by autologous cytolytic T lymphocytes on HLA-A2 melanomas. J. Exp. Med. 180: 35–42. 25. Udaka, K., T. J. Tsomides, and H. N. Eisen. 1992. A naturally occurring peptide recognized by alloreactive CD8+ cytotoxic T lymphocytes in association with a class I MHC protein. Cell 69: 989–998. 26. Holtappels, R., D. Thomas, J. Podlech, G. Geginat, H. P. Steffens, and M. J. Reddehase. 2000. The putative natural killer decoy early gene m04 (gp34) of murine cytomegalovirus encodes an antigenic peptide recognized by protective antiviral CD8 T cells. J. Virol. 74: 1871–1884. 27. Hammer, G. E., F. Gonzalez, M. Champsaur, D. Cado, and N. Shastri. 2006. The aminopeptidase ERAAP shapes the peptide repertoire displayed by major histocompatibility complex class I molecules. Nat. Immunol. 7: 103–112. 28. Rammensee, H., J. Bachmann, N. P. Emmerich, O. A. Bachor, and S. Stevanovic´. 1999. SYFPEITHI: database for MHC ligands and peptide motifs. Immunogenetics 50: 213–219. 29. Acosta-Rivero, N., S. Duen˜as-Carrera, L. Alvarez-Lajonchere, and J. MoralesGrillo. 2004. HCV core protein-expressing DNA vaccine induces a strong class I-binding peptide DTH response in mice. Biochem. Biophys. Res. Commun. 314: 781–786. 30. Lo´pez, D., Y. Samino, U. H. Koszinowski, and M. Del Val. 2001. HIV envelope protein inhibits MHC class I presentation of a cytomegalovirus protective epitope. J. Immunol. 167: 4238–4244. 31. Simeckova-Rosenberg, J., Z. Yun, P. R. Wyde, and M. Z. Atassi. 1995. Protection of mice against lethal viral infection by synthetic peptides corresponding to B- and T-cell recognition sites of influenza A hemagglutinin. Vaccine 13: 927–932. 32. Malcolm, T. 2007. Regulatory T cell control of anti-tumour responses. Masters Thesis, University of Southampton 33. Haeryfar, S. M., R. J. DiPaolo, D. C. Tscharke, J. R. Bennink, and J. W. Yewdell. 2005. Regulatory T cells suppress CD8+ T cell responses induced by direct priming and cross-priming and moderate immunodominance disparities. J. Immunol. 174: 3344–3351. 34. Yewdell, J. W., and J. R. Bennink. 1999. Immunodominance in major histocompatibility complex class I-restricted T lymphocyte responses. Annu. Rev. Immunol. 17: 51–88. 35. Casares, N., L. Arribillaga, P. Sarobe, J. Dotor, A. Lopez-Diaz de Cerio, I. Melero, J. Prieto, F. Borra´s-Cuesta, and J. J. Lasarte. 2003. CD4+/CD25+ regulatory cells inhibit activation of tumor-primed CD4+ T cells with IFNgamma-dependent antiangiogenic activity, as well as long-lasting tumor immunity elicited by peptide vaccination. J. Immunol. 171: 5931–5939. 36. Heath, W. R., L. Kjer-Nielsen, and M. W. Hoffmann. 1993. Avidity for antigen can influence the helper dependence of CD8+ T lymphocytes. J. Immunol. 151: 5993–6001. 37. Hofmann, M., M. Radsak, G. Rechtsteiner, K. Wiemann, M. Gu¨nder, U. BienGra¨ter, R. Offringa, R. E. Toes, H. G. Rammensee, and H. Schild. 2004. T cell avidity determines the level of CTL activation. Eur. J. Immunol. 34: 1798–1806. 38. Janas, M. L., P. Groves, N. Kienzle, and A. Kelso. 2005. IL-2 regulates perforin and granzyme gene expression in CD8+ T cells independently of its effects on survival and proliferation. J. Immunol. 175: 8003–8010. 39. Barthlott, T., H. Moncrieffe, M. Veldhoen, C. J. Atkins, J. Christensen, A. O’Garra, and B. Stockinger. 2005. CD25+ CD4+ T cells compete with naive CD4+ T cells for IL-2 and exploit it for the induction of IL-10 production. Int. Immunol. 17: 279–288. 40. de la Rosa, M., S. Rutz, H. Dorninger, and A. Scheffold. 2004. Interleukin-2 is essential for CD4+CD25+ regulatory T cell function. Eur. J. Immunol. 34: 2480– 2488. 41. Scheffold, A., J. Hu¨hn, and T. Ho¨fer. 2005. Regulation of CD4+CD25+ regulatory T cell activity: it takes (IL-)two to tango. Eur. J. Immunol. 35: 1336–1341. 42. DeLeo, A. B., H. Shiku, T. Takahashi, M. John, and L. J. Old. 1977. Cell surface antigens of chemically induced sarcomas of the mouse. I. Murine leukemia virus-related antigens and alloantigens on cultured fibroblasts and sarcoma cells: description of a unique antigen on BALB/c Meth A sarcoma. J. Exp. Med. 146: 720–734. 43. Schiavetti, F., J. Thonnard, D. Colau, T. Boon, and P. G. Coulie. 2002. A human endogenous retroviral sequence encoding an antigen recognized on melanoma by cytolytic T lymphocytes. Cancer Res. 62: 5510–5516.