International Journal of
Molecular Sciences Article
T-DNA Tagging-Based Gain-of-Function of OsHKT1;4 Reinforces Na Exclusion from Leaves and Stems but Triggers Na Toxicity in Roots of Rice Under Salt Stress Yuuka Oda 1 , Natsuko I. Kobayashi 2 , Keitaro Tanoi 2,3 ID , Jian Feng Ma 4 , Yukiko Itou 1 , Maki Katsuhara 4 , Takashi Itou 1 and Tomoaki Horie 1, * 1
2 3 4
*
Division of Applied Biology, Faculty of Textile Science and Technology, Shinshu University, 3-15-1, Tokida, Ueda, Nagano 386-8567, Japan;
[email protected] (Y.O.);
[email protected] (Y.I.);
[email protected] (T.I.) Graduate School of Agricultural and Life Sciences, The University of Tokyo, 1-1-1, Yayoi, Bunkyo-ku, Tokyo 113-8657, Japan;
[email protected] (N.I.K.);
[email protected] (K.T.) PRESTO, Japan Science and Technology Agency (JST), 4-1-8 Honcho, Kawaguchi, Saitama 332-0012, Japan Institute of Plant Science and Resources, Okayama University, Chuo 2-20-1, Kurashiki 710-0046, Japan;
[email protected] (J.F.M.);
[email protected] (M.K.) Correspondence:
[email protected]; Tel.: +81-268-21-5561
Received: 28 December 2017; Accepted: 10 January 2018; Published: 12 January 2018
Abstract: The high affinity K+ transporter 1;4 (HKT1;4) in rice (Oryza sativa), which shows Na+ selective transport with little K+ transport activity, has been suggested to be involved in reducing Na in leaves and stems under salt stress. However, detailed physiological roles of OsHKT1;4 remain unknown. Here, we have characterized a transfer DNA (T-DNA) insertion mutant line of rice, which overexpresses OsHKT1;4, owing to enhancer elements in the T-DNA, to gain an insight into the impact of OsHKT1;4 on salt tolerance of rice. The homozygous mutant (the O/E line) accumulated significantly lower concentrations of Na in young leaves, stems, and seeds than the sibling WT line under salt stress. Interestingly, however, the mutation rendered the O/E plants more salt sensitive than WT plants. Together with the evaluation of biomass of rice lines, rhizosphere acidification assays using a pH indicator bromocresol purple and 22 NaCl tracer experiments have led to an assumption that roots of O/E plants suffered heavier damages from Na which excessively accumulated in the root due to increased activity of Na+ uptake and Na+ exclusion in the vasculature. Implications toward the application of the HKT1-mediated Na+ exclusion system to the breeding of salt tolerant crop cultivars will be discussed. Keywords: salt stress; high affinity K+ transporter (HKT); rice; Na+ exclusion
1. Introduction Soil salinization represents the excessive accumulation of water-soluble salts in the rhizosphere, and when the electrical conductivity of its saturation extract (ECe) is more than 4 dS m−1 , the soil is considered as saline that can cause salt stress to glycophytic plants [1]. Soil salinity significantly reduces crop yield due to the imposition of salt stress. High salt environments reduce water uptake by roots because of a reduction in the water potential and disturb ion homeostasis for essential inorganic nutrients, such as K+ [2,3]. Furthermore, salt stress induces the overaccumulation of toxic elements, such as Na and Cl in shoots, which in turn, triggers toxicity that disrupts key metabolic processes [4,5]. To reduce the impact of salt stress on crop production, breeding crop cultivars that show higher salt tolerance is of great importance in addition to the attempts in developing agronomic and engineering solutions [6].
Int. J. Mol. Sci. 2018, 19, 235; doi:10.3390/ijms19010235
www.mdpi.com/journal/ijms
Int. J. Mol. Sci. 2018, 19, 235
2 of 14
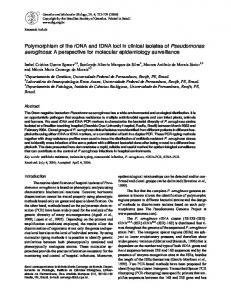
A Na+ selective plasma membrane transporter AtHKT1;1 has been demonstrated to be indispensable for being resistant to salt stress in Arabidopsis [7–9]. Subsequently, a major physiological role of AtHKT1;1 was found to limit the Na+ loading into the xylem for preventing Na overaccumulation in leaves [10–12]. A salt tolerance quantitative trait locus (QTL), which governs the trait of lower Na and higher K concentrations of rice shoots under salt stress in an analogous manner to the AtHKT1;1-dependent mechanism, was revealed to be constituted of the OsHKT1;5 gene encoding a class I Na+ selective transporter [13]. Detailed physiological roles of OsHKT1;5 have recently been elucidated that the plasma membrane-localized Na+ transporter achieves lowering Na concentrations in leaf blades by mediating Na+ absorption into parenchyma cells at the root xylem and the phloem of basal nodes under salt stress [14]. Salt tolerance QTL analyses using wheat cultivars have also led to the findings that superior xylem Na+ unloading systems controlled by Nax1 and Nax2 QTL can prevent from over-accumulating Na in leaf blades of near isogenic lines of wheat cultivars suffering salt stress [15]. In the case of wheat, however, TmHKT1;4-A2 was strongly suggested to be the causal gene for the Nax1 QTL in addition to TmHKT1;5-A, being the causal gene for the Nax2 QTL [16,17]. Recent reports with genetic and bioinformatic approaches further revealed that OsHKT1;1, a class I Na+ selective transporter in rice [18], also contributes to Na+ exclusion from leaves of salt-stressed rice plants [19–21], for which detailed mechanisms are yet to be elucidated. These past findings suggest that HKT1-mediated Na exclusion from leaves appears to be mediated by multiple HKT1 transporters in at least monocot plants. As for the OsHKT1;4 gene in rice, it has been suggested that the gene product contributes to Na exclusion from leaf blades at leaf sheaths more efficiently in salt tolerant landraces than in a japonica rice cultivar [22]. More recently, OsHKT1;4 that exhibits a Na+ selective transport property in heterologous cells was found to play a significant role in excluding Na from stems and flag leaves of a japonica rice cultivar with the xylem Na+ unloading activity at least in a stem tissue, although the contribution of the transporter in the leaf blade Na exclusion during the vegetative growth stage seems to be minor [23]. The whole picture of the physiological role of OsHKT1;4 in the mechanism of salt tolerance of rice plants over the growth stages and rice varieties remains elusive. In this study, we have characterized a unique mutant line of rice, which overexpresses OsHKT1;4 because of T-DNA activation tagging. Interestingly, the mutant line exhibited higher sensitivity to salt stress than its sibling WT plants, regardless of a higher capacity of the mutant for Na exclusion from leaves, stems, and seeds. Our studies provide possible mechanisms for the distribution of Na+ and K+ in rice tissues, influenced by OsHKT1;4 overexpression. Presented results also provide hints for increasing salt stress tolerance of crops by the reinforcement of Na exclusion from leaves. 2. Results 2.1. Isolation of a T-DNA Insertion Mutant of Rice Overexpressing OsHKT1;4 We have searched the RiceGE database for potential OsHKT1;4 mutants. We were interested in a line designated PFG_3A-05753.L as the T-DNA inserted upstream of the first ATG codon of OsHKT1;4 harbors enhancer elements composed of tandem repeats of the 35S promoter core sequence [24] (Figure 1a). Homozygous insertion lines (O/E) and their sibling wildtype lines (WT) were isolated from the same parent line and the level of OsHKT1;4 expression was investigated by the quantitative polymerase chain reaction (PCR) analysis (qPCR). The results indicated that O/E plants accumulated more than 100-folds of OsHKT1;4 transcripts in the 6th leaf blades and roots compared with sibling WT plants even in the absence of salt stress (Figure 1b). Treatments of 50 mM NaCl on sibling WT plants triggered a trend of reduction in the accumulation of OsHKT1;4 transcripts in the 6th leaf sheaths and roots (Figure 1b). In contrast, NaCl treatments on O/E plants significantly increased the level of OsHKT1;4 transcripts in young leaf sheaths maintaining its level in young leaf blades and roots as high as those in the control condition (Figure 1b).
Int. J. Mol. Sci. 2018, 19, 235 Int. J. Mol. Sci. 2018, 19, 235
3 of 14 3 of 14
Figure1.1.Isolation Isolation a T-DNA insertion mutant ricethat lineoverexpresses that overexpresses the OsHKT1;4 gene, Figure of of a T-DNA insertion mutant rice line the OsHKT1;4 gene, driven driven by enhancer in the T-DNA. (a) A schematic of the T-DNA allele by enhancer elementselements in the T-DNA. (a) A schematic diagramdiagram of the T-DNA mutant mutant allele used in used this in thisPFG_3A-05753.L. study, PFG_3A-05753.L. A grey boxOsHKT1;4 in the OsHKT1;4 gene represents the promoter and study, A grey box in the gene represents the promoter region, region, and exons and introns indicated as black as andblack white boxes, respectively. An arrowAn represents the insertion exons and are introns are indicated and white boxes, respectively. arrow represents the site of the site T-DNA. boxes with the word E inword the T-DNA the enhancer element element region, insertion of theGray T-DNA. Gray boxes with the E in therepresent T-DNA represent the enhancer which consisted of four tandem repeatsrepeats of the core sequence of the of 35S NoteNote that the region,iswhich is consisted of four tandem of the core sequence thepromoter. 35S promoter. that T-DNA insertion site site is located at approximately 3 kb upstream from the T-DNA insertion is located at approximately 3 kb upstream fromthe thefirst firstATG ATGofofOsHKT1;4; OsHKT1;4; (b) (b)results resultsofofqPCR qPCRon onthe theexpression expressionofofOsHKT1;4 OsHKT1;4ininthe the6th 6thleaves leavesand androots rootsofofthe thehomozygous homozygous insertion insertionline line(O/E) (O/E) and and its its sibling sibling WT WT (WT). (WT). Approximately Approximately 3-week-old 3-week-old plants plants were wereprepared preparedby by hydroponic culture and 50 mM NaCl was imposed for 3 days prior to the experiment. The transcript hydroponic culture and 50 mM NaCl was imposed for 3 days prior to the experiment. The transcript level analyzed. Relative Relativeexpression expressionofofOsHKT1;4 OsHKT1;4is levelof ofOsHKT1;4 OsHKT1;4 and and an an internal internal control control OsSMT3 OsSMT3 was analyzed. isshown shownwith withaalogarithmic logarithmicscale scalesetting settingits its expression expression in in the the 6th leaf sheath sheath of of WT WT from fromthe thecontrol control condition SD). LB6, conditionto to11(n(n==4,4,±±SD). LB6, LS6 LS6 and and R R represent, represent, respectively, respectively, 6th 6thleaf leafblades, blades,6th 6thleaf leafsheaths, sheaths, and androots. roots.Different Differentalphabets alphabetsrepresent representsignificant significantdifferences differencesatatthe thelevel levelofof5% 5%(Tukey’s (Tukey’stest). test).
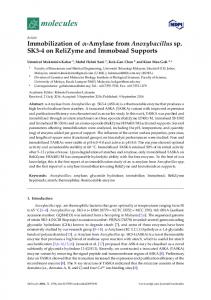
2.2.OsHKT1;4 OsHKT1;4Overexpression OverexpressionChanges Changesthe thePatterns PatternsofofNa Naand andKKAccumulations AccumulationsininTissues TissuesofofRice Rice 2.2. Concentrations of Na of approximately 3-week-old O/E O/E and sibling WT plants, Concentrations Na and andKKinintissues tissues of approximately 3-week-old and sibling WT grown grown by hydroponic culture,culture, were investigated. Treatments of 50 mM forNaCl 24 h led plants, by hydroponic were investigated. Treatments of NaCl 50 mM for to 24 higher h led concentrations of Na in of sheaths of 2nd, of 3rd, and3rd, 4thand leaves of O/Eof plants than those WTof plants to higher concentrations Na in sheaths 2nd, 4th leaves O/E plants than of those WT (Figure 2a). However, blades of those leaves of ofO/E lower Na Na plants (Figure 2a). However, blades of those leaves O/Eplants plantsshowed showed significantly significantly lower concentrationsthan than (Figure 2a). Moreover, at leaves younger leaves (5th to 8th), Na concentrations WTWT (Figure 2a). Moreover, looking looking at younger (5th to 8th), Na concentrations concentrations were significantly reducedand in both sheaths blades of plants the leaves of O/E plants in were significantly reduced in both sheaths blades of the and leaves of O/E in comparison with comparison with 2a). WT In plants 2a).stems, In roots and basalshowed stems, significant O/E plantsincreases showed significant WT plants (Figure roots(Figure and basal O/E plants in the Na increases in the Na concentration (Figure 2a). concentration (Figure 2a). Asfor forKKconcentrations, concentrations,relatively relativelyold oldleaves leaves(1st (1sttoto4th), 4th),roots, roots,and andbasal basalstems stemsofofO/E O/Eplants plants As showedroughly roughlyan anopposite oppositetrend trendtotoNa Naconcentrations concentrationsofofthe thesame sametissues: tissues:that thatis, is,KKconcentrations concentrations showed weresignificantly significantlyincreased increasedininold oldblades, blades,but butdecreased decreasedininold oldsheaths, sheaths,roots, roots,and andbasal basalstems stemsofofO/E O/E were plantsininresponse responsetoto50 50mM mMNaCl NaCl(Figure (Figure2b). 2b).InInyounger youngerleaves leaves(5th (5thtoto8th), 8th),KKconcentrations concentrationsofofO/E O/E plants plantsshowed showedananincreasing increasing trend remained unchanged when compared plants (Figure plants trend or or remained unchanged when compared withwith WT WT plants (Figure 2b). 22 2b). To further dissect the allocation of Na in O/E and WT plants, tracer experiments using NaCl further dissect the allocation of Na in O/E WT plants, tracerwere experiments using1022NaCl were To performed. Two-week-old plants, grown by and hydroponic culture, treated with mM 22 Na were for performed. Two-week-old grown by hydroponic treated with 10 mM after NaCl NaCl three days prior to theplants, experiment. radiation culture, images were of rice plants, obtained 22 NaCl 22 Naplants, + transfer 22Na that three daysofprior to from the experiment. radiation images of rice obtained after 1 h 1for h absorption roots, indicated O/E plants block to leaves more 22 22Naof + transfer absorption of 22NaCl roots, indicated that nodes O/E plants block to leaves more efficiently holding morefrom Na in the vicinity of basal or at the bottom sheaths than the sibling 22Na efficiently holding in the vicinity of basal nodes or atmutant the bottom of sheaths the sibling WT and Dongjin thatmore is the background cultivar for this T-DNA line (Figure 3a).than Blade/sheath 22 WT Dongjin the5th background cultivar for this line (Figure 3a). Blade/sheath Na and ratios of 3rd,that 4th is and leaves showed a trend of T-DNA lower 22mutant Na allocation in leaf blades of O/E + transfer 22Na ratios of 3rd, that 4th and leaves showed a trendcapacity of lower in 22 leaf of O/E plants, supporting O/E5th plants exhibit superior for22Na the allocation blockage of Nablades to 22 + 22 + plants,(Figure supporting plants exhibit superior for the of Na transfer leaves leaves 3b). that NaO/E tracer analyses also led to capacity the detection ofblockage significantly higher Na to uptake + uptake rates (Figure 3b). 22Na tracer analyses also in led the detection of significantly rates (approximately a 2-fold increase) thetoroots of O/E plants than others higher (FigureNa 3c). (approximately a 2-fold increase) in the roots of O/E plants than others (Figure 3c).
Int. J. Mol. Sci. 2018, 19, 235 Int. J. Mol. Sci. 2018, 19, 235 Int. J. Mol. Sci. 2018, 19, 235
4 of 14
4 of 14 4 of 14
Figure 2. Measurements of Na and K concentrations using O/E and wildtype lines (WT) plants, which Figure 2. Measurements of Na K concentrations using O/E wildtype lines (WT) plants, which Figure 2. Measurements of Na andand K concentrations using O/E andand wildtype lines (WT) plants, which were were subjected to salt stress. Plants were prepared by hydroponic culture, and 3 to 4-week-old plants were subjected to salt stress. Plants were prepared by hydroponic culture, and 3 to 4-week-old plants subjected to salt stress. Plants were prepared by hydroponic culture, and 3 to 4-week-old plants were treated were treated with 50 mM NaCl for 24 h. (a) Na concentrations in leaves, basal stems and roots; (b) K were treated with 50 mM NaCl for 24 h. (a) Nain concentrations in leaves, basal and roots; (b) K with 50 mM NaCl forthe 24same h. (a) Na concentrations leaves, basal stems and roots;stems (b) Kleaf concentrations concentrations in tissues as in (a). LB, LS, BS and R represent, respectively, blades, leaf in concentrations in same tissues as in (a). LB, LS,respectively, BS and R represent, respectively, leaf blades, leaf thesheaths, same tissues inthe (a).and LB,roots. LS, BSLarger and R numbers represent, blades, leaf sheaths, basal stems and basalasstems on LB and LSleaf represent younger leaves. Asterisks sheaths, basal stems and roots. Larger numbers on LB and LS represent younger leaves. Asterisks roots. Larger numbersdifferences on LB and between LS represent Asterisks indicate indicate significant O/E younger and WT leaves. plants (Student’s t-test: * psignificant < 0.05, ** differences p < 0.01; indicate significant differences between O/E and WT plants (Student’s t-test: * p < 0.05, ** p < 0.01; between O/E and WT plants (Student’s t-test: * p < 0.05, ** p < 0.01; n = 4, ± SD). n = 4, ±SD). n = 4, ±SD).
22Na tracer experiments using O/E and WT plants. (a) Allocation of 22Na in the shoot of rice Figure 3. Na Figure 3. 22 tracer experiments (a) Allocation Allocationof of2222 Naininthe theshoot shoot rice Figure 3. 22Na tracer experimentsusing usingO/E O/E and and WT WT plants. (a) Na ofof rice plants. The autoradiograph (the upper image) and the picture of the sample were plants. The autoradiograph of the the sample sample(the (thelower lowerimage) image) were plants. The autoradiograph(the (theupper upperimage) image)and and the the picture picture of (the lower image) were presented. All of the seedlings were composed of sheaths of the 1st leaf (L1), L2, and L3, L3 blade, L4 presented. AllAll ofofthe composedofofsheaths sheathsofof (L1), L3,blade, L3 blade, presented. theseedlings seedlings were were composed thethe 1st1st leafleaf (L1), L2, L2, and and L3, L3 L4 sheath, L4 blade, L5 sheath, L5 blade, L6, and the basal part of the shoot; (b) Na distribution ratios L4 sheath, L4 blade, blade, L5 L5 sheath, sheath,L5 L5blade, blade,L6, L6,and andthe thebasal basalpart partofofthe theshoot; shoot;(b) (b)Na Nadistribution distributionratios ratios sheath, L4 between the blade and the sheath of 3rd, 4th, and 5th leaves; (c) Sodium uptake rate (nmol/mg root/h) between blade and sheath 3rd,4th, 4th,and and5th 5thleaves; leaves;(c) (c) Sodium Sodium uptake rate between thethe blade and thethe sheath ofof3rd, rate (nmol/mg (nmol/mgroot/h) root/h) in the nutrient solution containing 10 mM NaCl. The means with standard deviations were presented in the nutrient solution containing 10 mM NaCl. The means with standard deviations were presented in the nutrient solution containing 10 mM NaCl. The means with standard deviations were presented (n = 3 for Dongjin and n = 4 for the O/E and the sibling WT). Different alphabets in (b) and (c) represent 3 for Dongjin and n =4 4for forthe theO/E O/E and and the sibling represent (n =(n3=for Dongjin and n= sibling WT). WT).Different Differentalphabets alphabetsinin(b) (b)and and(c)(c) represent significant differences at the level of 5% (Tukey-Kramer method). significant differences level 5%(Tukey-Kramer (Tukey-Kramermethod). method). significant differences at at thethe level ofof5%
2.3. OsHKT1;4 O/E Rice Shows Increased Sensitivity to Salt Stress Given that O/E plants exhibit more efficient Na exclusion from leaves under salt stress, which is known to be one of the positive factors for salt resistance, we compared the salt sensitivity of O/E plants with WT plants. Interestingly, salt stress obviously caused a heavier damage to O/E plants in visual than WT although both plants grew similarly without the stress (Figure 4a,b). Subsequent comparisons
2.3. OsHKT1;4 O/E Rice Shows Increased Sensitivity to Salt Stress Given that O/E plants exhibit more efficient Na exclusion from leaves under salt stress, which is known to be one of the positive factors for salt resistance, we compared the salt sensitivity of O/E plants with WT plants. Interestingly, salt stress obviously caused a heavier damage to O/E plants in Int. J. Mol. Sci. 2018, 19, 235 5 of 14 visual than WT although both plants grew similarly without the stress (Figure 4a,b). Subsequent comparisons of the fresh weight of younger expanded-leaves and roots between O/E and WT plants of thethat freshNaCl weight of youngergenerally expanded-leaves and roots betweenof O/E plants revealed revealed treatments suppressed the growth all and the WT tissues tested, and, in that NaCl treatments generally suppressed the growth of all the tissues tested, and, in particular, particular, tissues from O/E plants suffered severer growth defects than WT (Figure 4c,d). Blades and tissues from O/E suffered severer in growth defects than WT (Figure 4c,d). Blades and sheaths sheaths of leaves of plants O/E plants resulted showing approximately 21–54% reductions in theoffresh leaves of O/E plants resulted in showing approximately 21–54% reductions in the fresh weight when weight when compared with WT tissues under salt stress (Figure 4d). However, the severest damage compared with WT tissues under salt stress (Figure 4d). However, the severest damage was found in was found in roots of salt-stressed O/E plants with approximately a 62% reduction when compared roots of salt-stressed O/E plants with approximately a 62% reduction when compared to the roots of to the roots of salt-stressed WT plants (Figure 4b,d) in contrast to the fact that roots of both lines did salt-stressed WT plants (Figure 4b,d) in contrast to the fact that roots of both lines did not show any not show any under difference undercondition the control condition (Figure 4b,c). Note that 8–30% reductions in the difference the control (Figure 4b,c). Note that 8–30% reductions in the fresh weight of freshleaves weight of leaves were also found in O/E plants when compared with WT tissues under were also found in O/E plants when compared with WT tissues under the control condition, the control condition, for which reason is not yet any clear, even though could any visual could not for which the reason is not the yet clear, even though visual symptom not be symptom observed during be observed during hydroponic culture without hydroponic culture without NaCl (Figure 4a–c). NaCl (Figure 4a–c).
Figure 4. Increased saltsensitivity sensitivity of (a)(a) Pictures of O/E WT plants, were Figure 4. Increased salt ofthe theO/E O/Eline. line. Pictures of and O/Esibling and sibling WTwhich plants, which prepared by hydroponic culture for approximately 2 weeks, and then treated with or without salt stress were prepared by hydroponic culture for approximately 2 weeks, and then treated with or without (a stepwise 25 mM increase in the NaCl concentration from 25 to 75 mM) for 9 days; (b) a representative salt stress (a stepwise 25 mM increase in the NaCl concentration from 25 to 75 mM) for 9 days; (b) a plant from each condition mentioned in (a). Note that the white bars in (a) and (b) represent 10 cm; representative plant from each condition mentioned in (a). Note that the white bars in (a) and (b) (c) fresh weights of leaf tissues and roots of O/E and WT plants, grown without salt stress (n = 6, ±SD); represent 10 cm; (c) fresh weights of leaf tissues and roots of O/E and WT plants, grown without salt (d) fresh weights of leaf tissues and roots of O/E and WT plants, treated with salt stress (n = 6, ±SD). stressLB, (nLS, = 6,and ±SD); (d) freshrespectively, weights of leaf leafblades, tissuesleaf andsheaths, roots of O/E andLarger WT plants, treated R represent, and roots. numbers on LBwith and salt stressLS(nrepresent = 6, ±SD). LB, LS, and R represent, respectively, blades, between leaf sheaths, andWT roots. Larger younger leaves. Asterisks indicate significantleaf differences O/E and plants numbers on LB and* LS leaves. Asterisks indicate significant differences between (Student’s t-test; p < represent 0.05, ** p < younger 0.01). O/E and WT plants (Student’s t-test; * p < 0.05, ** p < 0.01).
J. Mol. 2018, Int.Int. J. Mol. Sci.Sci. 2018, 19,19, 235235
6 of 1414 6 of
To evaluate the biological activity of rice roots, we attempted to monitor the activity of plasma To evaluate the biological activity of rice roots, we attempted to monitor the activity of plasma membrane H++-ATPases using bromocresol purple, a pH indicator. Approximately 10-day-old membrane H -ATPases using bromocresol purple, a pH indicator. Approximately 10-day-old seedlings seedlings of O/E and sibling WT plants, as prepared by hydroponic culture, were treated with or of O/E and sibling WT plants, as prepared by hydroponic culture, were treated with or without 50 mM without 50 mM NaCl for a week. Each plant was transferred to an agar plate including 0.006% NaCl for a week. Each plant was transferred to an agar plate including 0.006% bromocresol purple. bromocresol purple. As shown in Figure 5a,b, the color of the agar surrounding the roots of O/E and As shown in Figure 5a,b, the color of the agar surrounding the roots of O/E and WT plants turned +-pumping, WT plants turned into due towhich the acidification, which is an indication of active into yellow due to theyellow acidification, is an indication of active H+ -pumping, and noHnoticeable and no noticeable difference was found and WT roots. However, when 50 mM were NaCldifference was found between O/E and between WT roots.O/E However, when 50 mM NaCl-treated plants treated plantsthe were transferred, the degree was of the color-change was in roots both lines transferred, degree of the color-change decreased in roots of decreased both lines with moreofprofound with more profound decreases in the case of O/E plants (Figure 5c,d). decreases in the case of O/E plants (Figure 5c,d).
+ -pump ATPases of the plasma membrane Figure O/E plants show a decrease the activityofofHH +-pump Figure 5. 5. O/E plants show a decrease inin the activity ATPases of the plasma membrane in in response to salt stress. 10-day-old seedlings were treatedwith withor orwithout without 50 50 mM response to salt stress. 10-day-old seedlings were treated mM NaCl NaClfor for7days. 7days. Then plants were transferred onto the 0.75% agar medium supplemented with 1 mM CaSO , 2.5 4 mM Then plants were transferred onto the 0.75% agar medium supplemented with 1 mM CaSO4, 2.5mM K2 SO4 , and 0.006% bromocresol purple gently imbedding the roots on the surface of the medium. 4, and 0.006% bromocresol purple gently imbedding the roots on the surface of the medium. All K2SO All agar plates were placed in a growth chamber under light for 6 h. Note that yellowing of the test agar plates were placed in a growth chamber under light for 6 h. Note that yellowing of the test plate plate represents acidification. Pictures were taken afterwards. 4–5 plants were used per condition represents acidification. Pictures were taken afterwards. 4–5 plants were used per condition and and representative results were shown: (a) sibling WT plants without stress; (b) O/E plants without representative results were shown: (a) sibling WT plants without stress; (b) O/E plants without stress; stress; (c) sibling WT plants with salt stress; and, (d) O/E plants with salt stress. Note that a white bar (c) sibling WT plants with salt stress; and, (d) O/E plants with salt stress. Note that a white bar represents 1.5 cm. represents 1.5 cm.
2.4. Influences of OsHKT1;4 Overexpression on Phenotypes of Rice Lines That Are in the Reproductive Growth 2.4. Influences of OsHKT1;4 Overexpression on Phenotypes of Rice Lines That Are in the Reproductive Stage Under Salt Stress Growth Stage Under Salt Stress We have further characterized O/E plants that are in the reproductive growth stage under salt + transport We haveOsHKT1;4-mediated further characterized plants has thatbeen are in the reproductive growth stageonunder salt stress since NaO/E proposed to have a larger impact the salt + stress since mechanism OsHKT1;4-mediated Na transport has beengrowth proposed to[23]. haveWe a larger on the salt tolerance of rice during the reproductive stage have impact at first analyzed tolerance rice during thegrowth reproductive stage [23]. have at first analyzed whether mechanism O/E plants inofthe reproductive stage alsogrowth show the feature of We OsHKT1;4 overexpression whether O/E plants growth stage alsopot show the feature three of OsHKT1;4 under salt stress. Both in O/Ethe andreproductive WT plants were grown in the same for approximately months, overexpression under salt stress. Both O/E WTincrease plants inwere grown in the same for and salt stress was imposed with a manner of a and gradual the NaCl concentration frompot 25 to 100 mM right three after the initiation heading than awith month. qPCR of using tissues increase of stems in and approximately months, andof salt stress for wasmore imposed a manner a gradual the flag concentration leaves revealedfrom substantial increases in the levelthe of initiation OsHKT1;4of transcripts from NaCl 25 to 100 mM right after heading in fortissues more derived than a month. O/Eusing plantstissues (Figureof6).stems We then and K concentrations in the tissues stems and flag qPCR and measured flag leavesNa revealed substantial increases in the of level of OsHKT1;4 leaves of both lines, derived which were treated with salt stress6). as We in the qPCR analysis.Na Except the node III, transcripts in tissues from O/E plants (Figure then measured and Kfor concentrations significant decreases in the concentration of Na were found in tissues of O/E plants in comparison in the tissues of stems and flag leaves of both lines, which were treated with salt stress as in the qPCR with WT (Figure As for K concentration, internode of II, Na andwere internode were analysis. Except for 7a). the node III,the significant decreasespeduncles, in the concentration found III in tissues found to show significant decreases (Figure 7b). The effect of salt stress on the rate of ripened paddies of O/E plants in comparison with WT (Figure 7a). As for the K concentration, peduncles, internode qualities was further imposing decreases salt stress followed by aThe tapeffect waterofirrigation foron II,and andtheir internode III were found evaluated to show significant (Figure 7b). salt stress after the stress O/E plants turnedevaluated out to show a significantly lower ripeningby theanother rate ofmonth ripened paddies andtreatment. their qualities was further imposing salt stress followed rate than WT in response to salt stress, suggesting a severer damage of O/E plants than WT in the a tap water irrigation for another month after the stress treatment. O/E plants turned out to show a reproductive growth stage as well as in the vegetative growth stage (Figure 8a). Measurements of significantly lower ripening rate than WT in response to salt stress, suggesting a severer damage of Na and K concentrations in ripened paddies indicated that both of the elements were significantly O/E plants than WT in the reproductive growth stage as well as in the vegetative growth stage (Figure decreased in paddies from O/E plants when compared with those from WT (Figure 8b,c). However, 8a). Measurements of Na and K concentrations in ripened paddies indicated that both of the elements were significantly decreased in paddies from O/E plants when compared with those from WT (Figure 8b,c). However, no difference was found in the germination rate of the seeds from ripened paddies between O/E and WT plants (Figure 8d).
Int. J. Mol. Sci. 2018, 19, 235
7 of 14
no difference was found in the germination rate of the seeds from ripened paddies between O/E and Int. J. Mol.WT Sci. plants 2018, 19, 235 8d). (Figure Int. J. Mol. Sci. 2018, 19, 235
7 of 14
7 of 14
Results of of qPCR qPCR on on the the expression expression of of OsHKT1;4 OsHKT1;4 in in tissues tissues of of the the flag flag leaf leaf and and the the stem stem of Figure 6. Results O/E andsibling sibling WT plants, plants, which were in in the the reproductive Soil-grown plants O/E and WT which were growth stage. plants Figure 6. Results of qPCR on the expression of reproductive OsHKT1;4 in tissues of Soil-grown the flag leaf andwere the stem of with salt stress by imposing a gradual 25 mM increase in the NaCl from 25 to 100 mM for more treated with salt stress by imposing a gradual 25 mM increase in the NaCl from 25 to 100 mM for O/E and sibling WT plants, which were in the reproductive growth stage. Soil-grown plants were than a month. The transcript level of OsHKT1;4 and an internal control OsSMT3 was analyzed using more than a month. The transcript level of OsHKT1;4 and an internal control OsSMT3 was analyzed treated with salt stress by imposing a gradual 25 mM increase in the NaCl from 25 to 100 mM for the following tissues: FLB, the flag FLS, the flag P, peduncle; N I, node I; IN II, using the following tissues: FLB, theleaf flagblade; leaf blade; FLS, theleaf flagsheath; leaf sheath; P, peduncle; N I, node I; more than a month. The transcript level ofexpression OsHKT1;4 an internal control OsSMT3 was internode II; and, II, node Relative of and OsHKT1;4 is shown with awith logarithmic scaleanalyzed IN II, internode II;N and, N II, II. node II. Relative expression of OsHKT1;4 is shown a logarithmic using the following tissues: leaf FLS, the flagAn leaf sheath; P, peduncle; N I, node I; setting its expression in FLB, the FLB offlag WT (nblade; = to 6, ± asterisk indicates significant differences scale setting its expression inthe the FLBto of1 WT 1 SD). (n =An 6, ±SD). asterisk indicates significant between O/E and WT plants (Student’s t-test; * p < 0.001). differencesII; between O/E WT II. plants (Student’s t-test; * p