Table S3. Goodness of fit and model parameters for ... - PLOS
Recommend Documents
Table S3: Model extensions âparameters, equations and steady-state constraints altered from original model. Refer to Tables 1-3 and S1 to compare with ...
Inventi Rapid: Pharm Tech Vol. 2012 ... absorption is often controlled by the dissolution rate in the ... represent the drug dissolution profiles where f is a function.
Table S3. Variables and parameters for Population Genetics Model. Time periods are equal in length to gonotrophic cycles, but we use cycles to refer to units of ...
Dec 3, 2010 - federations and unions) in the USA in the 1950s and South Africa ..... American Airlines, Parmalat, Clover SA, South African Airways and Tiger ...
Table S1 Parameters for the temporal model. parameters values unit parameters values unit a1. 2.25x10+04. /M/s tp2_2. 1.00x10-04. /s a2. 6.00x10+03. /M/s tr1.
type test statistic for goodness-of-fit tests is proposed, which is useful for studying the goodness-of-fit of a wide range of models. The finite-sample behavior of the.
UJI KOLMOGOROV-SMIRNOV / GOODNESS of FIT. This test tends to be used to detect that a sample is from a population that spreads normally or not, it is.
Apr 5, 2001 - The first estimator A^ of the cumulative hazard A is the Nelson-Aalen estimator. (see Andersen et al [1]) obtained from the experiment under the ...
Testing the null hypothesis of a beta-binomial distribution against ... accuracy and
power of the test against a beta-binomial distribution contaminated with a few.
S3 Table: Characteristics of included systematic reviews in question 3 (Barriers and facilitators to PA in 55+). Page 2. Study. Included Studies, Eligibility. Criteria ...
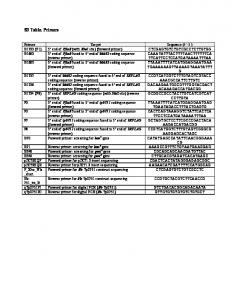
S3 Table. Primers. Primer. Target. Sequence (5'-3'). B1723 (P1) 5' end of PflaB (with XhoI site) (forward primer). CTCGAGTGTCTGTCGCCTCTTGTGG. B1662.
S3 Table. Protein sequences, identified domains and genomic locations in VectorBase of NMRI and BS-. 90 Biomphalaria glabrata VIgL domain-containing ...
0%. 0%. Distribution of glycan origin in each IgM glycan cluster. S3 Table. A. Putative epitopes. IgM-C1 IgM-C2 IgM-C3 IgM-C4 IgM-C5 IgM-C6. Size of cluster.
S3 Table. Effects of isocalorically exchanging 5% of dietary energy between carbohydrates and major types of fatty acids on glucose-insulin metrics, with ...
Table S3 â Additional results Case Study. Estimated unadjusted factor-outcome associations for the DVT case study. Risk Factor. Model. Estimation β. S.E.(β) Ïβ.
Table S3 Number of alleles (NA), range of fragment length (bp), expected and observed heterozygosity, Wright's FIS, and two-tailed P-value for deviations of ...
Table S3. Family. Genus and species. Common Name. GS1. Cohesion FGS. Mass1. Gest. Len. WA Longevity HR1. Diet Forelimb. Herpestidae. Galerella.
Table S3. The sequences of RNA oligonucleotides used for siRNA preparation. Name. Sequence (5`â3`). References sense TRBP.
-0.36; 0.63. House or buildings. 1.72. -0.10; 3.54. 0.80. 0.26; 1.34. -0.92. -2.82; 0.98. Shop or trading facilities. 0.10. -0.10; 0.29. 0.00. 0.00; 0.03. -0.10. -0.29; 0.10.
16,04. gadA, glutamate decarboxylase A PLP-dependent. 22,53. 8,66. 3,15. yodB, cytochrome b561 homolog. 22,53. gadC, glutamate:gamma-aminobutyric acid ...
S3 Table. Full single-level regression models for average post-consumption levels of ... B1 to B4 represent blocks in a stepwise single-level linear regression. B1.
Table S3. Goodness of fit and model parameters for denitrification rates in soil communities at different NaCl concentrations and modeled for each field replicate using the following power equation: Denitrification rate = k/√(c) - a, where k = slope, c = % salt concentration and a = intercept. The salt concentration when denitrification begins to be inhibited (SAI) and when the rate reaches zero (SA0) was extrapolated using the equation. Soil community r2† k a SAI§ SA0‡ replicate A1 0.938 282 161 0.29 3.06 A2 0.941 204 109 0.25 3.51 A3 0.994 262 186 0.22 2.00 B1 0.977 398 248 0.29 2.57 B2 0.964 368 269 0.29 1.87 B3 0.970 300 181 0.22 2.74 C1 0.983 840 404 0.56 4.32 C2 1.000 747 355 0.48 4.44 C3 0.989 531 267 0.46 3.97 J1 0.993 1044 400 0.45 6.79 J2 0.999 983 399 0.44 6.07 J3 0.997 827 380 0.39 4.74 † r2 reflecting the goodness of fit for the model to the denitrification rate data. § Salt concentration when denitrification inhibition begins (SAI), calculated from the model. ‡ Salt concentration when the denitrification rate reach zero (SA0), extrapolated from the model.