Table S3: Pairwise correlations between variables for the CGS ... - PLOS
Recommend Documents
Values of Spearman's P for each pair of variables are shown above the diagonal. P-values are shown below the diagonal. a. Denotes the fraction of each 100 kb ...
S3 Table. Bivariate correlations (Pearson r) for unmanipulated factors in the experiment. Abbreviations for enzymes are as follows: CBH:cellobiohydrolase, ...
Table S3. Variables and parameters for Population Genetics Model. Time periods are equal in length to gonotrophic cycles, but we use cycles to refer to units of ...
S3 Table. Pairwise population differentiation (FST) estimates of potato psyllid from nightshades at the Mesa site at different sampling dates: June (J), August (A), ...
Asser- tive. PD I PD II DG. SD I. SD II TG social class incom e college Marital status. House. Owner- ship children age .28***. 408. Sex (1=M). -.04 .03. 408. 408.
group. (n= 215) p-value. Demographics. Age (at indication onset), mean (sd) *. 72.58. (10.03). 72.15. (12.45). 0.79. 73.01. (10.30). 0.85. Gender (female), n (%)*.
S3 Table: Characteristics of included systematic reviews in question 3 (Barriers and facilitators to PA in 55+). Page 2. Study. Included Studies, Eligibility. Criteria ...
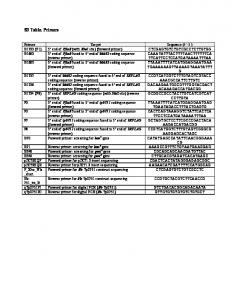
S3 Table. Primers. Primer. Target. Sequence (5'-3'). B1723 (P1) 5' end of PflaB (with XhoI site) (forward primer). CTCGAGTGTCTGTCGCCTCTTGTGG. B1662.
S3 Table. Protein sequences, identified domains and genomic locations in VectorBase of NMRI and BS-. 90 Biomphalaria glabrata VIgL domain-containing ...
0%. 0%. Distribution of glycan origin in each IgM glycan cluster. S3 Table. A. Putative epitopes. IgM-C1 IgM-C2 IgM-C3 IgM-C4 IgM-C5 IgM-C6. Size of cluster.
S3 Table. Effects of isocalorically exchanging 5% of dietary energy between carbohydrates and major types of fatty acids on glucose-insulin metrics, with ...
Table S3 â Additional results Case Study. Estimated unadjusted factor-outcome associations for the DVT case study. Risk Factor. Model. Estimation β. S.E.(β) Ïβ.
Table S3 Number of alleles (NA), range of fragment length (bp), expected and observed heterozygosity, Wright's FIS, and two-tailed P-value for deviations of ...
Table S3. Family. Genus and species. Common Name. GS1. Cohesion FGS. Mass1. Gest. Len. WA Longevity HR1. Diet Forelimb. Herpestidae. Galerella.
Table S3. The sequences of RNA oligonucleotides used for siRNA preparation. Name. Sequence (5`â3`). References sense TRBP.
-0.36; 0.63. House or buildings. 1.72. -0.10; 3.54. 0.80. 0.26; 1.34. -0.92. -2.82; 0.98. Shop or trading facilities. 0.10. -0.10; 0.29. 0.00. 0.00; 0.03. -0.10. -0.29; 0.10.
16,04. gadA, glutamate decarboxylase A PLP-dependent. 22,53. 8,66. 3,15. yodB, cytochrome b561 homolog. 22,53. gadC, glutamate:gamma-aminobutyric acid ...
S3 Table. Full single-level regression models for average post-consumption levels of ... B1 to B4 represent blocks in a stepwise single-level linear regression. B1.
NCT00099866. Schweizer et al,. 2007. U U. L. L. L. L. NCT00509236. Arjona Ferreira et al, 2013, Am J. Kidney Dis. L. U. L. L. L. L. NCT01306214. EMPA-REG.
Table S3: Pairwise correlations between variables for the CGS ... - PLOS
The fraction of each 100 kb window that overlapped with a RefSeq transcript. Denotes the number of hg18-pantro2 alignable bases that were not Repeat Masked and did not fall in phastCons regions that were G or C in hg18 divided by the total number of alignable bases within the window that were not Repeat Masked and did not fall in phastCons regions. c. The number of bases per window that were alignable between hg18 and pantro2, were not Repeat Masked, did not fall in phastCons regions, where all six individuals had sequencing data. d. Denotes the number of hg18-pantro2 differences that were not Repeat Masked and did not fall in phastCons regions divided by the total number of positions within the window where differences could have been called (i.e. the total number of alignable bases that were not Repeat Masked and did not fall in phastCons regions). e. Denotes the number of SNPs per window divided by the total number of bases where SNPs could have been called (i.e. the total number of alignable bases within the window that were not Repeat Masked and did not fall in phastCons regions where all six individuals had sequencing data). f. Denotes the “# SNPs” divided by d. g. Denotes the average number of pairwise differences between sequences within a window divided by d. b.