Proc. 16th Symposium on Haptic Interfaces For Virtual Environment And Teleoperator Systems, March 13-14, 2008, Reno, Nevada, pp. 429-436.
Tactile Graphics Rendering Using Three Laterotactile Drawing Primitives ∗ ´ Vincent Levesque
Vincent Hayward†
McGill University, Montreal, Canada.
A BSTRACT This paper presents preliminary work towards the development and evaluation of a practical refreshable tactile graphics system for the display of tactile maps, diagrams and graphs for people with visual impairments. Refreshable tactile graphics were dynamically produced by laterally deforming the skin of a finger using the STReSS2 tactile display. Tactile features were displayed over an 11×6 cm virtual surface by controlling the tactile sensations produced by the fingerpad-sized tactile display as it was moved on a planar carrier. Three tactile rendering methods were used to respectively produce virtual gratings, dots and vibrating patterns. These tactile features were used alone or in combination to display shapes and textures. The ability of the system to produce tactile graphics elements was evaluated in five experiments, each conducted with 10 sighted subjects. The first four evaluated the perception of simple shapes, grating orientations, and grating spatial frequencies. The fifth experiment combined these elements and showed that tactile icons composed of both vibrating contours and grated textures can be identified. The fifth experiment was repeated with 6 visually impaired subjects with results suggesting that similar performance should be expected from that user group. Index Terms: H.5.2 [Information Interfaces and Presentation (e.g., HCI)]: User Interfaces—Haptic I/O; K.4.2 [Computers and Society]: Social Issues—Assistive technologies for persons with disabilities 1
I NTRODUCTION
Refreshable braille displays and speech synthesizers have greatly improved access to textual information for visually impaired persons by giving them access to digitized content. Access to graphical information remains comparatively limited in part because visual graphics must be processed and simplified to be suitable for tactile use, but also because of the unavailability of reliable and affordable means to convey refreshable tactile graphics through a computer. Most tactile graphics are currently produced on physical media through a variety of methods including collage, embossed paper, thermoforming, printing on microcapsule paper and, more recently, high-density braille printing and 3 D printing [5, 23, 15]. Tactile graphics produced with such methods have proved to be of great use for geographic and orientation maps, mathematical graphs and diagrams. These are particularly important in education where visually-impaired students must have access to the same information as their sighted peers [1, 10]. They can also provide information which would be difficult to grasp from direct experience of the environment or from verbal descriptions [3]. Tactile graphics produced on physical media, however, are typically bulky and often deteriorate with use. More importantly, physical media does not afford access to dynamic content such as interactive geographic information systems (GIS). The interactive control over features such as ∗ e-mail: † e-mail:
[email protected] [email protected]
layer visibility and zoom level offered by these applications could be particularly valuable in the context of tactile graphics since information density must generally be reduced to cope with the skin’s limited resolution. Refreshable tactile graphics could therefore improve the experience of interacting with graphical information for the visually impaired. Various approaches have been explored to produce interactive tactile graphic displays. Pen-based 3 D force-feedback devices can be used to simulate the exploration of raised-line drawings or other 3 D patterns with a probe [16, 20, 26]. Patterns can similarly be produced with 2-DOF haptic devices such as consumer-grade haptic mice and joysticks [17, 26]. Although these approaches can be effective, interacting with a single-point of contact reduces realism and complicates exploration. An alternative consists of using a transducer known as a tactile display that produces programmable tactile sensations by deforming or otherwise stimulating the skin. Research on tactile displays has resulted in a wide array of prototypes using different skin stimulation methods and actuation technologies [22]. The difficulty of designing tactile displays results largely from the high density of actuators needed to produce distributed sensations in the fingerpad. Although their use extends to other fields such as surgery simulation and gaming, many tactile displays have been evaluated on the basis of their ability to display shapes or other tactile patterns [21, 19, 9, 8, 2]. Readers are referred to [22] for a more complete survey of experimental tactile displays and their use as graphical displays for visually impaired persons. Tactile displays can be divided in two classes depending on whether they provide a real or virtual surface for exploration. The first class of displays presents a large, programmable surface to be explored by the fingers or hands. The surface typically consists of an array of actuated pins that produce a discrete approximation of a 3 D surface. Shimada et al., for example, designed a tactile graphics display system with a 32×48 array of braille pins manufactured by KGS Corp. (Japan) [18]. Although this approach closely approximates static tactile graphics, it also increases cost due to the large number of actuators needed. The large size of such tactile displays also hinders portability. The second approach consists of producing a large virtual surface out of a smaller tactile display. This is achieved by dynamically altering the sensation produced by a tactile display in fixed contact with the fingerpad in response to displacements. The most famous example is the Optacon, a reading aid commercialized in the 1970’s that converted images of printed text captured from a mobile camera to tactile patterns on an array of 24×6 vibrating pins [13]. Reasonable reading rates were achieved after considerable training. Tactile displays of this class can also be used to explore virtual tactile graphics when connected to a personal computer. An example is the VTPlayer mouse with its two 4×4 braille pin arrays [7]. The main advantage of this approach is that fewer actuators are needed, reducing cost and size. Producing meaningful sensations without relative motion between the stimulator and fingerpad, however, is challenging. The work presented in this paper aims to address this problem by producing controlled lateral skin deformation patterns rather than indenting the skin. This principle, which we name laterotactile stimulation, assumes that the critical deformation occurring at the level of the mechano-receptors can be approximated by laterally deforming the skin. A series of tactile displays have been designed to
Proc. 16th Symposium on Haptic Interfaces For Virtual Environment And Teleoperator Systems, March 13-14, 2008, Reno, Nevada, pp. 429-436.
exploit this principle including 1-D [12, 14] and 2 D [24] arrays of laterally moving skin contactors. All use a similar technology based on piezoelectric bending motors. Previous work has shown that when appropriately programmed, skin deformation patterns produced by these displays can evoke the sensation of brushing against localized features such as braille dots and gratings [12, 11, 14]. This paper presents our most recent work on the display of refreshable tactile graphics using the latest 2 D laterotactile display, the STReSS2 [24]. Three tactile rendering methods capable of producing the sensation of gratings, dots, and vibrating patterns are presented. An early version of these tactile rendering algorithms were previously used in a tactile memory game that demonstrated the capabilities of the STReSS2 tactile display during the 2006 ACM Conference on Human Factors in Computing Systems [25]. This paper also reports on our efforts to evaluate the effectiveness of the system for the display of tactile graphics. A first experiment evaluated the identification of simple shapes using the three rendering methods. The next three experiments investigated the device’s rendering of tactile gratings at various orientations and spatial frequencies. The final experiment combined shape and texture rendering to evaluate the system’s ability to display tactile icons. The first four experiments were each conducted with 10 sighted subjects. The final experiment was conducted with 10 sighted and 6 visually impaired subjects to validate the results for the target user group. The elements of tactile graphics investigated here constitute a first step toward the design of tactile maps and diagrams adapted for display by laterotactile stimulation. 2
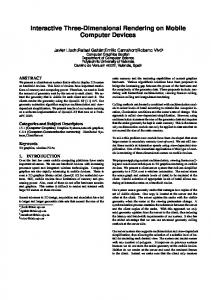
of the display. The tactile display’s electronics were covered with a plastic protector and foam for safe and comfortable usage. More information about this apparatus can be found in [24]. The system’s driving signals were produced at 1 kHz on a personal computer running Linux and the Xenomai real-time framework (http://www.xenomai.org). Actuator activation signals were produced with a resolution of 10 bits. Rendering algorithms and drivers were programmed in C++. 3 TACTILE R ENDERING The STReSS2 display produces tactile sensations by dynamically controlling lateral deformation patterns on the fingerpad in response to exploratory movements within its planar carrier’s workspace. Extracting meaningful sensations from this mode of skin stimulation requires the specification of appropriate actuator activation patterns, a process that we term tactile rendering by analogy with graphics rendering. This section describes in details three laterotactile rendering methods that produce dotted outlines, vibrating patterns and virtual gratings. The tactile sensations produced by these rendering methods are modulated over the virtual surface using bitmapped grayscale images. This allows the creation of tactile patterns with standard image editing software. These renderings can also be combined to create more complex tactile graphics. Fig. 2 shows visual representations of squares rendered with all three methods.
TACTILE D ISPLAY P ROTOTYPE
The tactile rendering system used in this work is a prototype that combines a STReSS2 tactile display with an instrumented 2 D planar carrier (Fig. 1). The STReSS2 revision used stimulates the skin by controlling the deflection of a matrix of 8×8 piezoelectric bending motors [24]. The actuators deflect toward the left or right by approximately 0.1 mm, and produce a blocked force in the order of 0.15 N. The center-to-center distance between adjacent actuators is 1.2×1.4 mm. The reading fingerpad therefore rests against an active contact area of 9×11 mm. Filters with a 200 Hz cut-off frequency enable more accurate signal reconstruction and attenuate most energy at the natural resonance frequency of the actuators, resulting in the elimination of most audible noise and in more natural tactile sensations.
(a)
(b)
(a)
(b)
(c)
(d)
Figure 2: Visual illustration of squares rendered with (a) dots, (b) vibration, (c) gratings, and (d) a combination of all three.
By convention, the following discussion specifies actuator deflections δ between 0 (right) and 1.0 (left). Deflecting actuators to the right when at rest provides a greater swing upon activation and increases the strength of some sensations. Although directional effects appear to be minimal, this resting position is also selected so that activation occurs against motion when moving the display from left to right. The deflection of unloaded actuators is used here as an approximation of the intended skin deformation patterns. Actual deformation patterns may differ due to the complex biomechanical properties of the skin. Fig. 3 illustrates the displacement of the tactile display over a virtual surface as well as the deflection of its actuators.
(c)
Figure 1: (a) Active area of the STReSS2 tactile display, (b) mounted on a planar carrier, and (c) usage of the device.
STR e SS 2
The STReSS2 was mounted on a planar carrier that allowed movement within a 11×6 cm virtual surface. The carrier was a 2 degree of freedom (2-DOF) haptic device with low friction and inertia called the Pantograph [4]. The device was used as a passive carrier and its motors were therefore inactive. The carrier measured position with a resolution better than 13 µm. The workspace of the Pantograph was slightly reduced to prevent collision with the tactile display, resulting in the above mentioned virtual surface dimensions. Rotation of the display was neither prevented nor measured and users were therefore required to maintain the orientation
(a)
(b)
Figure 3: (a) Virtual surface with a grated circle and (b) close-up on tactile display deflection pattern.
3.1 Dot Rendering The sensation of brushing against a dot is produced by swinging actuators towards the left and then back to the right as they slide
Proc. 16th Symposium on Haptic Interfaces For Virtual Environment And Teleoperator Systems, March 13-14, 2008, Reno, Nevada, pp. 429-436.
over a virtual dot. The deflection is expressed mathematically as follows: if r ≤ P, 1.0 (r−P) δ (r) = 21 + 12 cos π (1−P) if P ≤ r ≤ 1.0, (1) 0.0 otherwise;
by attending to the subtle directional sensation on the fingertip or by finding the direction of movement with the strongest or weakest stimulus, corresponding to motion across or along ridges respectively. Again, the amplitude of the grating texture is modulated by an image mask. Grating patterns are represented visually as shown in Fig. 2c.
where r = kpi, j − pcenter k/radius is the relative distance from the center of the dot. As they move over the dot, actuators first follow a smooth sinusoid that takes them from their rest position on the right to their active position on the left. They then maintain this deflection over a plateau of radius P. A plateau of P = 0.25 was found to produce smooth transitions while giving each dot sufficient area to be easily perceptible from any direction. The location and amplitude of each dot is specified with blobs in a grayscale image. Dots can be positioned anywhere on the virtual surface provided that they do not overlap. Dot patterns are represented visually as shown in Fig. 2a. This rendering method was inspired by earlier work on the display of Braille [11] and dot patterns [25] by lateral skin deformation. While these earlier attempts assumed that the dots were either exclusively or mostly explored by horizontal motion, the improved method presented here allows exploration from any direction, thereby improving the realism of the sensation and facilitating contour following. This improvement results from the use of a radial deflection pattern with a plateau at its center.
3.4
3.2 Vibration Rendering This tactile rendering method produces a sensation of localized vibration within the virtual surface [25]. The vibratory sensation is produced by controlling the deflection of each actuator i, j as a temporal oscillation: ( δ (i, j,t) =
1 2 1 2
1 2 1 2
+ cos 2π f t − cos 2π f t
if (i mod 2) 6= ( j mod 2), otherwise.
(2)
The phase of vibration is inverted for adjacent actuators to maximize compression and shearing deformation, and thereby increase the strength of the sensation. A vibration frequency of 50 Hz was similarly found to provide the strongest sensation. Higher frequencies could potentially increase contrast further but could not be used at present time due to limitations of the I/O hardware used to communicate with the STReSS2 . Vibratory patterns are produced by modulating the amplitude of vibration of actuators as a function of their position within the virtual surface. The amplitude mapping is specified with a grayscale image mask. Vibrating patterns are represented visually using a white-noise texture (e.g. Fig. 2b). 3.3 Grating Rendering This rendering method extends our earlier work on the display of vertical gratings to that of gratings of arbitrary orientation [25]. The grating rendering produces a sensation similar to that of brushing a finger against a corrugated surface. This sensation is obtained by propagating a sinusoidal wave across the tactile display at a specific angle. The deflection of each actuator is given by:
Composite Rendering
The three rendering methods described previously produce tactile patterns by deflecting the actuators only as they pass over specific regions of the virtual surface, otherwise leaving them at their resting position to the right. Provided that there is no overlap between their active regions, it is therefore possible to combine tactile layers rendered with different methods by simply adding together their modulated actuator deflection functions. This allows complex tactile patterns to be created, as represented visually in Fig. 2d. 4
E XPERIMENTS
This section describes five experiments that were conducted to gain a better understanding of the tactile display system’s capabilities. The first experiment looked at the identification of simple geometrical shapes produced with either dots, vibration or gratings (Section 4.1). The second experiment investigated the difference in spatial frequency necessary to differentiate gratings (Section 4.2). The third and fourth experiments studied the identification of grating orientations, first with intervals of 30◦ and then of 45◦ (Sections 4.3 and 4.4). The fifth experiment looked at the identification of tactile icons composed of vibrating contours and grated interiors (Section 4.5). group A B C VI
10 10 10 6
mean 22.4 21.8 24.1 47.8
age range 19–29 19–26 18–52 35–65
gender male female 2 8 4 6 3 7 5 1
handedness left right 1 9 1 9 2 8 1 5
Table 1: Description of the four groups of subjects who participated in the experiments.
Three groups of 10 sighted subjects (A, B and C) and one group of 6 visually impaired subjects (VI) participated in the experiments. Each subject took part in one or two experiments during a one-hour experimental session. Group A participated in the first experiment, group B in the second and third, and group C in the fourth and fifth. The firth experiment was repeated with the visually impaired subjects of group VI. The subjects were selected solely based on availability and paid for their participation. They performed the experiment with the index of their preferred hand. Details about preferred hand, gender, and age distribution within the subject groups are shown in Table 1. Two of the subjects of group VI had previously participated in a study on the use of the STReSS2 as a Braille display [11]. Two were blind from birth and the others had lost their sight between the ages of 3 and 20. 4.1 4.1.1
1 1 2πd + cos , (3) 2 2 λ where d = y cos θ − x sin θ is the distance from the actuator position (x, y) to a reference line crossing the origin at angle θ . This produces a grating of spatial wavelength λ at an orientation of θ . Horizontal and vertical gratings produce natural sensations for a wide range of spatial frequencies. Diagonal orientations produce noisier sensations. The orientation of a grating can be judged either δ (d) =
size
Shape Description
The first experiment evaluated the perception of simple geometric shapes displayed on the tactile display. The experiment was designed to also evaluate the effect of rendering method and shape size on identification performance. The experiment consisted in the identification of six shapes rendered using the three methods described in the previous section at two different scales. Fig. 4 illustrates the six shapes as well as the six variations of the circle shape. The experiment was conducted with subject group A.
Proc. 16th Symposium on Haptic Interfaces For Virtual Environment And Teleoperator Systems, March 13-14, 2008, Reno, Nevada, pp. 429-436.
85.2% for vibrating shapes, 78.0% for dotted shapes and 64.8% for grating-textured shapes. The difference in performance was significant between grating rendering and both dot rendering (t=−2.489, p