SPONSOR/MONITOR'S REPORT NUMBERS. 12. ..... promising application areas: a tracking display in steering and control tasks and a situational ..... Long buzz.
Tactile Guidance for Land Navigation by Linda R. Elliott, Elizabeth S. Redden, Rodger A. Pettitt, Christian B. Carstens, Jan van Erp, and Maaike Duistermaat
ARL-TR-3814
Approved for public release; distribution is unlimited.
June 2006
NOTICES Disclaimers The findings in this report are not to be construed as an official Department of the Army position unless so designated by other authorized documents. Citation of manufacturer’s or trade names does not constitute an official endorsement or approval of the use thereof. DESTRUCTION NOTICE⎯Destroy this report when it is no longer needed. Do not return it to the originator.
Army Research Laboratory Aberdeen Proving Ground, MD 21005-5425
ARL-TR-3814
June 2006
Tactile Guidance for Land Navigation Linda R. Elliott, Elizabeth S. Redden, Rodger A. Pettitt, and Christian B. Carstens Human Research & Engineering Directorate, ARL
Jan van Erp and Maaike Duistermaat TNO Human Factors, Department of Human Interfaces
Approved for public release; distribution is unlimited.
Form Approved OMB No. 0704-0188
REPORT DOCUMENTATION PAGE
Public reporting burden for this collection of information is estimated to average 1 hour per response, including the time for reviewing instructions, searching existing data sources, gathering and maintaining the data needed, and completing and reviewing the collection information. Send comments regarding this burden estimate or any other aspect of this collection of information, including suggestions for reducing the burden, to Department of Defense, Washington Headquarters Services, Directorate for Information Operations and Reports (0704-0188), 1215 Jefferson Davis Highway, Suite 1204, Arlington, VA 22202-4302. Respondents should be aware that notwithstanding any other provision of law, no person shall be subject to any penalty for failing to comply with a collection of information if it does not display a currently valid OMB control number. PLEASE DO NOT RETURN YOUR FORM TO THE ABOVE ADDRESS. 1. REPORT DATE (DD-MM-YYYY)
June 2006
2. REPORT TYPE
3. DATES COVERED (From - To)
Final
March through December 2004
4. TITLE AND SUBTITLE
5a. CONTRACT NUMBER
Tactile Guidance for Land Navigation
5b. GRANT NUMBER 5c. PROGRAM ELEMENT NUMBER
6. AUTHOR(S)
5d. PROJECT NUMBER
62716AH70 Linda R. Elliott, Elizabeth S. Redden, Rodger A. Pettitt, Christian B. Carstens (all of ARL); Jan van Erp and Maaike Duistermaat (The Netherlands)
5e. TASK NUMBER 5f. WORK UNIT NUMBER
7. PERFORMING ORGANIZATION NAME(S) AND ADDRESS(ES)
8. PERFORMING ORGANIZATION REPORT NUMBER
U.S. Army Research Laboratory Human Research & Engineering Directorate Aberdeen Proving Ground, MD 21005-5425
ARL-TR-3814
9. SPONSORING/MONITORING AGENCY NAME(S) AND ADDRESS(ES)
10. SPONSOR/MONITOR’S ACRONYM(S) 11. SPONSOR/MONITOR’S REPORT NUMBERS
12. DISTRIBUTION/AVAILABILITY STATEMENT
Approved for public release; distribution is unlimited.. 13. SUPPLEMENTARY NOTES
14. ABSTRACT
This study compared a tactile land navigation system to two operational systems with visual information displays. “Front end” workload and task analyses identified land navigation as having high and conflicting workload. The tactile display was expected to ameliorate the high visual and cognitive workload per Multiple Resource Theory (Wickens, 2002). Fifteen infantry Soldiers navigated three equivalent 1800-meter routes using each of three systems: (a) the personal tactile navigator (PTN) tactile system, (b) the U.S. Army precision lightweight GPS (global positioning system) receiver (PLGR), which is a hand-held GPS with an alpha-numeric display, and (c) the traditional compass system. Note: Each soldier traversed each lane with different navigation systems; we counterbalanced the order in which they used the systems and the lanes that were walked with each system in order to control for any effects attributable to order (such as fatigue) or to the lane itself. The PLGR system was predicted to enhance performance relative to the compass system because of reduced cognitive demands. The PTN system was predicted to enhance performance relative to both PLGR and compass systems because of (a) reduced cognitive demand from more intuitive display (e.g., following direction of tactor) and (b) off load from visual attention demand. Soldiers performed more quickly and accurately when using the PLGR and tactile systems, relative to a compass. However, there was no significant difference between GPS and tactile systems. This is likely because of the low need for focal visual attention during navigation in this experiment; there was not as much interference with the occasional use of a visual display. However, visual attention demand increases when there is an active search for enemy or reduced visual field (e.g., fog, darkness). These results emphasize the need for detailed task analyses to ascertain differences in cognitive demands resulting from off loading information to a different channel. The PTN system demonstrated operational effectiveness and high promise for battlefield situations with increased attention to threat and/or reduced visibility. 15. SUBJECT TERMS
IMPRINT workload analyses; land navigation; multi-modal; multiple resource theory; Soldier performance; tactile display 17. LIMITATION OF ABSTRACT
16. SECURITY CLASSIFICATION OF: a. REPORT
b. ABSTRACT
c. THIS PAGE
UNCLASSIFIED
UNCLASSIFIED
UNCLASSIFIED
SAR
18. NUMBER OF PAGES
35
19a. NAME OF RESPONSIBLE PERSON
Linda R. Elliott 19b. TELEPHONE NUMBER (Include area code)
(706) 545-9145 Standard Form 298 (Rev. 8/98) Prescribed by ANSI Std. Z39.18
ii
Contents
List of Figures
v
List of Tables
v
Acknowledgments
vi
1.
1
Background 1.1
Multiple Resource Theory...............................................................................................2
1.2
Tactile Displays for Military Situational Awareness ......................................................3
2.
Objectives
5
3.
Method
5
4.
3.1
Participants ......................................................................................................................5 3.1.1 Soldiers’ Self-Evaluation of Skill........................................................................6
3.2
Training ...........................................................................................................................6
3.3
Instruments and Apparatus..............................................................................................7 3.3.1 Precision Lightweight GPS Receiver (PLGR) ....................................................7 3.3.2 Personal Tactical Navigator (PTN) .....................................................................7
3.4
Land Navigation Course..................................................................................................9
3.5
Questionnaires .................................................................................................................9
3.6
Procedures .....................................................................................................................10
3.7
Measures........................................................................................................................10 3.7.1 Time to Complete Land Navigation Course Trials ...........................................10 3.7.2 Mean Deviation From the Navigation Route ....................................................10 3.7.3 Waypoint Completion .......................................................................................10 3.7.4 Timeliness and Accuracy of Response to Radio Communication Inquiries .....10 3.7.5 Participant Evaluation of the Navigation Systems ............................................11
Results
11
4.1
PTN Performance ..........................................................................................................11
4.2
Navigation Speed ..........................................................................................................11 4.2.1 Hypotheses 2 and 3............................................................................................11
iii
4.3
Communication Response.............................................................................................13
4.4
Navigation Flexibility (re-routing)................................................................................13
4.5
Analysis of Walking Speed ...........................................................................................14
4.6
Participant Evaluations of the PTN System ..................................................................15 4.6.1 Self-Evaluation of Performance ........................................................................15 4.6.2 Ratings of PTN Characteristics .........................................................................15 4.6.3 Rank Order of Systems......................................................................................16 4.6.4 Operational Relevance ......................................................................................16
4.7
Participant Comments ...................................................................................................16 4.7.1 Comments Regarding What Soldiers Liked Best About the PTN System........16 4.7.2 Comments Regarding How the System Could be Improved ............................17 4.7.3 Comments Regarding Accuracy of Navigation for Each System .....................17 4.7.4 Comments Regarding Situational Awareness ...................................................17 4.7.5 Comments Regarding Speed of Navigation ......................................................17 4.7.6 Comments Regarding How Technology Would be Used .................................17
5.
Discussion
17
6.
Conclusions and Recommendations
20
7.
References
22
Distribution List
25
iv
List of Figures Figure 1. Figure 2. Figure 3. Figure 4. Figure 5.
U.S. Army GPS PLGR: device and two displays.......................................................... 7 Schematic overview of the PTN..................................................................................... 8 Proportion of waypoints found with each system. ....................................................... 11 Time to complete the course with each system. ........................................................... 12 Mean deviation from navigation course. ...................................................................... 14
List of Tables Table 1. Research participant characteristics................................................................................. 5 Table 2. Ratings of training effectiveness...................................................................................... 6 Table 3. Ratings for PTN usefulness for military operations. ....................................................... 6 Table 4. Coding heading and distance on the tactile display......................................................... 9 Table 5. Summary statistics, course completion times, radio response times, and root mean square (rms) error.................................................................................................................. 12 Table 6. Post hoc comparisons, mean total course times. ........................................................... 12 Table 7. Mean time in seconds to respond to radio-based requests for information. ................. 13 Table 8. Root mean squared deviations from land navigation routes for each system................ 13 Table 9. Holm’s Bonferonni comparisons of root mean squared deviations............................... 13 Table 10. Distance walked (km). ................................................................................................. 14 Table 11. Speed of navigation (km/hr). ....................................................................................... 15 Table 12. Post hoc comparisons, speed of navigation (km/hr).................................................... 15 Table 13. Mean ratings of PTN attributes.................................................................................... 15 Table 14. Percent of Soldiers awarding the highest rank............................................................. 16 Table 15. Usefulness of PTN for mission operations. ................................................................. 16
v
Acknowledgments This effort was conducted as part of the U.S. Army Technology Objective for Enhanced Unit of Action Maneuver Team Situational Understanding, sponsored by the U.S. Army Research Laboratory. Special thanks go to George D. Mock and Edward J. Sankbeil at the Soldier Battle Lab, Fort Benning, Georgia, whose expert soldiering knowledge and skill supported us throughout the data collection effort. Also, the authors would like to thank the Soldiers who participated in this research for their enthusiasm, dedication to task, and insightful feedback.
vi
1. Background Future Army networked systems will enable information creation and distribution to extraordinary levels through advanced communications and linkages among manned and unmanned sensors, command stations, and Soldiers on the battlefield. Combat advantage is expected; however, information overload is likely. Although research and technology address issues of information requirements, distribution, and decision support, there is also the issue of information display. Battlefield situation awareness (SA) is more than the effective distribution of information; human interpretation and decision making will always be critical. Given this, systematic investigations are under way regarding application of information display principles to ameliorate task workload and enhance Soldier performance. The U.S. Army Research Laboratory (ARL) initiated an advanced technology objective (ATO) to develop information system interface solutions to reduce cognitive workload, enhance SA, shorten decision-making times, and improve decision accuracy. Experimental approaches have been developed, based on the identification of operational task demands, ratings of task workload (visual, audio, cognitive, speech, physical), and theory-based predictions, drawn from the Multiple Resource Theory (MRT) (Boles, 2001; Wickens, 1992, 2002; Wickens & Hollands, 2000). The objective is to apply multi- and uni-modal interventions to task situations typified by high and conflicting workload. This report describes collaboration between ARL and TNO1 Human Factors, Department of Human Interfaces, The Netherlands, which used the personal tactile navigation (PTN) system for land navigation, at Fort Benning, Georgia. The rationale for the study was based on principles drawn from MRT and from IMPRINT (Improved Performance Research Integration Tool) task and workload analyses. IMPRINT analyses explicate tasks and their interdependencies so that they can be modeled. Each task is rated for workload (visual, audio, cognitive, psychomotor) consistent with MRT (Keller, 2002). IMPRINT analyses of Soldier roles identified instances of high workload. The PTN system was expected to reduce attentional demand and workload associated with land navigation. It has been emphasized that current automation feedback relies heavily and increasingly on the focal visual modality (Sarter, 2000; Wickens, 2002). It has also been argued and demonstrated that multi-modal interventions using non-visual pathways can be used to ameliorate the task demand (Gilliland & Schlegel, 1994; Raj, McGrath, Rochlis, Newman, & Rupert, 1998; Sarter, 2000, 2001, 2002; Sklar & Sarter, 1999). As a result, the use of other modalities (e.g., in the form of tactile, audio, or peripheral visual cues) is being explored for numerous military applications. Experimental results have shown that the most complex variations of these displays are successful in air and space applications (McGrath, Estrada, Braithwaite, Raj, & Rupert, 2004; Raj et al., 1998; Raj, Kass, & Perry, 2000; Rochlis & Newman, 2000; Rupert, 1
Nederlandse Organisatie voor Toegepast Natuurwetenschappelijk Onderzoek
1
2000a, 2000b; Van Erp & Van Veen, 2003; Van Erp, Veltman, Van Veen, & Oving, 2003; Van Erp, 2002). 1.1
Multiple Resource Theory
We began with a focus on operator workload. Land navigation by the dismounted Soldier was identified as a task typified by high workload, particularly in the context of combat missions (Mitchell et al., 2004). Much of the workload for land navigation depends on ambient and focal visual information processing. Our hypotheses were based on MRT, which provides us with a framework to understand performance in high workload or overload situations (Wickens, 2002). Simply stated, MRT proposes that (a) people have several independent capacities with resource properties; (b) some resources can easily be used simultaneously, while other combinations are much more difficult; (c) tasks using compatible resources can usually be performed together, and (d) competition for the same modality can produce interference. More specific hypotheses can be drawn regarding the degree of task interference, based on the extent that the tasks share stages, sensory modalities, codes, and channels of visual information (i.e., focal versus ambient; Wickens, 2002). “Processing stages” distinguishes the more deliberative cognitive resources required by perception and cognition versus the more intuitive resources required in the selection and execution of responses, which are often manual and more automated or intuitive. Wickens also makes a distinction between spatial and verbal processes, stating that two tasks compete for resources when they are similar in resource demand. He points out that manual responses are often spatial in nature (e.g., walking) and can often be performed effectively when combined with a verbal task (e.g., talking on a radio). If task requirements do not overlap on any of these three dimensions, there will be more efficient time sharing, and changes in the difficulty in one task will not have a large effect on the performance of the other task. Given the high visual and decision-making workload indices generated by IMPRINT task analyses (Mitchell et al., 2004) of dismounted land navigation, we expected a tactile land navigation system to reduce workload and enhance performance. First, the cognitive resources required by a tactile system would be simpler and more intuitive in response. With the tactile belt, the tactor that is activated (i.e., buzzing) points to the direction of the next waypoint. The Soldier simply turns in the direction of the activated tactor until the tactor in front (e.g., nearest his navel) is activated. When the front tactor is activated, the Soldier simply walks straight ahead in order to reach the waypoint. If s/he veers off course to the left or right, the corresponding tactor will be activated to steer the Soldier back on course. In addition, the perceptual modality used for information presentation is tactile and should interfere less with the auditory or visual information channels. Several studies have demonstrated the usefulness of tactile information input in multi-task situations (Hopp, Smith, Clegg, & Heggestad, 2005; Sarter, 2002, 2001; Sklar & Sarter, 1999;
2
Van Erp, 2001; Van Erp et al., 2003). Tactile systems have proved particularly effective when other information channels are overloaded or distorted (e.g., auditory channel in a noisy environment; visual channel when visibility is low). Van Erp and Vogels (1998) identified two promising application areas: a tracking display in steering and control tasks and a situational awareness display in orientation tasks. They also investigated localization of tactors, comparing actual placement with reported sensation of vibration, and performed a series of experiments relevant to placement and intensity of tactors (Van Erp, 2005; 2002) and alternate approaches to coding information (Van Veen, Spapé, & Van Erp, 2004). The location of the tactors plays a key role. For instance, Gilliland and Shlegel found limited usefulness of tactile displays on the head (1994). Dobbins and Samways (2002) used one tactor (i.e., a vibro-tactile display element) on each wrist to effectively display a virtual corridor in a maritime navigation setting. Van Erp and Van Veen placed tactors in a driver’s seat to navigate a car through town; they had good results. For information regarding direction, Van Erp (2005) showed that a localized vibration on a waist belt could easily and accurately be interpreted as a direction in the horizontal plane. It is intuitive to infer direction from the torso, which is relatively stable. The purpose of this research was to apply cognitive theory to the operational performance of the dismounted infantryman. Wickens’ framework provides practical guidelines that can be drawn from operational task analyses. MRT proposes that (a) people have several independent capacities with resource properties; (b) some resources can be used simultaneously with not much trouble, while other combinations are much more difficult; (c) tasks using compatible resources can usually be performed together, and (d) competition for the same modality can produce interference. 1.2
Tactile Displays for Military Situational Awareness
Tactile interfaces provide additional information (e.g., cueing, orientation feedback), usually through vibro-tactile means or by raised interfaces (e.g., Braille). A common example is the vibration mode in cell phones and pagers. More complex tactile interfaces use patterns of vibratory feedback through placement of vibrating tactors. The sense of feel is not typically used as a human-machine communication channel, but researchers are realizing the high potential it represents. With an intuitive body-referenced organization of vibro-tactile stimuli, information can be “displayed” to a person. In military applications, tactile displays have been shown to provide improved situational awareness to operators of high performance weapon platforms and to improve their ability to spatially track targets and sources of information. Tactile displays can reduce perceived workload by their easy-to-interpret intuitive nature and can convey information without diverting the user’s attention away from the operational task at hand. The key to successful implementation of tactile displays lies in the ability to convey a strong vibro-tactile sensation to the body with compact, lightweight devices that can be comfortably incorporated in the user’s workspace or clothing
3
without impairing movement. These devices must be safe and reliable in harsh environments, and drive circuitry should be compatible with standard digital communication protocols. Van Erp and Vogels (1998) initiated investigations in basic principles with regard to the use and coding of tactile displays. Tactile displays would be indicated when the characteristics of the presented information resemble the tactile sense (e.g., surface information of objects in virtual environments), when the surroundings lower the effectiveness of other modalities (e.g., auditory information in noisy places), or when the observer is less able to perceive information from other modalities (e.g., visual information when the visual channel has less spare capacity). In these situations, tactile displays may be preferred. Van Erp and Vogels report considerations that may be important in the design of tactile displays, based on the fundamental physiological and psychophysical knowledge and the lessons learned from investigations with tactile displays. In the discussion, two promising application areas are defined: a tracking display in steering and control tasks and a situational awareness display in orientation tasks (Van Erp & Vogels, 1998). They have also investigated localization of tactors, comparing actual placement with reported placement, and have performed a series of experiments relevant to placement and intensity of tactors (Van Erp, 2001) and cross-modal interactions (Van Erp & Verschoor, 2000). The usefulness of tactile displays for navigation has been demonstrated in various settings. Relatively simple displays were used by Dobbins and Samways (2002), who used one tactor (i.e., a vibro-tactile display element) on each wrist to display a virtual corridor in a maritime navigation setting, and by Van Erp and Van Veen (2004) who built tactors in a driver’s seat to navigate a car through a town. Van Erp (2005) showed that a localized vibration on a waist belt could easily and accurately be interpreted as a direction in the horizontal plane. Employing this principle allows one to present navigation information with a higher resolution than “turn left” or “turn right”. The skin is very sensitive to temporal aspects of vibro-tactile stimulation (see Van Erp & Werkhoven, 2004). The choice for timing (or actually, on-off rhythm) is also supported by investigations. Chiasson, McGrath, and Rupert (2003) used three different rhythms to enlarge the 90-degree display resolution to indicate 30-degree segments. Van Erp et al. (2003) and McGrath et al. (2004) used rhythm to indicate the amount of drift or the air speed in their helicopter hover displays, while Bosman, Groenendaal, Findlater, Visser, De Graaf, and Markopoulos (2003) found that length of pulse trains are a better coding than intensities in a guiding system for pedestrians. Although tactile interface solutions have demonstrated effectiveness in a range of applications, it should not be assumed that effectiveness will generalize across all situations. A principled approach is needed to identify opportunities where tactile cues are likely to alleviate workload and enhance performance. MRT (Wickens, 2002) provides such guidelines for the reduction of cognitive load through the distribution of tasks and information across various sensory channels. Hypotheses were as follow:
4
H1. The PTN system would enable Soldiers to reach land navigation waypoints and complete the land navigation routes. H2. The PTN system would enable land navigation more quickly than the compass system. H3. The PTN system would enable land navigation more quickly than the precision lightweight GPS receiver (PLGR) system. H4. The PTN system would enable Soldiers to respond more quickly than with the PLGR or compass system to communication requests. H5. The PTN system would enable Soldiers to re-route to avoid terrain obstacles and still achieve waypoints.
2. Objectives ARL has an ATO to investigate effectiveness of tactile and multimodal displays for infantry operations. IMPRINT output serves as the primary source of task and workload indices. From these data, instances have been identified where multiple task conflicts occur. MRT principles regarding reduction of workload serves as the guidance for how multi-modal display intervention could decrease workload in these cases. In this study, we investigated the utility of a tactile display for dismounted land navigation.
3. Method 3.1 Participants Fifteen infantry Soldiers from the 29th Infantry Regiment participated in the study. Although the unit was officially requested for troops, it was made clear that Soldier participation in the experimentation would be voluntary. The Soldiers were informed that if they chose not to participate, they could convey that choice privately to the experiment manager. A group of Soldiers were informed of the study purpose and risks, and all volunteered. They also provided medical history information for screening purposes. Table 1 provides summary information. Table 1. Research participant characteristics. Age (years) Rank Time in service (months) Time overseas (months) Time in combat Prior GPS experience (E3-E4) Prior GPS (E5-E6)
Min 19 8 E-3/4 12.00 0 0 25% Yes 100% Yes
*SD = standard deviation
5
Max 35 7 E-5/6 180 108 24
Mean 23.8
SD* 4.63
48.1 14.1 7.3
43.6 27.4 9.5
3.1.1 Soldiers’ Self-Evaluation of Skill Soldiers’ roles included Bradley fighting vehicle driver, Bradley gunner, rifleman, squad leader, and fire team leader. Soldiers also provided self-evaluation ratings (1- to 7-point scale: none, slight, novice, OK, good, very good, expert) on skills such as map reading (mean 4.93, SD 1.38), land navigation (mean 4.60, SD 1.4), computer use (mean 4.6 SD 1.63); GPS use (mean 3.33 SD 1.76), and radio communications (mean 4.80, SD 1.15). Ratings of skill in land navigation, GPS use, and radio communications correlated positively and significantly with rank (r = 0.69, 0.77, 0.74, respectively, p < 0.01). 3.2
Training
The Soldiers were in a military occupational specialty that requires map reading and land navigation skills. No specialized experience was required. However, an experimenter provided a refresher course on map and compass land navigation. He also trained the Soldiers to use the Army PLGR. An experimenter from TNO-HF trained the Soldiers to use the PTN. After the classroom training session, Soldiers conducted practice field trials with each type of navigation equipment. At the end of the training session, training evaluation forms were provided to Soldiers. Ratings indicated high levels of satisfaction with training for each type of system and high ratings for PTN concepts, performance, and potential (see tables 2 and 3). Table 2. Ratings of training effectiveness. PTN explain PTN practice Compass review Compass practice PLGR review PLGR practice Valid N (listwise)
N 15 15 15 15 15 15 15
Minimum 6 6 6 1 6 6
Maximum 7 7 7 7 7 7
Mean 6.6 6.6 6.6 6.1 6.6 6.6
SD .48 .50 .48 1.55 .48 .48
Table 3. Ratings for PTN usefulness for military operations. PTN Night operations PTN MOUT* operations PTN Reconnaissance PTN Sustained operations PTN Enemy Encounter Valid N (listwise)
N 14 14 14 14 14 14
Minimum 6 4 3 4 4
*MOUT = military operations on urban terrain
6
Maximum 7 7 7 7 7
Mean 6.7 6.2 6.0 6.1 6.0
SD .46 .97 1.17 .94 .87
3.3
Instruments and Apparatus
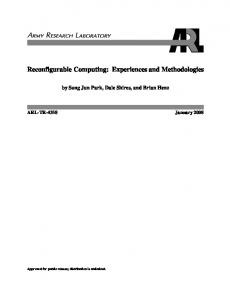
3.3.1 Precision Lightweight GPS Receiver (PLGR) The PLGR is a small, hand-held, GPS receiver featuring selective availability/anti-spoofing (i.e., resistant to data corruption) and anti-jam capability. It provides precise positioning and timing solutions based on signals received from the GPS satellite constellation. The PLGR weighs 2.75 lb. Navigation with the PLGR requires training and practice. The PLGR system is complex, with four modes and an extensive menu system with many detailed sequential commands to initiate functions such as navigation mode, method, and waypoint creation and selection. Figure 1a provides an example of PLGR information display that shows waypoint number, position accuracy, current heading in degrees, direct azimuth, and steering angle. If your TRK (track) (line 2) is within 10 degrees of the azimuth, you are on course, but you must be outside and moving for this to be accurate. Figure 1b provides the display for range (distance to waypoint), estimated time to waypoint, elevation difference, and minimum miss difference (same as range unless you are off course). No data are available for time to go and minimum miss distance if you are not moving. WP002 30m TRK 020.5M AZ 210.0M kph STR>190.5 ÚP
RNG 60.0m TTG 0020:15 ELD +00003.0m MMD2 60.0m ÚP
(a)
(b)
Figure 1. U.S. Army GPS PLGR: device and two displays.
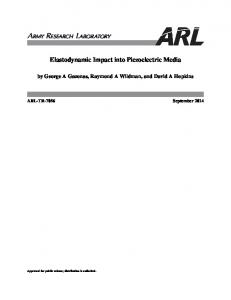
3.3.2 Personal Tactical Navigator (PTN) The PTN is a custom-built device of which a schematic overview is given in figure 2. The sensor pack consisted of a GPS sensor and an electronic compass. The sensor data were 7
processed by the processing unit that compared the current position and heading with the stored route. The processing unit also stored the data and controlled the eight-element tactile display.
Control buttons
Breakout box
Power supply NiMH 14.4 V
Processing unit
Sensor pack GPS + compass
8-element tactile display
Figure 2. Schematic overview of the PTN.
The tactile display consisted of eight vibrating elements (1.3-volt vibrating DC motors, JinLong Industries, housed in rectangular PVC [polyvinylchloride] boxes) with a contact area of 1.5 by 2.0 cm and a vibration frequency of 155 Hz. The boxes were mounted in an adjustable waistband. The resolution of the displays (i.e., eight tactors for 360 degrees) is in between the minimum required (i.e., two elements: one for left and one for right) and the limit of direction perception on the torso (as shown by Van Erp, 2005, to be on the order of 10 degrees). The locations of the elements in the belt were also adjustable so they could easily be positioned in the direction of the cardinal and oblique axes, regardless of the body form of the subject. The waist belt was worn over the underclothing of the subject. The processing unit, sensors, and tactile display received their power from a rechargeable nickel metal hydride battery pack. The sensor pack, processing unit, and power supply had individual aluminum housings and options for integration with a backpack or battle dress uniform for example. To ensure a proper GPS receptance, the sensor pack should preferably be worn on the upper part of the torso. The processing unit could also be connected to a “breakout” box that contained connections for keyboard, mouse, video graphics array monitor, floppy drive, and ethernet and to a set of five control buttons that could be used to start and stop the equipment or to choose a route. The breakout box and the control buttons were disconnected during the actual experiment.
8
The update rate of the GPS unit was 1 Hz, but the system ran at 10 Hz or more. This means that the data from the digital compass could be used to signal a course deviation even without a GPS update on exact location. The processing unit calculated the heading and distance to the active waypoint and compared this with the position data of the GPS and the heading data of the compass. Only in cases when the heading data of the compass were not reliable (e.g., when tilted more than 15 degrees from horizontal) were the heading data from the GPS used. Since the GPS is based on a comparison of subsequent positions, the GPS data alone are not sufficient to (a) detect course changes without a changing location (e.g., when turning round one’s axis) and (b) provide feedback during fast course changes because of the 1-Hz update rate. Information about calculated waypoint heading and distance was provided with the scheme in table 4. Heading was coded in the location of vibration. To indicate that the distance to the waypoint was less than 50 m, the sensation changed from a single to a double click (i.e., two bursts of vibration). Furthermore, the middle vibrator had a lower rhythm than the other seven for the following two reasons: (a) to make it distinct from the others (as a redundant cue besides location), and (b) to lower the amount of tactile stimulation without losing confirmation that the system is working and the heading error is small. The values given in table 4 were based on several pilot studies. Table 4. Coding heading and distance on the tactile display. Vibrating location Distance > 50 m Middle vibrator (for headings within a 45-degree forward cone) Other vibrators (closest to the calculated heading) 15 < Distance Middle vibrator (for headings within < 50 m a 45-degree forward cone) Other vibrators (closest to the calculated heading) Distance = 15 m All
3.4
Vibrating rhythm 200 ms on – 1800 ms off 200 ms on – 800 ms off 100 ms on – 200 ms off – 100 ms on – 600 ms off 100 ms on – 100 ms off – 100 ms on – 200 ms off All on for 3 seconds
Sensation Single click every 2 seconds Single click every second 1 double click per second 2 double clicks per second Long buzz
Land Navigation Course
The experiment was conducted at the Fort Benning Primary Development Leadership Course. Three land navigation lanes were used, each approximately 1800 m in length. Each lane had three waypoints approximately 600 m apart. Each lane included rolling terrain, woodland, open areas, and dense undergrowth. 3.5
Questionnaires
Questionnaires were designed to elicit Soldiers’ opinions about their performance and experiences with each of the navigation devices. The questionnaires asked Soldiers to rate the devices on a 7-point rating scale. These questionnaires were administered to each Soldier at the completion of each of the PTN trials.
9
3.6 Procedures Each Soldier performed three land navigation record trials. The type of navigation system was counterbalanced with navigation route and order. A data collector assigned to each route followed each Soldier as he completed his route. Three Soldiers participated each day, completing three routes, one with each system. Three Soldiers could be run simultaneously since there were three equivalent land navigation routes. A total of 15 Soldiers completed their routes over a data collection period of one week. A land navigation leg ended when the Soldier (a) reached the waypoint, (b) moved 50 m beyond the waypoint without detecting it, or (c) moved 100 m away from the center of the lane in a lateral direction. 3.7
Measures
3.7.1 Time to Complete Land Navigation Course Trials After recording the start time, data collectors followed each Soldier on his route. They used a stopwatch to record time to each waypoint, pausing the stopwatch at each waypoint for data recording and GPS adjustments. 3.7.2 Mean Deviation From the Navigation Route Each data collector wore a commercial GPS system (Garmin E-Trex Legend C). The system enabled tracking of the Soldier’s route and comparison of Soldier’s route with the straight-line route. Deviations were not recorded unless they were more than 20 meters to the right or left of the centerline. In other words, the allowed course was 40 meters wide. The root mean square deviation was then calculated for each land navigation trial at 5-second intervals. 3.7.3 Waypoint Completion Data collectors noted whether Soldiers found each waypoint. If a Soldier deviated too far from the waypoint (100 m laterally or 50 m beyond), he was stopped by the data collector and led to the waypoint. 3.7.4 Timeliness and Accuracy of Response to Radio Communication Inquiries Experimenters at the control station were assigned to each navigation route and were provided with a list of infantry-context questions drawn from an infantry training manual. Questions were rated as easy or more difficult and were evenly assigned to one of three sets of questions. All questions were regarded by subject matter experts as operationally relevant, given the Soldier’s rank and experience. Question sets varied by route so that each set of questions was answered by each Soldier and was counterbalanced with device. Examples of questions include “Describe the maximum sustained rate of fire for the M4 rifle”; “What is an azimuth?”; “What is the first general order?”. The experimenters contacted the Soldiers on their routes every 60 seconds and asked a question from the list. Experimenters noted the time to answer and the accuracy of each answer. 10
3.7.5 Participant Evaluation of the Navigation Systems After Soldiers completed navigation routes with each system, they answered a questionnaire on the three navigation systems. Respondents rated their performance with each system (1- to 7point scale), effectiveness of various aspects of the systems, and relevance for various military operations. After they had used all systems, they rank ordered the three systems with regard to various aspects of performance and preference.
4. Results
4.1
PTN Performance
We predicted that the PTN system would enable Soldiers to reach land navigation waypoints and complete the land navigation routes. This hypothesis was supported. All of the waypoints were achieved with the PTN system. In comparison, 95.6% were reached with the PLGR, and 86.7% were reached with the compass system (see figure 3).
proportion waypoints found
1.00
.95
.90
.85
compass
PLGR
PTN
navigation system Figure 3. Proportion of waypoints found with each system.
4.2
Navigation Speed
4.2.1 Hypotheses 2 and 3 We predicted that the PTN system would enable land navigation more quickly than the compass system (HO2) and the PLGR system (HO3). Hypothesis 2 was supported, while Hypothesis 3
11
was not. Table 5 provides mean times for each system. A repeated measures analysis of variance (ANOVA) indicated that there were significant differences in mean course times for the three systems: F(2,28) = 28.2, p < 0.001, η2p = 0.67. Ensuing comparisons were done with Holm’s (1979) Bonferonni procedure to adjust for family-wise error rates. As shown in table 6, mean course times were significantly slower with the compass as compared to both the PLGR and the PTN. There was no significant difference between the PLGR and the PTN (see figure 4). Table 5. Summary statistics, course completion times, radio response times, and root mean square (rms) error. System
n
Course Times (Min:sec)
Response Times (sec)
rms error (m)
Mean
SD
Mean
SD
Mean
SD
Compass
15
36:48
5:21
9.13
4.22
13.3
12.0
PLGR
15
27:49
5:33
10.9
5.48
11.0
9.07
PTN
15
28:48
4:33
8.93
4.87
29.5
8.94
Table 6. Post hoc comparisons, mean total course times. Comparison
df
t
Required p
Obtained p
Compass versus PLGR
14
8.71
.017
< .001*
Compass versus PTN
14
5.08
.025
< .001*
PLGR versus PTN
14
0.78
.05
.448
*p < .05, two-tailed
time to complete the course (s)
800 750 700 650 600 550
Compass
PLGR
navigation system Figure 4. Time to complete the course with each system.
12
PTN
4.3
Communication Response
We predicted that the PTN system would enable Soldiers to respond more quickly than with the PLGR or compass system to communication requests. This was not supported. Table 7 provides mean response time to questions. A repeated measures ANOVA indicated that the differences among means were not significant (F 2, 28 = 1.37, p = 0.27, η2p = 0.09). Although differences were not statistically significant, mean values were ordered as expected, with PTN having the shortest time. Table 7. Mean time in seconds to respond to radio-based requests for information. System Compass PLGR PTN
4.4
Mean 9.1302 10.8899 8.9355
SD 4.21859 5.47666 4.86916
N 15 15 15
Navigation Flexibility (re-routing)
We predicted that the PTN system would enable Soldiers to re-route to avoid terrain obstacles and still achieve waypoints. This hypothesis was supported. Table 8 provides the mean deviation from route course for each system. The PTN system had a much higher average squared deviation from the course, yet waypoint achievement was 100%, and time to achieve waypoint was faster than the compass system and as fast as the GPS (see figure 5). Differences in deviation scores were significant with a repeated measures ANOVA: F(2,28) = 17.6, p < 0.001, η2p = 0.56. Post hoc comparisons indicate significant differences between the PTN and other systems but not between the compass and PLGR (see table 9). Table 8. Root mean squared deviations from land navigation routes for each system. System Compass PLGR PTN
Mean 13.28 11.01 29.52
SD 12.02 9.08 9.94
N 15 15 15
Table 9. Holm’s Bonferonni comparisons of root mean squared deviations. Comparison
t
df
required p
obtained p
PTN-Compass
5.31
14
0.025
< .001*
PTN-PLGR
5.59
14
0.0167
< .001*
Compass-PLGR
0.60
14
0.05
0.56
*p < .05, two-tailed
13
35 30
RMSE (m)
25 20 15 10 5 0
Compass
PLGR
PTN
navigation system Figure 5. Mean deviation from navigation course.
4.5
Analysis of Walking Speed
The PTN system was associated with greater course deviations than the other systems. This is probably because obstacles were more easily avoided with the PTN. These deviations from course were accomplished in times that averaged equal to the PLGR and were significantly faster than the compass system. This raised the possibility that the PTN system was associated with greater distance walked and faster walking speed. Table 10 shows the mean distance (kilometers) that the Soldiers walked using each of the three navigation systems. The route distances were corrected for obvious errors in GPS tracking (e.g., a track that indicates that a Soldier walked more than 100 m through heavy underbrush in 5 seconds.) A repeated measures ANOVA yielded a significant difference among the mean distances: F(2,28) = 3.50, p = 0.044, η2p = 0.20. However, post hoc comparisons using Holm’s Bonferonni correction for family-wise error (see table 12) did not yield any significant pairwise differences. Table 10. Distance walked (km). System PTN Compass PLGR
n 15 15 15
Mean 2.05 1.96 1.89
SD 0.19 0.15 0.10
The speed of land navigation (km/hr) is summarized in table 11. A repeated measures ANOVA yielded a significant difference among the mean distances: F(2,28) = 24.6, p < 0.001, η2p = 0.64. As shown in table 12, post hoc comparisons indicate that Soldiers were significantly slower when
14
using the compass than when using either the PTN or PLGR. There was no significant difference in the mean speeds with the PTN and PLGR. Table 11. Speed of navigation (km/hr). System PTN Compass PLGR
n 15 15 15
Mean 4.34 3.25 4.19
SD 0.65 0.41 0.65
Table 12. Post hoc comparisons, speed of navigation (km/hr). Comparison
t
df
required p
obtained p
PTN versus Compass
5.79
14
0.025
< .001*
PTN versus PLGR
0.94
14
0.05
0.365
Compass versus PLGR
6.27
14
0.0167
< .001*
*p < .05, 2-tailed
4.6
Participant Evaluations of the PTN System
4.6.1 Self-Evaluation of Performance First, Soldiers rated (1- to 7-point scale) how they thought they performed using each system (1 = not at all; 2 = slight; 3 = novice; 4 = OK; 5 = good; 6 = very good; 7 = expert). Mean ratings were highest for the PLGR (mean = 6.27, SD = 0.79), and the PTN (mean = 6.13, SD =. 0.91), with compass having the lowest ratings (mean = 5.47, SD = 1.25). Differences based on a repeated measures ANOVA were significant (F 2,28 = 3.89; p = 0.03, η2p = 0.22). However, post hoc comparisons (Holmes-Bonferonni) did not reach significance, although two comparisons (compass versus others) approached significance (actual p = 0.034 and 0.036; required p = 0.0167 and 0.025). 4.6.2 Ratings of PTN Characteristics Ratings of PTN characteristics were all high, ranging from 5.80 to 6.46 (1- to 7-point scale; see table 13). Table 13. Mean ratings of PTN attributes. Dimension Simple to learn Simple to use Can feel each tactor Which tactor buzzed Ease of following direction Accuracy of guidance Usefulness of guidance Overall ease of use
n 15 15 15 15 15 15 15 15
15
Mean 6.46 6.33 6.26 6.40 6.26 5.80 6.13 6.46
SD 0.63 1.11 0.70 0.73 0.79 1.20 0.83 0.74
4.6.3 Rank Order of Systems Soldiers were asked to rank order the systems to indicate preference along a number of characteristics. While this type of assessment has some psychometric problems, it is intuitive to the Soldier. The Soldiers were also requested to explain their rank orders. One Soldier did not provide valid ranking data. Table 14 provides the percentage of Soldiers giving the highest rank to each system on each of five dimensions. The rankings were approximately equivalent for the three systems in terms of accuracy of navigation. On the other four dimensions (situational awareness, speed of navigation, overall ease of use, and preferred system), Soldiers clearly preferred the PTN to the other two systems. Situational awareness was understood to be awareness of surroundings. Table 14. Percent of Soldiers awarding the highest rank. Quality Accuracy of Navigation Situation Awareness Speed of Navigation Overall Ease of Use Preferred System
Compass 26.7 0 0 26.7 20
PLGR 33.3 13.3 20 0 26.7
PTN 33.3 80 73.3 66.7 46.7
4.6.4 Operational Relevance Table 15 provides mean ratings for the PTN system for operational relevance for difference missions. Ratings were all high, ranging from 5.64 to 6.64 (1- to 7-point scale). Table 15. Usefulness of PTN for mission operations. Task Night Operations MOUT Operations Reconnaissance Sustained Operations Operations in enemy territory
4.7
n 14 14 14 14 14
Mean 6.64 5.64 5.71 6.14 6.07
SD 0.49 1.21 1.20 1.02 0.99
Participant Comments
Participants provided many comments in response to various issues. The following subsections summarize responses to various questions. 4.7.1 Comments Regarding What Soldiers Liked Best About the PTN System Soldiers emphasized ease of use (six Soldiers) and the hands-free aspect (seven Soldiers). Soldiers also noted accuracy and attention management, along with general positive remarks (e.g., “I like everything about the system”).
16
4.7.2 Comments Regarding How the System Could be Improved Soldiers suggested improvements such as stronger vibrations, an elasticized belt, a wireless system, more tactors, increased durability, and smaller size. 4.7.3 Comments Regarding Accuracy of Navigation for Each System Soldiers were generally positive about the PTN system. Some Soldiers rated the PLGR or the compass as more accurate. This is consistent with PTN function since the PTN is less accurate when far away from the waypoint, and the Soldier can wander a bit off the straight-line course before getting correction feedback. Thus, the route walked is slightly zig-zag at first, which results in less precision early in the route and more accuracy as the Soldier approaches the waypoint. Soldiers cautioned that they should always know how to use the compass in case the GPS technology fails. 4.7.4 Comments Regarding Situational Awareness Soldiers were particularly appreciative of the hands-free and eyes-free aspects of the PTN. They reported greater situational awareness and capability to look at surroundings and respond to other distracters. They did not have to constantly refer to the compass or PLGR, nor did they have to keep a pace count, as with the compass system. Comments included remarks such as “all you have to do is walk,” “you don’t worry about navigation,” “you don’t have to always look at the compass or PLGR,” “not confusing,” “allows you to look around and walk around things,” and “needs no concentration”. 4.7.5 Comments Regarding Speed of Navigation On average, Soldiers walked more quickly with the PTN since they deviated more within their route while maintaining course completion times as fast as the PLGR and faster than the compass. This was reflected in some of their remarks, such as “the PTN is good because you could run without stopping,” and “I was moving at a fast pace”. 4.7.6 Comments Regarding How Technology Would be Used Soldiers reported several uses for the PTN technology, including reconnaissance, training, combat, rescue, urban terrain, night operations, and in civilian markets for outdoor sportsmen.
5. Discussion The goal of this preliminary investigation was to ascertain the extent to which the PTN tactile navigation system functions in an operational context that includes multi-tasking and long routes, situated in relatively rough terrain. We also wanted comparisons of performance using the
17
traditional compass system and the Army PLGR system. Because the compass and PLGR systems require at least occasional visual monitoring, it was predicted that the PTN system would compare favorably to these systems, particularly in a multi-tasking context. In addition, because the PTN system provides constant feedback regarding waypoint direction, regardless of Soldier location and orientation, it was predicted that the Soldiers could more easily avoid terrain obstacles (e.g., fallen trees, dense undergrowth, muddy areas) and still achieve their waypoints. Our first hypothesis was supported. The PTN system enabled Soldiers to reach 100% of the land navigation waypoints. In comparison, 95.6% were reached with the PLGR, and 86.7% were reached with the compass system. We also predicted that the PTN system would enable Soldiers to accomplish land navigation more quickly than with the compass and the PLGR system. Results demonstrated that Soldiers had faster performance with both the PTN and PLGR systems, relative to the compass system. The difference in times between the PTN and PLGR were not significant. Soldiers using the compass system were slower, and this is probably because of two reasons. First, they navigate by using the compass to ascertain a visual waypoint with the assigned azimuth information. They do this by stopping and holding the compass steady and parallel to the ground, so they can identify a visual waypoint consistent to the azimuth direction. Soldiers tend to do this rather often when their visual waypoint is not that distant. Given the dense terrain, it would be necessary to do this several times, even if one were very experienced. The process requires both hands and eyes, and audio communications may have interfered with this process more so than it did with the PLGR system. The second reason for longer times is likely the need for the Soldier to keep a pace count in his head, to know how far he has traveled and how far he needs to go. Additionally, Soldiers must be aware of their individual pace count for a 100-meter distance. Pace count is not as reliable in hilly or heavily vegetated terrain because of the shorter steps required to navigate both. Audio communication is likely to interfere with that as well. A couple of Soldiers had a cord with beads that they moved as they traveled, with each bead representing 100 meters, as an aid for the pace count. Another Soldier shifted coffee beans from one hand to the other to mark each 100 meters. Soldiers were faster in both the PLGR and PTN conditions. This was inconsistent with our expectation that Soldiers would be slowed by audio communications when using systems that required handling and visual attention. It is likely that the PLGR did not require as much attention as the compass systems because there is no requirement to keep a pace count and no need for visual targeting and monitoring of a visual target. There is also no need to stop moving to monitor the PLGR, whereas the compass requires the Soldier to stop and hold it steady. In fact, the PLGR requires the Soldier to keep moving when using it. Thus the Soldier can move forward and check his location and direction at any time with the PLGR, so that the task is easier to coordinate with the audio communications tasks. Therefore, the audio communications did not interfere as much as we first thought.
18
Soldiers did report the perception of moving faster with the PTN, and this is likely attributable to their ability to move off course and back on course with little trouble. This enabled them to avoid terrain obstacles. Given that they completed the routes as quickly as the PLGR condition and yet deviated off course more, this would result in a higher speed, even if total time were the same. The PTN system had a much higher average squared deviation from the course, yet waypoint achievement was 100%, and time to achieve waypoint was faster than with the compass system and as fast as the PLGR. We expected that the PTN system would enable Soldiers to respond more quickly to communication requests. This was not supported. We measured the time to respond to the communication request and found no differences among system conditions. However, we did not measure the time it took to “answer the phone,” that is, the time for the Soldier to acknowledge the initial communication. Soldiers may have delayed that initial response until they were prepared to reply once the request was given. However, it is also likely that the communication task did not interfere to the degree we expected. The communication task required some handling (i.e., of the radio) and some cognitive demand (comprehension, recall, communication) so that although workload may have been increased, there was no conflict for the same channel (e.g., audio versus visual) and the coordination of tasks may not have been that difficult. A better task for eliciting workload task conflict is likely to be target detection. A target detection task requires constant visual scanning, which can interfere with visual land navigation. We plan to use such a task in an ensuing study. We also plan to include additional systems, such as systems that display the GPS information on helmet-mounted and wristmounted displays. Feedback from Soldier evaluations of the PTN system was uniformly positive. Ratings indicated high levels of appreciation for system concepts, system functioning, and military relevance. Suggestions for improvements were also provided with regard to fit, weight, and simplicity of programming GPS points. It would be particularly useful if there were a visual component of the system that would allow Soldiers to know the distance to the next waypoint. Although the PTN system used in this investigation provided information about direction and feedback when the Soldier was approaching the waypoint (e.g., within 50 and 15 meters), other systems provide more instructive indicators of distance in terms of distance from the Soldier to the waypoint. In waypoint navigation on land, two parameters are important: direction and distance. Direction information alone could be sufficient in case the waypoint can be easily identified when reached, as was the case in this study. Otherwise, distance information is essential. Furthermore, distance information may be important if specific preparations are required just before Soldiers reach the waypoint. The design of a tactile waypoint navigation display requires finding an optimal translation of direction and distance into a tactile “picture”. Changing the location of vibration is one way to code spatial information such as direction.
19
The Soldiers also suggested the system be integrated with a visual GPS system such as the PLGR. This is a very relevant issue. We are more or less convinced that for a tactile display to be acceptable, it should be a multi-function display. If it is only used to provide navigation information, it is not worth the additional costs for Soldiers to take it with them. In addition, any tactile system should be fully integrated with Soldier information systems. Ideally, information analyses should be conducted to optimize allocation of the different forms of information over the sensory channels that a Soldier has at his disposal. A related issue regards integration with communication systems. Soldiers indicated that it would be very useful if the system could support tactile communications, that is, if Soldiers could “send” tactile messages to each other such as “enemy contact”. Besides allowing hands-free and eyes-free operation, a tactile display also enables covert communication which is of great military relevance.
6. Conclusions and Recommendations In general, preliminary results were consistent with MRT and supported the rationale for ensuing investigations in other contexts and task demands. The PTN tactile system demonstrated effectiveness equal to or better than current Army navigation systems. Soldiers were enthusiastic about the concept, the PTN system performance, and potential military applications, emphasizing the benefit of a system that is “hands free, eyes free, and mind free”. The difference in performance between the PLGR system and the compass system demonstrates the importance of systematic cognitive task analyses of each particular system. Although this study focused on off loading of workload through the use of a different information channel, there are differences among the visual information systems. Although the PLGR and compass systems use visual information processing, the compass system has additional cognitive workload because the Soldier must keep a pace count to estimate the distance s/he walked. This information was displayed easily in the PLGR display, and navigation performance with the PLGR was better than with the compass. In fact, it is likely that a “ceiling effect” was reached by Soldiers when they used the PLGR and PTN system in that they can only go as fast as the terrain and physical capability allow. It is very likely that changes in workload and environmental conditions will differentiate further the difference in task workload associated with the PTN tactile versus the PLGR system. According to MRT theory, interference by information channel, visual requirements, or level of processing will affect performance when workload is high. Further research will be conducted that will add target detection tasks that Soldiers are often expected to perform. This will cause further interference with the visual channel, which should more negatively affect navigation with the PLGR. In addition, the Soldiers will be expected to mark targets with a laser mounted on 20
their weapons. This is also a typical task, which may distinguish the “hands-free” nature of the tactile system. In addition, we will conduct the study during night to distinguish systems on the basis of visual demand. Finally, we will be comparing the tactile and PLGR systems with a different visual display: a “heads-up” map display that provides more easily interpreted information regarding location and distance. This study has the limitations inherent in an operational field study. However, it demonstrates the application and relevance of theory as it is applied to predict performance in a very realistic and demanding operational setting. Future studies will include additional measures to assess workload and situational awareness. The current study lacked these measures, which would have been more sensitive to aspects of task demands. For ensuing studies, Soldiers will be requested, while on route, to estimate their general location with regard to how far they have traveled and where they are located relative to waypoints. This will enable better delineation of relationships among task demands, workload, and performance. Ensuing studies will pursue questions pertaining to reduced visibility (e.g., fog, darkness) and comparison to a more intuitive visual map display.
21
7. References Boles, D. B. Multiple resources. In W. Karwowski (Ed.), International Encyclopedia of Ergonomics and Human Factors. Taylor & Francis, 271-275, 2001. Bosman, S.; Groenendaal, B.; Findlater, J. W.; Visser, T.; De Graaf, M.; Markopoulos, P. GentleGuide: An Exploration of Haptic Output for Indoors Pedestrian Guidance. In Proceedings of the Mobile HCI, Udine, Italy, 2003. Chiasson, J.; McGrath, B.; Rupert, A. Enhanced Situation Awareness in Sea, Air, and Land Environments; DTIC Technical Report; Naval Aerospace Medical Research Laboratory: Pensacola, FL, 2003. Dobbins, T.; Samways, S. The Use of Tactile Navigation Cues in High-Speed Craft Operations. Proceedings of the RINA Conference on High Speed Craft: Technology and Operation. London: The royal Institution of Naval Architects, pp 13-20, 2002. Gilliland, K.; Schlegel, R. E. Tactile Stimulation of the Human Head for Information Display. Human Factors 1994, 36 (4), 700-717. Holm, S. A Simple Sequentially Rejective Multiple Test Procedure. Scandanavian Journal of Statistics 1979, 6, 65-70. Hopp, P.J.; Smith, C.A.R.; Clegg, B.A.; Heggestad, E.D. Interruption Management: The Use of Attention-Directing Tactile Cues. Human Factors 2005, 47 (1), 1-11. Keller, J. Human Performance Modeling For Discrete-Event Simulation: Workload. Proceedings of the 2002 Winter Simulation Conference. E Yucesan, C. Chen, J. Snowdon, & J. Charnes (Eds.), 2002. McGrath, B. J.; Estrada, A.; Braithwaite, M. G.; Raj, A. K.; Rupert, A. H. Tactile Situation Awareness System Flight Demonstration Final Report; Rep. No. 2004-10; Naval Aerospace Medical Research Laboratory: Pensacola, FL, 2004. Mitchell, D.; Samms, C.; Glumm, M.; Krausman, A.; Brelsford, M.; Garrett, L. Improved Performance Research Integration Tool (IMPRINT) Model Analyses in Support of the Situational Understanding as an Enabler for Unit of Action Maneuver Team Soldiers Science and Technology Objective (STO) in Support of Future Combat Systems (FCS); U.S. Army Research Laboratory: Aberdeen Proving Ground, MD, 2004. Raj, A.; Kass, S.; Perry, J. Vibro-Tactile Displays for Improving Spatial Awareness. In Proceedings of the Human Factors and Ergonomics Society Annual Meeting, pp 181-184, Santa Monica, CA: Human Factors and Ergonomics Society, 2000.
22
Raj, A. K.; McGrath B. J.; Rochlis, J. L.; Newman, D. J.; Rupert, A. H. The Application of Tactile Cues to Enhance Situation Displays. Proceedings for the Third Annual Symposium and Exhibition on Situational Awareness in the Tactical Air Environment 1998, 2-3, 77-84. Rochlis, J. L.; Newman, D. J. A Tactile Display for International Space Station (ISS) Extravehicular Activity (EVA). Aviation, Space, and Environmental Medicine 2000, 71 (6), 571-578. Rupert, A. H. An Instrumentation Solution for Reducing Spatial Disorientation Mishaps. IEEE Engineering in Medicine and Biology 2000a, 19, 71-80. Rupert, A. H. Tactile Situation Awareness System: Proprioceptive Prostheses for Sensory Deficiencies. Aviation, Space, and Environmental Medicine 2000b, 71 (9), A92-A99. Sarter, N. B. The Need for Multisensory Feedback in Support of Effective Attention Allocation in Highly Dynamic Event-Driven Environments: The Case of Cockpit Automation. International Journal of Aviation Psychology 2000, 10 (3), 231-245. Sarter, N. B. Human Technology Interface: Multimodal Communication in Support of Coordinative Functions in Human-Machine Teams. Journal of Human Performance in Extreme Environments 2001, 5 (2) 50-54. Sarter, N. B. Multimodal Information Presentation in Support of Human-Automation Communication and Coordination; In E. Salas (Ed.) Advances in Human Performance and Cognitive Engineering Research, 13-36. New York: JAI Press, 2002. Sklar, A.; Sarter, N. B. Good Vibrations: Tactile Feedback in Support of Attention Allocation and Human Automation Coordination in Event-Driven Domains. Human Factors 1999, 41 (4), 543-552. Van Erp, J.B.F. Tactile Navigation Display. In: S. Brewster, R. Murray-Smith (Eds.): Haptic Human-Computer Interaction; Lecture Notes in Computer Science, pp. 165-173; Springer Verlag, 2001. Van Erp, J.B.F. Guidelines for the Use of Vibro-Tactile Displays in Human Computer Interaction. Proceedings of Eurohaptics 2002 (pp. 18-22). Eds. S.A. Wall, B. Riedel, Crossan, A. & McGee, M.R. Edinburgh:University of Edinburgh, 2002. Van Erp, J.B.F. Presenting Directions With a Vibro-Tactile Torso Display. Ergonomics 2005, 48, 3, 22, 302-313. Van Erp, J.B.F.; Van Veen, H.A.H.C. A Multi-purpose Tactile Vest for Astronauts in the International Space Station. Proceedings of Eurohaptics 2003. Dublin Ireland: Trinity College, pp. 405-408, 2003.
23
Van Erp, J.B.F.; Van Veen, H.A.H.C. Vibro-Tactile In-Vehicle Navigation System. Transportation Research part F: Human Factors 2004, 7, 247-256. Van Erp, J.B.F.; Veltman, J. A.; Van Veen, H.A.H.C.; Oving, A. B. Tactile Torso Display as Countermeasure to Reduce Night Vision Goggles Induced Drift. In: Spatial Disorientation in Military Vehicles: Causes, Consequences and Cures. RTO Meeting Proceedings 86, pp. 49-1 - 49-8. Neuilly-sur-Seine Cedex, France: NATO RTO, 2003. Van Erp, J.; Verschoor, M.H. Uni- and Cross-Modal Tracking of Visual and Vibro-tactile Stimulus; DTIC technical report; Human Factors Research Inst TNO: Soesterberg, Netherlands, 2000. Van Erp, J.; Vogels, I. Vibro-tactile Perception: A literature review; DTIC Technical Report; Human Factors Research Inst TNO: Soesterberg, Netherlands, 1998. Van Erp, J.B.F.; Werkhoven, P. W. Vibro-tactile and visual asynchronies: Sensitivity and consistency. Perception 2004, 33, 103 -111. Van Veen, H.A.H.C.; Spapé, M.; Van Erp, J.B.F. Waypoint Navigation on Land: Different Ways of Coding Distance to the Next Waypoint. Proceedings of Eurohaptics 2004, pp 160165. München, Germany: Technische Universität, 2004. Wickens, C. D. Engineering psychology and human performance (2nd ed.); New York, NY: HarperCollins, 1992. Wickens, C. D. Multiple resources and performance prediction. Theoretical Issues in Ergonomics Science 2002, 3 (2), 159-177. Wickens, C. D.; Hollands, J. G. Attention, timesharing, and workload. Chapt. 11 in Engineering Psychology and Human Performance. NY: Prentice Hall, 2000.
24
NO. OF COPIES
NO. OF COPIES
ORGANIZATION
1 DEFENSE TECHNICAL (PDF INFORMATION CTR ONLY) DTIC OCA 8725 JOHN J KINGMAN RD STE 0944 FORT BELVOIR VA 22060-6218 1
1
1
1
2
1
1
1
ORGANIZATION
1
ARMY RSCH LABORATORY - HRED ATTN AMSRD ARL HR MD T COOK BLDG 5400 RM C242 REDSTONE ARSENAL AL 35898-7290
1
COMMANDANT USAADASCH ATTN ATSA CD ATTN AMSRD ARL HR ME MS A MARES 5800 CARTER RD FT BLISS TX 79916-3802
1
ARMY RSCH LABORATORY - HRED ATTN AMSRD ARL HR MI J MINNINGER BLDG 5400 RM C242 REDSTONE ARSENAL AL 35898-7290
1
ARMY RSCH LABORATORY - HRED ATTN AMSRD ARL HR MM DR V RICE BLDG 4011 RM 217 1750 GREELEY RD FT SAM HOUSTON TX 78234-5094
1
DIRECTOR US ARMY RESEARCH LAB AMSRD ARL CI OK TL 2800 POWDER MILL RD ADELPHI MD 20783-1197
ARMY RSCH LABORATORY - HRED ATTN AMSRD ARL HR MG R SPINE BUILDING 333 PICATINNY ARSENAL NJ 07806-5000
1
DIRECTOR US ARMY RESEARCH LAB AMSRD ARL CS OK T 2800 POWDER MILL RD ADELPHI MD 20783-1197
ARL HRED ARMC FLD ELMT ATTN AMSRD ARL HR MH B STERLING BLDG 1467B ROOM 336 THIRD AVENUE FT KNOX KY 40121
1
ARMY RSCH LABORATORY - HRED AVNC FIELD ELEMENT ATTN AMSRD ARL HR MJ D DURBIN BLDG 4506 (DCD) RM 107 FT RUCKER AL 36362-5000
1
ARMY RSCH LABORATORY - HRED ATTN AMSRD ARL HR MK MR J REINHART 10125 KINGMAN RD FT BELVOIR VA 22060-5828
1
ARMY RSCH LABORATORY - HRED ATTN AMSRD ARL HR MV HQ USAOTC S MIDDLEBROOKS 91012 STATION AVE ROOM 111 FT HOOD TX 76544-5073
1
ARMY RSCH LABORATORY - HRED ATTN AMSRD ARL HR MY M BARNES 2520 HEALY AVE STE 1172 BLDG 51005 FT HUACHUCA AZ 85613-7069
US ARMY RSRCH DEV & ENGRG CMD SYSTEMS OF SYSTEMS INTEGRATION AMSRD SS T 6000 6TH ST STE 100 FORT BELVOIR VA 22060-5608 INST FOR ADVNCD TCHNLGY THE UNIV OF TEXAS AT AUSTIN 3925 W BRAKER LN STE 400 AUSTIN TX 78759-5316 DIRECTOR US ARMY RESEARCH LAB IMNE ALC IMS 2800 POWDER MILL RD ADELPHI MD 20783-1197
ARMY RSCH LABORATORY - HRED ATTN AMSRD ARL HR M DR M STRUB 6359 WALKER LANE SUITE 100 ALEXANDRIA VA 22310 ARMY RSCH LABORATORY - HRED ATTN AMSRD ARL HR MA J MARTIN MYER CENTER RM 2D311 FT MONMOUTH NJ 07703-5630 ARMY RSCH LABORATORY - HRED ATTN AMSRD ARL HR MC A DAVISON 320 MANSCEN LOOP STE 166 FT LEONARD WOOD MO 65473-8929
25
NO. OF COPIES
NO. OF COPIES
ORGANIZATION
1
ARMY RSCH LABORATORY - HRED ATTN AMSRD ARL HR MP D UNGVARSKY BATTLE CMD BATTLE LAB 415 SHERMAN AVE UNIT 3 FT LEAVENWORTH KS 66027-2326
1
ARMY RSCH LABORATORY - HRED ATTN AMSRD ARL HR M DR B KNAPP ARMY G1 MANPRINT DAPE MR 300 ARMY PENTAGON ROOM 2C489 WASHINGTON DC 20310-0300
1
1
ORGANIZATION ARMY RSCH LABORATORY - HRED ATTN AMSRD ARL HR MN R SPENCER DCSFDI HF HQ USASOC BLDG E2929 FORT BRAGG NC 28310-5000 ABERDEEN PROVING GROUND
ARMY RSCH LABORATORY - HRED ATTN AMSRD ARL HR MJK MS D BARNETTE JFCOM JOINT EXPERIMENTATION J9 JOINT FUTURES LAB 115 LAKEVIEW PARKWAY SUITE B SUFFOLK VA 23435
1
ARMY RSCH LABORATORY - HRED ATTN AMSRD ARL HR MQ M R FLETCHER US ARMY SBCCOM NATICK SOLDIER CTR AMSRD NSC SS E BLDG 3 RM 341 NATICK MA 01760-5020
1
ARMY RSCH LABORATORY - HRED ATTN AMSRD ARL HR MT DR J CHEN 12350 RESEARCH PARKWAY ORLANDO FL 32826-3276
1
ARMY RSCH LABORATORY - HRED ATTN AMSRD ARL HR MS MR C MANASCO SIGNAL TOWERS RM 303A FORT GORDON GA 30905-5233
1
ARMY RSCH LABORATORY - HRED ATTN AMSRD ARL HR MU M SINGAPORE 6501 E 11 MILE RD MAIL STOP 284 BLDG 200A 2ND FL RM 2104 WARREN MI 48397-5000
1
ARMY RSCH LABORATORY - HRED ATTN AMSRD ARL HR MF MR C HERNANDEZ BLDG 3040 RM 220 FORT SILL OK 73503-5600
10
ARMY RSCH LABORATORY - HRED ATTN AMSRD ARL HR MW E REDDEN BLDG 4 ROOM 332 FT BENNING GA 31905-5400
26
1
DIRECTOR US ARMY RSCH LABORATORY ATTN AMSRD ARL CI OK TECH LIB BLDG 4600
1
DIRECTOR US ARMY RSCH LABORATORY ATTN AMSRD ARL CI OK TP S FOPPIANO BLDG 459
1
DIRECTOR US ARMY RSCH LABORATORY ATTN AMSRD ARL HR MR F PARAGALLO BLDG 459