Last.fm as our experiment platform and explore how to use an improved visualization to support the semantic .... Only one user looked for music by ... ing semantically similar tags, such as favorite and favorites, rock and roll and rock n roll. This.
TagClusters: Enhancing Semantic Understanding of Collaborative Tags
Ya-Xi Chen1, Rodrigo Santamaría2, Andreas Butz1, Roberto Therón2 1 Media Informatics, University of Munich, Germany 2 Department of Informatics and Automatics, University of Salamanca, Spain
ABSTRACT Many today’s online communities use TagClouds, an aesthetic and easy to understand visualization, to represent popular tags collaboratively generated by their users. However, due to the free nature of tagging, such collaborative tags have some linguistic problems and certain other intrinsic limitations, such as high semantic density. Moreover, the alphabetical order of TagClouds poorly supports a hierarchical exploration among tags. This paper presents an exploration to support semantic understanding of collaborative tags beyond TagClouds. Based on the results of our survey on people’s practical usages of collaborative tags, we developed a visualization named TagClusters, in which tags are clustered into different groups, with font size representing tag popularity and the spatial distance indicating the semantic similarity between tags. The subgroups in each group and the overlap between groups are highlighted, thus illustrating the underlying hierarchical structure and semantic relations between groups. We conducted a comparative evaluation with TagClouds and TagClusters based on the same tag set. We received overall positive feedback on TagClusters and the results confirmed the advantage of TagClusters in facilitating browsing, comparing and comprehending semantic relations between tags. In future work, besides supporting semantic browsing, we will explore other usages of TagClusters, such as tag suggestions or tag-based Information Retrieval. Keywords: Improvement of TagClouds, collaborative tagging, user-contributed tags, visualization of tags, semantic analysis. INTRODUCTION The advent of the next-generation Web has tremendously influenced our ways of dealing with online digital items. In today’s online communities, people are allowed to sharing their content and access others’ in turn. They are also encouraged to make contributions by tagging these digital items. The most representative websites are YouTube (http://www. youtube.com) for video sharing, Flickr (http://www.flickr.com/) for photo sharing, and the online music community Last.fm (http://www.last.fm). The general goal of making online search and browsing easier is the main motivation for tagging. Besides facilitating personal organizing, browsing and searching online items, such collaborative tags also help to discover new items, acquire knowledge and derive insights users may be not aware of before. Currently, there are two main usages of collaborative tags. Users can use tags to conduct a keyword-based search to seek information on the web. Comparing tags generated by single users, large quantities of collaborative tags convey public interests and opinions in a general level. Therefore, TagClouds, a visualization for the most popular tags, has become a fashion in many
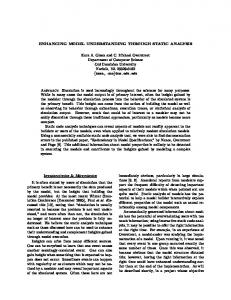
websites. Although TagClouds is widely used, it still has some intrinsic limitations. Many researchers have already noticed this and dedicate to improve its effectiveness by proposing more aesthetical representations or providing a better semantic understanding. In this paper, we take Last.fm as our experiment platform and explore how to use an improved visualization to support the semantic understanding of collaborative tags. We are specifically interested in the hierarchical structures and relationships among tags, which might lead to more successful tag recommendation and visualization-based music retrieval. In the remaining parts of this paper, TagClouds and their related work will first be discussed. Based on a survey among Last.fm users, some possibilities to improve semantic understanding beyond TagClouds will be explored. Finally, a prototype named TagClusters and its evaluation will be presented. The discussions on the evaluation results and future work will conclude this paper. TAGCLOUDS TagClouds is a visualization of popular tags (see Figure 1). In this visualization, tags are normally ordered alphabetically, with font size representing their popularity. Additional information, such as recency can be illustrated with color lightness. Comparing with tags generated by single users, these popular tags in TagClouds have a higher degree of generality and accuracy. Such visualization facilitates quickly foraging an overall impression of the most popular items, and thus conveys the general interests among a large audience (Viégas & Wattenberg, 2008), (Hearst 2008), (Hearst & Rosner, 2008). TagClouds can be also used for keyword-based search by selecting one or multiple tags as input. Figure 1. TagClouds in Last.fm
LIMITATIONS OF TAGCLOUDS In most online communities, users are allowed to generate tags freely, without any restriction or quality control. This low usage barrier has attracted hundreds of millions users. However, due to the free nature of tagging, some problems are inevitable with these collaborative tags (Li, Bao, Yu, Fei & Su, 2007), (Hassan & Herrero, 2006). Linguistic problems Nielsen (2007) and Begelman, Keller and Smadja (2006) discovered educational and cultural background influence people’s understanding of tags, which is one of the reasons for tag incon-
sistency among different users. With no input restrictions, two general problems are hardly to avoid from the users’ perspective (Wu, Zhang & Yu, 2006): Synonymy, which is also termed as “inter-indexer inconsistency” by Nielsen (2007), appears when different terms are used to describe the same item. A term with several different meanings brings ambiguity (Mathes, 2008), which may reduce the precision of the retrieval results. Visual bias In TagClouds the font size of tags is determined by their usage frequency, and popular tags with larger font size naturally draw more visual attention. It is easy to catch the most prominent topics, but on the other hand it also leads to a problem of visual bias: Tags with larger font size tend to dominate the visual attention of the whole visualization and other less important items with smaller size tend to be visually ignored (Hassan & Herrero, 2006), (Begelman, Keller & Smadja, 2006) and (Hearst & Rosner, 2008). Moreover, small font size also makes the comparison of tags difficult (Hearst and Rosner, 2008). Poor semantic understandability Alphabetical order is one of the main features of TagClouds, which is an efficient assistance to ease the finding of tags. On the other hand it poorly supports a semantic exploration. Hearst and Rosner (2008) discovered in their user study that a significant proportion of participants did not even notice this alphabetical arrangement. Users also had difficulties to derive the underlying semantic relations among tags, and some of them misinterpreted the spatial distance between tags as their semantic relatedness. Therefore TagClouds is concluded as not appropriate to supporting understanding of structure and relations, which is also supported by Hassan and Herrero (2006). IMPROVEMENTS OF TAGCLOUDS Recently many researchers have started to improve TagClouds by enhancing their aesthetic appearance or supporting their semantic understanding. Aesthetic enhancements Since several factors influence the effectiveness of TagClouds, such as font size and weight, some systems have already allowed the user to adjust these parameters, for example in PubCloud (Kuo, Hentrich, Good & Wilkinson, 2007). Some algorithms have been introduced to improve the quality of TagClouds by packing the text in the visualization tighter. Kaser and Lemire (2007) used Electronic Design Automation (EDA) to improve the arrangement of TagClouds by avoiding large unused white space. Seifert, Kump and Kienreich (2008) presented a series of algorithms to display tags in arbitrary convex polygons with a self-adapting font size. A circular layout was developed in (Bielenberg & Zacher, 2005), in which both font size and distance to the center represent tag importance. It was claimed in (Lohmann, Ziegler & Tetzlaff, 2009) that sequential layout with alphabetical sorting is suitable for finding a specific tag, while a thematically clustered layout can facilitate finding tags which belong to a certain topic. Supporting semantic understanding
In (Shaw, 2008) tags were visualized as a graph, in which length of edge represents similarity. TagOrbitals (Kerr, 2008) displays relevant tags in an atom metaphor, in which each primary tag was placed in the center, and other related tags were placed in surrounding bands. The main problem with this visualization is the varying orientation of texts. Clustering algorithms were applied to gather semantically similar tags. In (Hassan & Herrero, 2006) the k-means algorithm was applied to group semantically similar tags. Similar work can be found in (Provost, 2008). Li, Bao, Yu, Fei and Su (2007) supported browsing large scale social annotations based on an analysis of semantic and hierarchical relations. The user’s profile and the temporal dimension can be integrated for personalized or time-related browsing (Nielsen, 2007). Most of the methods discussed above are static visualizations and lack interaction. The semantic representation should be further explored, which will help the user to form a better understanding of hierarchical structure and relations. PRACTICAL TAG USAGE IN LAST.FM As discussed above, TagClouds have distinct linguistic problems and poorly support the understanding of structure and relationships among tags. In this paper, we have chosen the tags in Last.fm as the experimental platform. It allows users to tag music-relevant information, such as tracks, albums and artists. These tags can then be used to produce a TagClouds (see Figure 1). The user can search with these collaboratively generated tags, and Last.fm will return a page with the retrieval results, in which relevant tags and artists will be displayed. For example, in the retrieval result for the tag “rock”, one can see the related tags such as alternative, indie and punk. In order to obtain a better understanding of the practical usage of User-Generate Content in Last.fm, we conducted a survey with Last.fm users. Based on these, we derived a number of design guidelines, which inspired our development of the semantic-based tag visualization. We reported this survey briefly in the following, and more details can be found in (Chen, Boring & Butz, 2010). User interview In order to gain more insights on the effective use of tags contributed by the users, we need to explore the features and benefits of music-related tags, as well as the users’ search and tagging behavior. In order to explore these, we conducted interviews with 13 Last.fm users, who were recruited in the Last.fm online forums. Three of them were female and 10 male, and their age varied from 18 to 26 with an average age of 23 years. Among these participants, there were 7 undergraduate students, 2 graduate students, 2 researchers and 2 employees in business. All the participants had a common knowledge about computers and the Internet. They had a relatively long listening history: all of them registered more than 2 years ago, 2 users even more than 3 years and one user more than 4 years ago. During the interview, the participants were equipped with a PC, a keyboard and a mouse. They were given a list of all the questions to be discussed. While they were formulating their answers, the Think-Aloud protocol was applied, which helped them to express their answers in a more natural and flexible way. Participants could also freely browse their personal profiles and other services of Last.fm. The key aspects explored were the tagging and searching behavior and relevant user-generated tags. Example questions for searching behavior were: “How often do you search for music in Last.fm?”, “How often do you use tags for searching?” and “What do you
think about the TagClouds of Last.fm?”. Example questions for the tagging behavior were: “How often do you tag music in Last.fm?”, “Which kind of tags do you use for tagging?” and “Do you think tagging music is difficult?”. 12 out of 13 participants used the search functionality frequently. Only one user looked for music by browsing the charts of popular artists. Besides standard keywords of artist, album and song, the participants did not search with tags very often and the average score for their usage frequency was 2.2 (1 for never, 5 for daily). Genre was the most frequently used tag for keyword-based search. All participants felt that the too general tags might make them getting lost among too many less relevant results and thus find nothing specific. When asked to comment the TagClouds shown in Figure 1, one prominent comment was the redundancy. The participants did not tag very often themselves, and the average tagging frequency was 1.1 (1 for never). Similarly to tags used for search, most of their actual input tags were also related to genre. Some other participants also use personalized tags for quick relocating, such as “listen again” and “Sunday morning”. The majority of participants thought that tagging music is hard and one participant even postponed it as the last task because he thought it was a hard and serious job and he needed more time to think about it. Online survey In order to validate the results of our interviews, we conducted an online survey with a larger population. The survey lasted for two months and 228 Last.fm users joined in it, 93 of which were female and 133 male (two gender identifiers were left blank). Their age varied from 16 to 36 with an average age of 22 years. The participants were mainly students and employees from North America and Europe. Participants reported themselves to be experienced Last.fm users with an average score of 3.8 (5 for very experienced). Their registration histories varied from 0.13 to 5.72 years with an average duration of 1.8 years. The questions mainly covered the general experience with search and tagging. Their answers showed that they seek information quite often in Last.fm, with an average frequency of 4.0 (1 for never, 5 for daily). A significantly larger proportion of this time (with an average percentage of 64%) was spent in browsing-like filtering rather than specific search activities. Concerning keyword-based search, participants mostly search music-related information (4.0/5), such as names of artists, albums, songs, and less about social information of groups, users and events. Consistently with the interview result, tags were used much less for search (2.0/5). The participants thought Last.fm TagClouds (as shown in Figure 1) offeres an efficient overview for the most popular items (3.6/5), but they also noticed the apparent linguistic problems. They commented that a too general selection of tags is counterproductive for tag-based search. Participants did not tag very often (1.8/5) and they mainly tagged music in their own libraries. In the questionnaire, they were required to tag one specific artist and the top tags were genrerelated, such as pop, funk and soul. The top motivations for tagging were easing browsing and searching, facilitating personal organization and searching, and conveying their musical knowledge. Implications Based on the results of the interview and the online survey, we derived some implications about the users’ searching and tagging behavior. People’s information seeking behavior is more alike to browsing than to specific keyword-based search. People rarely tag music and they tag it with
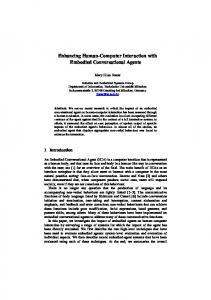
different motivations. In Last.fm, most of the popular tags are genre-relevant. The personal understanding of genre is subjective and people might come up with different tags for the same music. Searching with tags is not common in Last.fm because these user-generated tags are normally too general to help users finding specific targets. We believe that if the tags can be efficiently organized in a more understandable way, they will be more helpful for tag recommendation and tag-based music retrieval. We therefore explore the semantic aggregation of tags to support efficient hierarchical browsing and understanding the relations between tags. Semantic aggregation Through an analysis of tag text, the problem of synonym can be efficiently alleviated by grouping semantically similar tags, such as favorite and favorites, rock and roll and rock n roll. This semantic aggregation can also help to remove the ambiguity. For example, a significantly number of users think “electronic” and “IDM” belong to the same genre. By grouping these similar concepts in one group, their relation can be clearly indicated and the user has a good chance to be “educated”. Hierarchy exploration and relation visualization The implicit hierarchical structure hidden inside the user-generated tag can also be extracted with the text analysis. By uncovering the underlying semantic relations, it is possible to derive a semantic understanding of tags, especially the important genre-relevant ones. With a clearly demonstrated hierarchical structure, the user can also search more efficiently with less ambiguity. By highlighting the overlapping areas between groups, the user can tell the relation between tags at a higher semantic level. Possible applications With a hierarchical structure of tags, it is possible to offer efficient tag suggestions. Such assistance can efficiently help users to input more appropriate tags while avoiding possible spelling errors or redundancy. Both existing work and our survey have confirmed the importance of genre in conveying the general information of music (Cunningham, Bainbridge & Falconer, 2006). Due to the fact that there is no standard definition of genre, we expect such a tag suggestion facility would be especially useful to recommend genre-related tags. For example, if the user types in “electronic”, the system can suggest “IDM” as a similar tag. If the hierarchical structure is achieved, it will help the user to conduct a more controlled tag-based search, which will yield retrieval results with higher relevance. TAGCLUSTERS: SUPPORTING THE SEMANTIC UNDERSTANDING OF TAGS We investigated the problems with user-generated tags in Last.fm and explored possibilities to improve the semantic understanding of these tags. Based on the aforementioned design considerations, we built a prototype named TagClusters to support the semantic understanding of tags (as shown in Figure 2). TagClusters is implemented based on Overlapper (Santamaría & Therón, 2008), a graphbased visualization tool that highlights the connections and overlaps among entities (nodes) in data. TagClusters is an interactive interface in which tags are drawn as labels with different sizes (size representing tag popularity, as in TagClouds), and tag groups are drawn as transparent colored areas (see Figure 2). TagClusters use the underlying visualization of Overlapper, based on a
force-directed layout (Fruchterman & Reinhold, 1991) that does not use a typical node-link approach, but a Venn-diagram approach, in order to represent groups and group relationships. On a force-directed layout, two forces are typically computed within an iteration loop: a spring force is applied to connected nodes, keeping them close, while a repulsion force is applied among nodes, separating non-connected nodes. In our case, each node in the visualization corresponds to a tag, and two tags clustered in the same group are connected by an edge. In this schema, each group is a complete sub-graph joining every node in it, and it is represented by a transparent hull that wraps all of its nodes. This is achieved by using the outermost nodes of the groups as anchoring points for a spline curve which is drawn in a solid color to improve group traceability. Edges are only used to compute attraction forces among nodes in the same groups, but they are not drawn to avoid edge cluttering (Gansner & North, 1998). Figure 2. The visualization of TagClusters (with the same tag set in Figure 1).
The initial placement of tags is not random, but coherent with tag co-occurrence (which will be discussed in the next section). This placement reduces the time required for the stability of forces in the layout, also minimizing possible misplacements. Moreover, edges are weighted according to the co-occurrence between the tags they connect, so the more similar they are, the higher the attraction force represented by the edge. In this way, nodes will be separated proportionally to their similarities even if they are in the same group. Finally, as in TagClouds, the label size is proportional to the number of occurrences of the tag. Group labels are drawn using capital letters and with a different color to distinguish them from tag labels. Group label size is proportional to the sum of the occurrences of all the tags the group contains. This is done on a logarithmic scale to avoid very large tags. Therefore, TagClusters can be seen as TagClouds in which position is relevant and based on tag co-occurrence and tag groups. The visualization is further supported by group wrappers. These characteristics exploit human perception for traceability and group detection, improving the visual analysis (Ware, 2004). In addition, the final user interface offers several interactions, such as panning and zooming without losing context (provided by an overview in the top-right corner), hiding or showing tags, groups and labels, searching tags by text, modifying the underlying forces, modifying node and
group locations, changing color settings, and exporting the current visualization to an image. The system also provides multiple options for tag selection, which facilitate tag-based music retrieval. For example, the user can choose multiple tags or groups using both keyboard and mouse. She or he can also draw a shape manually and all the tags included in this shape will be selected. As pointed out in (Hearst & Rosner, 2008), it is difficult to compare or discover tags in small print, so our interface also allows customized label font sizes. Although infrequently, the force-directed technique may misplace nodes, positioning them inside groups they do not belong to (this may be the case, for example, for elongated hulls connecting two other groups, such as the goth and folk groups in Figure 2). This particular issue is resolved by allowing the user to hover over a node. This highlights all nodes connected to the respective node, thereby resolving any possible ambiguity. The user can also manually adjust the positions of groups and tags, and relevant changes can be saved automatically. Since most of the popular tags are related to genre and the relevant groups overlap each other, these genre-related groups are placed in the center and other semantically less related tags and groups are scattered around. Within a group, tags are further grouped into sub-groups. Since groups are represented as transparent colored areas, overlapping groups (groups that share one or more common tags) have intersecting, more opaque areas, thus highlighting the overlapping tags. With such assistance, the user can obtain a better understanding of structure and relation between tags. For example, in Figure 2, we can see that rock is the most popular genre group which is also related to several others, such as pop, indie and punk. Also we find several genres at the bottom right of the figure relating to both metal and rock groups, such as progressive and goth (see Figures 2 and 3). UNDERLYING SEMANTIC ANALYSIS The arrangement of tags in TagClusters is achieved based on a semantic analysis: The hierarchical structure is achieved based on a text analysis, which also helped to exclude redundancy. Then a calculation of the semantic similarity between each pair of tags helps to determine the initial position for each tag. Text analysis With an observation of the Last.fm TagClouds (see Figure 1), we notice that synonymy is the most serious linguistic problem among these user-generated tags. Specifically, it is mainly caused by the issue of singular and plural, for example, “favorite” and “favorites”, or by different spellings, such as “favorite” and “favourite”. Besides, the usage of different separators produces another kind of redundancy, for example, “rock and roll” and “rock n roll”. We also discovered that many Last.fm tags, especially the genre-related tags, share a characteristic property: The tag at the lower semantic level almost always contains the tag at the higher level and the length of tag is roughly proportional to its semantic level, for example, “metal”, “death metal” and “brutal death metal”. This feature helps us to derive the hierarchical structure. In our system, after removal of different separators, such as “_” and “&”, the Porter algorithm (Porter, 2006) is applied to detect the stem for each tag. Tags with the same stem will be clustered into one group. Within one group, tags sharing other stems will be further clustered into sub-groups. For example, all the tags containing “metal” will be grouped in the Metal group and tags such as “death metal” and “brutal death metal” will be further placed into a sub-group (as shown in Figure 3). All tags related to gender will be clustered in a Vocal group, and a similar
thing is done for the time-related tags, such as “80s” and “00s” (see left part of Figure 2). After the text analysis, most of the tags can be correctly grouped into a hierarchical structure. We notice that this basic technique has some limitations and should be further enhanced to distinguish the literally similar but musically different tags such as classic and classic rock Figure 3. Examples of text analysis result
Calculation of semantic similarity After achieving the hierarchical structure of tags, we calculate the semantic similarity between each pair of tags based on their co-occurrence. It is a metric widely used in the field of Information Retrieval to determine the semantic relations between a pair of information items (Nielsen, 2007), (Begelman, Keller & Smadja, 2006). In our case, this semantic similarity (Sim) between tag A and B equals to the ratio between the number of resources in which these two tags cooccur and the number of resources in which any of the two tags appears (Nielsen, 2007), (Hassan & Herrero, 2006), as equation 1 shows. With the semantic similarity between tags, the initial location of each tag is assigned by means of a 2D projection based on a non-metric multidimensional scaling of co-occurrences (Sammon, 1969). (1) Through the approach of semantic analysis discussed above, all tags can be semantically organized into relevant groups and sub-groups, with the distance representing their semantic similarity. With interconnections with each other, the genre-relevant groups become prominent in the visualization. Other categories such as time- or emotion-related groups are scattered around, due to their less semantic relationship with the genre category.
USER STUDY In order to evaluate our visualization tool, we conducted a comparative evaluation of TagClouds and TagClusters. We were specifically interested in the performance of our tool in supporting the perception of semantic relationships among tags. User study design TagClouds and TagClusters were evaluated using a repeated measures within participants factorial design. The independent variable was sysType (TagClouds and TagClusters). The order of sysType was counterbalanced between participants to minimize learning effects. Participants We recruited 12 participants at the University of Munich with different majors, 7 German and 5 foreigners, 4 female and 8 male. These 12 participants allowed a perfect counterbalance of sysType to minimize learning effects. Their age varied from 24 to 29 with an average age of 27 years. All participants had a common knowledge about computers and the Internet. They reported themselves to be familiar with TagClouds with an average score of 3.58 (1 for unfamiliar at all, 5 for very familiar). Settings and Procedure The study was conducted in our lab and participants were equipped with a PC, a keyboard and a mouse. On average the user study lasted about 35 minutes per participant. It was recorded on video and the Think-Aloud protocol was applied. The user study consisted of a pre-questionnaire, an interview and a post-questionnaire. The participants were first asked to fill out a pre-questionnaire with demographic information and their general experience with tags. After a brief introduction of TagClouds and TagClusters, the participants were asked to execute 6 tasks, which mainly covered the aspects of searching, browsing, comparison and relation understanding. Each task consisted of two sub-tasks and the following are 6 example tasks: Task 1: Single tag locating: Find a tag named “German”. Task 2: Tag ranking: List the top 5 popular tags. Task 3: Tag comparison and filtering: List the top 5 tags related to genre. Task 4: Structure deriving: Give a hierarchical structure for the Metal group. Task 5: Tag relation detection: Is there an overlap between pop and punk? Task 6: Similarity judgment: Is indie more similar to punk or progressive? After completing each task, participants scored how easy the task was, and how helpful the system was in supporting the task. After completing all the tasks, participants filled out a postquestionnaire concerning the overall impression of both systems. Hypotheses Based on the main features of both visualizations (for example, tags are ordered alphabetically in TagClouds and semantically grouped in TagClusters), the following hypotheses were stated: H1: TagClouds will outperform TagClusters in Task 1 regarding completion time, answer precision, task easiness and system usefulness. H2: TagClouds will outperform TagClusters in Task 2 regarding completion time, answer precision, task easiness and system usefulness.
H3: TagClusters will outperform TagClouds in Task 3 regarding completion time, answer precision, task easiness and system usefulness. H4: TagClusters will outperform TagClouds in Task 4-6 regarding completion time, answer precision, task easiness and system usefulness. Results The results are reported based on the 24 sessions performed by the participants. We analyzed the questionnaires, answers and the screen activities and discovered the following results. The comparison of the completion time, the answer precision, the task easiness and the system usefulness for both systems are shown in Figure 4. For task 1, although the tags in TagClouds can be located by their alphabetical order, locating the first character still needed some time. A dependent t-test showed that TagClouds cost significantly more time with task 1 than TagClusters (t(11)=3.131, p