Permission to make digital or hard copies of all or part of this work for personal or classroom use ... Copyright 2005, ACM 1-59593-167-8/06/2005...$5.00 ..... No. Buffer Entries. Violations. Benchmark. Overflows. TVB. PVB art. 2. 1. 1 equake. 0.
TAPE: A Transactional Application Profiling Environment Hassan Chafi, Chi Cao Minh, Austen McDonald, Brian D. Carlstrom, JaeWoong Chung, Lance Hammond, Christos Kozyrakis, and Kunle Olukotun Computer Systems Laboratory Stanford University
{hchafi, caominh, austenmc, bdc, jwchung, lance, kozyraki, kunle}@stanford.edu
Abstract Transactional Coherence and Consistency (TCC) provides a new parallel programming model that uses transactions as the basic unit of parallel work and communication. TCC simplifies the development of correct parallel code because hardware provides transaction atomicity and ordering. Nevertheless, the programmer or a dynamic compiler must still optimize the parallel code for performance. This paper presents TAPE, a hardware and software infrastructure for profiling in TCC systems. TAPE extends the hardware for transactional execution to identify performance impediments such as dependence violations, buffer overflows, and work imbalance. It filters infrequent events to reduce resource requirements and allows the programmer to focus on the most important bottlenecks. We demonstrate that TAPE introduces minimal die area and performance overhead and can be used continuously, even for production runs. Moreover, we demonstrate how to leverage the profiling information to guide optimization for a set of parallel applications. TAPE accurately identifies the source code location and type of the most important bottlenecks, allowing a programmer to achieve maximum parallel speedup with a few profiling steps.
1
Introduction
With uniprocessor systems running into instruction-level parallelism (ILP) limits and fundamental VLSI constraints [4], parallel architectures provide a realistic path toward scalable performance. Single-chip multiprocessors (CMPs) are becoming the norm for server, embedded, and even desktop platforms [7, 13, 18, 19]. Nevertheless, the key factor limiting the potential of parallel architectures is the complexity of writing correct and efficient parallel programs. Existing parallel programming models require the user to manage concurrency directly by creating and synchronizing threads using locks and barriers. The difficulty stems from the need to achieve the often conflicting goals of functional correctness and high performance. As a result, only a small fraction of program-
mers develop parallel applications and few such applications reach their full performance potential. Transactional Coherence and Consistency (TCC) provides a new shared-memory model that simplifies parallel application development [11]. TCC relies on programmer-defined transactions as the basic unit of work. A TCC-based CMP speculatively executes transactions in parallel using local buffering. After a transaction completes, the hardware commits all of its writes to shared memory as an atomic unit. At this point, the writes become visible to other transactions, which may rollback due to dependency violations. TCC simplifies the development of correct parallel applications by eliminating the need for manual orchestration of threads using locks. Programmers simply need to divide computation into potentially parallel transactions and then specify any ordering dependencies that must be observed between transactions. TCC hardware guarantees correct synchronization by automatically restarting transactions on dependency violations. Even though developing a correct parallel program with TCC is easy, it may need performance tuning. An application may fail to achieve the expected parallel speedup due to impediments such as transactional buffer overflows which cause serialization of parallel regions, dependency violations which trigger transaction reexecution, workload imbalances, and overheads due to TCC API primitives. To fulfill the potential of the TCC model, it should be easy for a programmer to identify and remove these performance bottlenecks. In this paper, we present TAPE, a hardware-enabled profiling environment for TCC. TAPE builds on the existing hardware support for transactional execution to detect and track performance bottlenecks. It also identifies their location in the program source code and communicates them to the programmer or a profile-driven compiler. TAPE uses a set of hardware filters to aggregate profiling data, filter out infrequent events, and direct the programmer to the most critical performance bottlenecks. Using a set of parallel programs, we demonstrate that TAPE exhibits the following desired attributes [26]: • Expressiveness: It tracks all types of performance bottlenecks for parallel programs in a TCC system.
Permission to make digital or hard copies of all or part of this work for personal or classroom use is granted without fee provided that copies are not made or distributed for profit or commercial advantage and that copies bear this notice and the full citation on the first page. To copy otherwise, or republish, to post on servers or to redistribute to lists, requires prior specific permission and/or a fee. ICS’05, June 20-22, Boston, MA, USA. Copyright 2005, ACM 1-59593-167-8/06/2005...$5.00
• Accuracy: It accurately identifies the source of the bottleneck in terms of source code line and object address. It also tracks the severity of the problem in terms of frequency and overall impact on performance. • Usability: By guiding the programmer to the source code location of the most critical bottlenecks, TAPE allows performance optimization within a few guided steps.
This continual cycle of speculative buffering, broadcast, and potential violations allows us to replace both conventional coherence and consistence protocols [12]. TCC maintains ordering between entire transactions, unlike most consistence schemes that order individual references. Coherence among caches is also handled at transaction boundaries. From the programmer’s perspective, all memory references from a committed transaction occur “before” all the memory references of a transaction that commits afterward, even if their actual execution is interleaved in time, because all writes from a transaction become visible only at commit time.
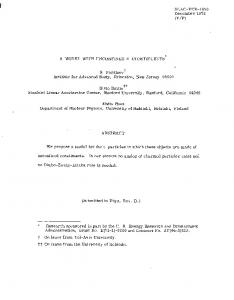
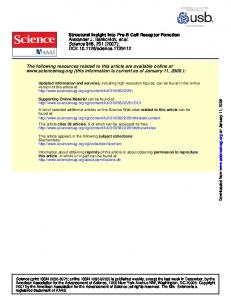
Figure 1. a) The transaction cycle (time flows downward); and b) the diagram of a TCC-enabled CMP.
• Low Overhead: The aggressive filtering and aggregation allows TAPE to introduce negligible cost in terms of performance and die overhead. Hence, profiling can be enabled continuously, even for production runs. Overall, the proposed profiling scheme complements the correctness advantages of TCC programming with simple and guided performance tuning. The rest of this paper is organized as follows. Section 2 provides an overview of TCC hardware and software. Section 3 introduces the four bottlenecks that reduce the performance of TCC programs. In Section 4, we present the profiling hardware. Section 5 evaluates the hardware by using it to optimize nine applications on a TCCbased CMP. Section 6 discusses related work, and we conclude in Section 7.
2
TCC Overview
A TCC program consists of a sequence of transactions. The hardware supports a shared-memory communication model with coherence and consistency maintained at transaction boundaries. Processors in a TCC-based CMP speculatively execute transactions at all times, using the cycle illustrated in Figure 1a on the hardware depicted in Figure 1b. A transaction is a sequence of instructions guaranteed to execute and complete only as an atomic unit. Each transaction buffers its write-set locally during execution and commits this set to shared memory atomically. Once execution is complete, the processor asks for permission to commit by requesting a commit token from an arbiter. After the token is granted, the processor uses the network to broadcast its write-set to the rest of the system. Other processors snoop the committed write-set to maintain coherence in the system. Snooping allows them to detect when they have read data that has been modified by another transaction. This dependence violation triggers the re-execution of the snooping transaction. The commit operation provides atomicity of execution and inherent synchronization. TCC programs can specify ordering constraints, forcing transactions to commit in order to preserve sequential semantics. Alternatively, this restriction can be relaxed by using unordered transactions, allowing the hardware to more freely schedule transaction commits.
TCC parallelization requires using a few new programming constructs to identify potentially parallel transactions and specify any commit ordering constraints [11]. Initial parallelization can easily be done so that correctness is guaranteed. TCC hardware speculatively executes transactions, rolling back when it detects data dependencies. There is no need for locks since transactions are guaranteed to execute atomically. Loops are parallelized using the t_for keyword that generates transactions from loop iterations. TCC offers four different flavors of t_for to control how iterations are assigned to transactions. Using t_for creates one transaction for each iteration, guaranteeing execution in sequential code order. With t_for_n we specify the number of iterations each transaction will execute before committing, a technique called chunking. If ordered transactions are not required for correctness and one can use unordered loops, then t_for_unordered (similar to DOALL) and t_for_unordered_n, both of which allow iterations to commit atomically in any order, can be used instead. Functional parallelism is exploited using the t_fork construct, which creates a new transaction from a function call. A function or loop iteration can be separated into multiple transactions using the t_commit construct, which commits the current transaction and begins a new one for the following code. A commit must not be inserted inside a critical section, as this will cause a race condition. We have investigated the implementation and performance of the TCC coherency scheme and the conventional Snoopy Cache Coherency (SCC) scheme in a chip multiprocessor environment [17]. We demonstrated that the performance of TCC is very competitive with SCC and in some cases better. These results indicate that one does not have to give up the simpler parallel programming benefits of TCC to achieve good parallel processing performance in CMP environments.
3
Reducing Performance Bottlenecks
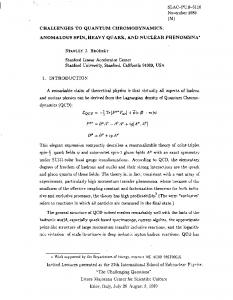
The transactional model shifts the programmer’s focus from correctness to performance. Writing a correct parallel program using TCC is simple because hardware guarantees transaction atomicity and ordering. We have shown in previous work [12] that, after applying optimizations to create well-behaved transactions (such as those in Figure 2a), very good performance can be achieved. TAPE consists of a collection of hardware buffers and filters that gather and aggregate profiling data. For each performance bottleneck there is a specialized buffer and filter to track it. Table 1 shows the format of each buffer’s entries. In addition to the profiling hardware, TAPE provides software tools that merge, filter and re-order the profiling information to emphasize performance critical bottlenecks first. Programmers can use feedback obtained from TAPE, produced during initial execution, to refine the program and achieve greater speedups. In this section we identify the four fundamental per-
formance bottlenecks for transactional programs: overflows, violations, imbalances, and overhead. For each bottleneck, we discuss the negative impact it has on performance and how profiling can guide the programmer to reduce this impact (see Figure 2). We close the section by providing a simple example of how a programmer might use TAPE to optimize an application.
3.1
Bottleneck Overflow 15B
Overflows
The TCC hardware buffers read- and write-state in the L1 cache during execution and flushes this state to memory on commit. However, transactions with a large read- and/or write-state may exceed available buffering; this is called a capacity overflow1 Currently in TCC, an overflowing transaction acquires the commit token and must flush its state. To preserve atomicity semantics, the transaction holds the commit token until committing normally. Other overflowhandling schemes have been proposed, namely storing speculative state in memory [5], but overflows are costly in any proposal and must be eliminated by programmers. Overflows maintain correctness but they dramatically impact performance. The most costly overflows are those that occur far from a commit point because other transactions are prevented from committing for a long time (see Figure 2b). If an overflow occurs during a parallel loop, it can lead to serialization of the entire loop; each iteration will overflow at roughly the same point and will wait for previous iterations to reach commit points. Fixing overflows involves making the transactions in which they occur small enough to fit in the L1 Cache. If the overflow occurs inside a parallel loop, the programmer can re-chunk the loop (reduce the n in t_for_n), or perform loop fission [23]. Overflows occurring inside a forked region can be fixed by splitting the transaction into multiple smaller transactions. Profiling hardware can assist the programmer in determining the most costly overflows. To direct the programmer to the code that causes an overflow, the hardware stores the program counter (PC) of the load/store which triggered the overflow. To provide guidance for re-chunking a parallel loop, the first iteration on which the overflow occurred is also reported. The hardware determines the most costly overflows by tracking the number of times each one occurred and the total loss incurred over all occurrences. Loss is calculated by taking the difference between the cycle counter when the overflow occurred and when the transaction reaches its normal commit point. The fields required for profiling overflows are shown in the Overflow Table 1.
3.2
Violations
A transactional system maintains coherence using violations that trigger transaction rollback and re-execution. While violations are necessary for correctness, restarting transactions from their last commit point will waste any completed work and decrease performance (see Figure 2c). All violations are indicative of true sharing between transactions. However, expensive violations that cause significant work to be rolled back should be minimized to ensure good parallel performance. Minimizing expensive violations means reducing communication or resizing transactions. To reduce communication, programmers can privatize data and reduction variables. If transactions are re1 Overflows
caused by cache conflict misses are effectively handled by a victim cache; this is the common case [17].
Violation 43B
Workload Imbalance 16B Overhead 16B
Field PC Occurrences Total Loss Iteration Read Processor ID Read Transaction PC Read PC Read Iteration Object Address Write Transaction PC Write Processor ID Occurrences Greatest Single Loss Transaction PC Ordering Imbalance Region Imbalance Transaction PC Useful Cycles Overhead Cycles
Bits in HW Buffer 61 18 25 16 —∗ 61 61 32 61 61 17 15 32 61 32 32 61 32 32
Table 1. The size of each profiling data object for a 64-bit address space: the space used in main memory (in bytes) and that used in hardware buffers (in bits). ∗ Read Processor ID is inferred from the location where the profiling data is stored (see Figure 3).
sized to commit more frequently, rollbacks will be less wasteful because less work is discarded each time. Furthermore, committing just after shared variables are written and/or just before they are read results in quicker updates of shared state and earlier detection of violations. However, programmers must be careful to balance the elimination of violations with the overhead incurred by small transactions (see Section 3.4). To effectively apply these optimizations, the programmer needs to know which two transactions and which shared object are involved in the violation, and some measure of the amount of wasted execution. Transactions are represented by the processor or thread on which they are running (processor ID, i.e., PID), the PC at the beginning of the transaction (TPC), and the iteration of the violating transaction’s parallel loop, for the case of a loop-based parallelization. The data object is represented by its address and the first PC at which it is read by the violating transaction (the read PC). This data helps the programmer pinpoint the violation and eliminate or reduce its impact. Finally, waste is measured by the number of times this violation occurred within this transaction and the greatest single loss across those occurrences. Programmers can use this information to judge which violations hurt performance the most. The Violation section of Table 1 shows the fields necessary to support violation profiling. The details of how this information is collected and aggregated are presented in Section 4.2.
3.3
Workload Imbalances
Workload imbalances are the result of an ill-distributed workload across transactions and processors. The most common case of imbalance occurs with ordered transactions: a younger transaction finishes but must wait until all older transactions commit (ordering imbalance as seen in Figure 2d). Resizing transactions via rechunking can potentially fix the problem, but the programmer needs to be careful not to introduce overflows. Relaxing the ordering re-
Figure 2. Illustration of the four bottlenecks in transactional execution and their impact on performance. Note that any useful execution (white box) contributes to program completion.
striction would also eliminate the problem; however, it is not always possible to relax ordering and maintain correctness. Another closely related type of imbalance occurs at the end of a parallel loop or forked region; these are region imbalances. Processors with smaller transactions reach the end of the region quickly and sit idle while processors with bigger transactions continue their execution. Redistribution of the workload is necessary to fix this type of stall. Profiling hardware can assist the programmer in determining which regions exhibited the most costly workload imbalances. In the case of ordering imbalances, the hardware tracks the stall cycles due to waiting for the commit token when older transactions have it; the arbiter signals the processor when this is the case and these idle cycles are accumulated in the ordering imbalance field. Once the transaction reaches the end of the region, the region imbalance field stores the number of cycles spent waiting for the remaining transactions to commit. The Workload Imbalance section of Table 1 shows the fields necessary to support imbalance profiling.
3.4
Overhead
Overhead in a transactional system consists of cycles due to API instructions, the time to acquire commit permission, and the time to flush write-state to memory. Programmers should avoid excessively small transactions since the associated overhead is too high. This is especially the case when using t_for loops: if the body of the loop is very small compared to overhead, the processor spends most of its time executing API calls (Figure 2e). The programmer can easily fix overhead problems by increasing the size of the associated transactions. Unlike splitting, merging transactions is always safe; however, it can introduce violations. Profiling can help the programmer track transactions dominated by overhead. For each transaction, the hardware tracks the useful and overhead cycles during execution. The programmer is later presented with a list of high-overhead transactions. The Overhead section of Table 1 shows the fields necessary to support overhead profiling.
3.5
Optimization Procedure
We introduce application optimization with the following simple example that calculates a histogram of 10,000 integer percentages
using an array of corresponding buckets: 1: 2: 3: 4: 5: 6: 7: 8:
int* data = load_data(); int i, buckets[101];
/* input */
for (i = 0; i < 10000; i++) { buckets[data[i]]++; } print_buckets(buckets); /* output */
The compiler interprets this program as one transaction, so it exposes no parallelism to the underlying TCC hardware. The obvious candidate for parallelization is the for loop. The programmer notices that the loop body is extremely small, so she decides to chunk the loop. ... 4: t_for_n (i = 0; i < 10000; i++; 500) { ... Now the loop is 20 transactions that the TCC hardware attempts to execute in parallel, with each transaction executing 500 iterations. After running the application, the user notices that it does not speed up as expected. The user then checks the reports generated by TAPE for any performance bottlenecks: OVERFLOW REPORT: CPU 1 0 ...
Count 9 9 ...
Location buckets.c:5 buckets.c:5 ...
Serial Time 2450 1794 ...
Iteration 601 101 ...
VIOLATION REPORT: CPU 1 4 ...
Object buckets buckets ...
Wasted Time 3204 3145 ...
Read Location buckets.c:5 buckets.c:5 ...
Write Transaction buckets.c:4 buckets.c:4 ...
In this case, the reports suggest excessive overflows occuring at the first and only line of the loop. The report indicates overflows occur every 100 iterations. In addition, TAPE detected the occurence of violations as the result of contention for the histogram buckets.
Now the user has all the information they need to effectively optimize their application. They start by reducing the degree of chunking. Guided by TAPE, they choose to chunk every 100 iterations of the loop. However due to the occurence of expensive violations, they decide to reduce the level of chunking even further to minimize the probability of bucket collisions. The final optimized application might look like this: 1: 2: 3: 4: 5: 6: 7: 8:
int* data = load_data(); int i, buckets[101];
/* input */
t_for_n (i = 0; i < 10000; i++; 50) { buckets[data[i]]++; } print_buckets(buckets); /* output */
In general, optimizing using TAPE mirrors the steps outlined in the above example. The programmer first runs the application and collects profiling information that identifies performance bottlenecks. Our tools combine the information from all the processors and rank bottlenecks in order of importance (by performance cost). Next, the programmer fixes the most important bottlenecks pinpointed by the profiling data, using the techniques explained in this section. These steps may be repeated a few times, as the performance bottlenecks in the current version of the application (e.g., overflows) may be masking additional problems (e.g., violations). Note that the programmer does not need to eliminate all bottlenecks from the program. Typically, the optimized version of each program encounters occasional overflows and/or violations while still achieving good performance.
4
Profiling Hardware
In Section 3, we described the information needed to optimize parallel transactional applications and how profiling hardware can be used to collect it. In this section we show how to efficiently store and report this information to the programmer. A simple though na¨ıve approach would be to store an entry in memory for each bottleneck occurrence. Table 3 shows the bandwidth and memory requirements for such an approach2 . It is clear that storing each bottleneck occurrence as a separate entry would be prohibitive since an average of 77.1 MB of main memory would be used per hour of execution (on eight 1GHz processors). In designing the profiling hardware we made use of two well known application behaviors: • Performance bottlenecks tend to exhibit temporal locality: the most costly overflows and expensive violations occur multiple times in close succession. This property makes it useful to keep profiling data buffered and available for aggregation as long as possible. Apart from the bandwidth savings, keeping profiling data buffered can help in filtering out infrequent bottlenecks. • Most applications do not jump randomly from one code region to another; rather, they spend some time in each region before jumping to the next. This property also makes the case for buffering profiling data; however, it is clear we need to flush the buffers occasionally in case the program moves to another region with a new set of profiling data to record. 2 The
occurrence fields are not required for this approach and so have been ignored in our computations.
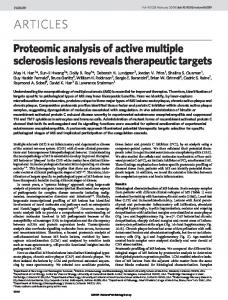
The high-level architecture of TAPE is shown in Figure 3a: each processor collects and aggregates the profiling data into hardware buffers, one for each type of bottleneck. This data is periodically flushed, as described in the following subsections, to a log in memory. The logs are per processor, software can then be used to merge, and rank the data and present it to the programmer in an easy-tounderstand format, or the data can be used for profile-driven compilation. In the next subsections, we describe how the profiling hardware aggregates data for each bottleneck to produce useful and accurate information at a fraction of the cost of the na¨ıve approach. We focus our discussion on how the profiling hardware operates, and leave details such as the number of entries in each buffer to Section 5.
4.1
Overflows
As shown in Figure 3a, each processor in a TCC system has an overflow buffer. When an overflow occurs, we record the profiling information associated with it as explained in Section 3.1. To do this, the overflow buffer is scanned to find a match between the new overflow’s PC and those in the buffer. Overflows are considered equivalent if the most-significant 57 bits of the PCs match, because when an overflow occurs repeatedly in a loop, it often occurs at slightly different PCs. Through experimentation with different applications, the 57 most-significant bits seemed to be an appropriate choice. However, the buffer does store all the bits of the first overflow’s PC to insure an actual overflow address is returned to the programmer. If a match is found, we increment the occurrence count by one and add the new overflow’s loss to that of the one already in the buffer. When a new overflow is observed but the buffer is full, existing entries are aged by decrementing their occurrence count. If the buffer fills up and a match cannot be found for the latest detected overflow, the profiling hardware evicts an entry from the buffer if that entry has been aged enough so that its occurrence count has dropped to zero. If no such entry exists, the profiling hardware simply discards the new overflow data. To avoid losing data, every 1 million cycles the profiling hardware flushes the buffer to memory if it becomes relatively full. Through experimentation, we have observed that 75% is an acceptable threshold that maximizes temporal locality of profiling data while minimizing loss of relevant profiling information.
4.2
Violations
Figure 3b shows a more detailed view of the violation profiling mechanism depicted in Figure 3a. Before a transaction commits its write-set to memory, it sends its transaction PC (TPC) and its PID3 across the network. All other processors record this information in case they need to track a violation. If a violation does occur, the object address is recorded (step 1 in Figure 3b). The information is inserted into the transaction violation buffer (TVB) with the exception of the read PC and iteration number. The TVB is primarily used to acquire a preliminary list of violations within a single transaction. Once the transaction restarts, the read PC and iteration number (if applicable) can be detected when the data object is re-read (step 2 in Figure 3b). In our experience, most restarted transactions read from the same addresses as during previous executions. On insertion into the TVB, we first search for a match, 3 There is no need to record the read PID; when profiling information is stored in memory, the region where data is written represents a unique read processor. See Figure 3.
P0
a)
b) Pn-1
Overhead Filter Overflow Filter
3
2
Processor Core
L1 Cache
TVB
Core
PVB L1 Cache
...
1
Violation Detection
Imbalance Filter
Network
Violation Filter
1. Detection Violation detected, inserted into TVB.
Network
...
4
Main Memory
2. Read PC Core re-reads object, read PC sent to TVB.
3. Commit
4. Flush
On commit, violation inserted into PVB.
Periodically, PVB flushed to memory.
Figure 3. a) Block diagram of TAPE: each processor writes its profiling data to a separate region in main memory (profiling data flows along the dashed lines); and b) overview of violation filter.
comparing object addresses; if one is found, we increase its occurrence count and update its loss count if the newly incurred loss is greater. If no match is found, and the TVB is full, we simply discard the new violation data. Once the transaction commits, we choose the most expensive violation and insert it into the period violation buffer (PVB) (step 3 in Figure 3b). When inserting violation data into the PVB we first search for a match on the read PC. A single load can read different data objects when executed in different transations, so matching on object address can yield multiple violations with same read PC. Providing a collection of problematic read PCs is more useful to the programmer than providing a collection of shared data objects touched by the same read PC. If a match is found, we increment the occurrence count and update the loss count in the same fashion as in the TVB. PVB entry eviction and flushing is handled in the same way we handle overflow buffer eviction (i.e., by aging) and flushing (i.e., periodically).
4.4
Overhead profiling is similar to that of workload imbalances: each processor has a one-entry buffer storing the overhead-related information discussed in Section 3.4. Each time a transaction commits, it compares its overhead as a percentage of useful cycles to that stored in the buffer. If the committing transaction’s overhead is higher, the buffer entry is replaced with the new data. The hardware flushes the buffer at the end of each parallel region if the overhead is more than 5% of useful cycles.
5
Workload Imbalances
The hardware includes a one-entry buffer to track workload imbalance. As explained in Section 3.3, we track ordering imbalances with the help of the arbiter, which signals the processor when a transaction is stalled due to ordering. Any subsequent ordering imbalance is added to a running total, which is stored in the workload imbalance buffer. When a processor reaches the end of a parallel region, a count of the cycles spent waiting is recorded. Upon leaving this region, the profiling hardware compares the total imbalance (ordering and region) to the total cycles spent within the current parallel region. If at least 5% of the total cycles is spent stalling due to imbalance, we flush the profiling entry to memory; otherwise, the hardware discards it.
Evaluation
In this section, we evaluate the profiling hardware and filtering capabilities. We use the hardware to optimize a series of applications for a TCC-based CMP and demonstrate that it is easy to use, provides accurate information to the programmer, and incurs low execution overhead.
5.1 4.3
Overhead
Evaluation Methodology
We evaluate the profiling hardware using execution-driven simulation for a TCC-based CMP system. The simulator models singleissue PowerPC processors that buffer transaction read- and writestate in a 32-KByte, 4-way associative L1 cache; there is a perfect, shared L2 cache. Each processor is equipped with a 16-entry victim cache to handle associativity overflows. The processors communicate over a split-transaction, fully pipelined, 16-byte bus running at the CPU’s clock-rate. The bus is used for transaction commits and to serve L1 cache misses from the shared L2 cache. All memory hierarchy contention and queuing for accesses and commits are accurately modeled. The simulator captures all details of the proposed hardware, including the latency for searching and inserting profiling data into the filters and the latency/bandwidth overhead for flushing profiling data to main memory.
The applications include nine benchmarks: one SPEC CPU95 floating-point application [21] (tomcatv), three SPEC CPU2000 floating-point applications (art, equake, and swim), two SPLASH benchmarks [2, 22] (mp3d and radix), two JavaGrande benchmarks [3] (lufact and moldyn), and quicksort. These applications contain significant amounts of parallelism to exploit on a CMP. Nevertheless, they exhibit a wide variety of concurrency patterns: nested loops (equake), short loops (art), completely parallel loops (lufact), loops with dependencies (tomcatv), and recursion (quicksort). For seven of nine applications, we start with sequential code that includes significant impediments to parallelization. The two SPLASH applications were already parallelized, but were included to verify that our techniques work equally well for parallel programs. In addition, parallelization with transactions often introduces different trade-offs than parallelization with threads, locks, and barriers. Overall, these nine applications exercise all potential transactional performance bottlenecks and allow us to evaluate all aspects of the profiling hardware. Due to space limitations, we only present results for a TCC system with eight processors. This is enough processors to expose all potential problems in a parallel system (load imbalance, bandwidth limitations, communication and synchronization overhead, etc.). The results also apply to CMP configurations with 2 to 16 processors.
5.2
Optimizing Performance with Profiling
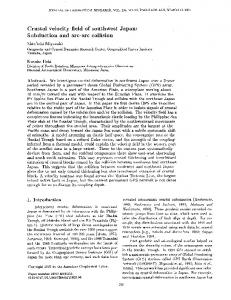
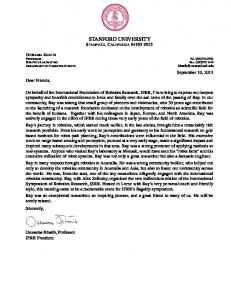
Figure 4 shows normalized execution time obtained from applying feedback-guided optimizations to the nine benchmarks. Time is normalized to that spent running the sequential code on a single processor. We used the TCC API summarized in Section 2 to extract transactions from loops and function calls. Initial parallelization was intuitive: users pick regions of code they think may be parallelizable, and convert them to transactions without worrying about locks or data allocation and privatization. We used ordered transactions except where noted below. Each bar is further broken down into time executing useful transactions, time spent for L1 misses to be serviced, synchronization time due to imbalances, communication time due to commits, and time spent on transactions that violate. Only lufact exhibited excellent speedup with the initial parallelization; bottlenecks diminished the benefits of parallel execution for the other applications. The remaining segments of each bar show the execution time achieved for each application by progressively applying feedback-driven optimization. Once the impediments are removed, all applications achieve significant speedups in the range of 3.8–7.6 and, in most cases, are only limited by the inherently sequential portion of the code (Amdhal’s law). The speedups are similar to and sometimes better than those achieved with highly-optimized multithreaded programs running on conventional shared-memory CMPs [17]. Table 3 provides further insights into the optimization process. Multiple steps were necessary to fully optimize most applications. The first run typically identified overflows. Optimizing overflows exposed violations, which were identified with a second run. Despite the multiple steps, the whole process from non- to near-linear speedup took just a few hours, with every step providing significant performance improvements. Each step was straightforward because the profiling hardware accurately identified both the type of the bottlenecks and the specific source code line or variable that caused it, without any programmer effort. This is a significant improvement over conventional performance debugging for multithreaded programs, where the programmer must manually instrument portions of the code and variables that she suspects are involved with per-
Benchmark art equake lufact moldyn mp3d quicksort radix swim tomcatv
No. Buffer Entries Violations Overflows TVB PVB 2 1 1 0 3 3 0 1 1 1 1 2 5 1 6 0 0 0 2 1 1 3 1 1 5 1 1
Table 2. The number of profiling buffer entries required to track all important performance bottlenecks. Note that overhead and imbalance buffers both have one entry.
formance loss. The conventional procedure requires much higher programmer effort and more steps, as it is difficult to associate hardware-measured events like coherence misses and false-sharing with problems in the source code and potential optimizations. art, equake, moldyn, mp3d, radix, swim, and tomcatv exhibited costly overflows and expensive violations. With these applications we reduced loop chunking to minimize overflows while maximizing transaction size to reduce overhead. To fix violations, we privatized shared variables in all applications but radix, where we split some of its transactions to increase the frequency of communication. lufact had no overflows, but did have a few violations; however, the profiling output indicated they were infrequent and not detrimental to performance so it has only one bar representing its speedup. For moldyn, we initially parallelized with ordered transactions, but noticed synchronization due to overflows. Without loop fission, acceptable speedup with ordered transactions could not be obtained so we switched to unordered after quickly verifying that loop iterations could commit in any order and still maintain correct program execution. All the bars in Figure 4 represent unordered runs of moldyn. After switching to unordered execution and fixing overflows we noticed excessive overhead, which we fixed using loop chunking. Due to the unbalanced recursion in quicksort, it exhibited workload imbalance, though it had no overflows or violations. To fix this imbalance, we switched to unordered transactions. As in moldyn, the transactions in quicksort can commit in any order.
5.3
Profiling Buffer Sizes
In addition to performance optimizations, we also determined the profiling buffer requirements. The minimum size of each profiling buffer (overflows, and the two violation buffers) is shown in Table 2 for each application. We determined these values by gradually reducing the buffer sizes until we found the smallest value for which no important information was lost. By important we mean information we used to perform the optimizations described above. The buffering requirements for these applications are small. This fits with our intuition about these applications: they have a small number of overflows, usually one or two per parallel region. Consequently, as long as the filter collects these overflows before it flushes to memory, it will catch the needed overflow data. Also, each parallel region has a small number of shared variables that offer potential for violations, so the Transaction Violation Buffer can be very small. And as long as the Period Violation Buffer stores the most expensive violations from small TVBs, it too will be small.
80
60
40
20
art art
Busy
equake equake
L1 Miss
moldyn
mp3d mp3d
Synchronization
quicksort quicksort
radix radix
Communication
Step 2
Initial
swim swim
Step 1
Step 2
Initial
Step 1
Step 2
Step 1
Initial
Initial
Step 1
Initial
Step 1
Step 2
Initial
lufact lufact
Step 1
Initial
Step 2
Step 1
Initial
Step 2
Step 1
0 Initial
Normalized Execution Time
100
tomcatv
Violations
Figure 4. Execution time, normalized to sequential runs, obtained using profiling hardware to optimize nine benchmark applications. See Table 3 for details on the steps for each application.
The final design we propose is an overflow buffer of size 8, a TVB of size 4, and a PVB of size 8, and single-entry overhead and imbalance buffers. We chose these numbers because they were big enough to hold all important data for our applications yet small enough to make only a minor impact on chip area and overhead due to searching and flushing. With these sizes, the hardware needs only 5,075 SRAM bits and 244 CAM bits for the associative lookup of object address in the TVB. Hence, the area overhead of the profiling hardware is negligible compared to existing structures, such as the 32KB L1 data cache. If other applications with larger buffering requirements are encountered, the buffers can be doubled or even quadrupled in size without significant overhead, because the current area requirements are so small.
5.4
Profiling Performance Overhead
Use of the profiling hardware described in Section 4 has a low performance impact. With the buffer sizes described above, we observed an average drop in execution time of 0.28% compared to running different versions of the programs without the profiling hardware. The maximum slowdown was 1.84% with moldyn during step one—after fixing overflows but before fixing violations. The additional profiling cycles changed the scheduling of the transactions and created more violations. The average additional bus bandwidth needed for profiling data is only 0.076% of available bandwidth (see the Filtered Bandwidth Usage field in Table 3). Overall, the profiling hardware can always remain enabled without significant performance loss. The average memory usage for filtered data was 1.03 MB/hr with eight 1GHz processors (see the Filtered Memory Usage field in Table 3). Because our applications are relatively short, we can continue to accumulate profiling data in memory. However, longrunning applications may continuously generate profiling data, filling an unreasonable amount of memory. To ensure that such applications do not fill memory, each data region should be of limited size and profiling data should not be generated after the region is
filled. This is acceptable since even long-running applications generally spend their time in the same set of code regions, running the same transactions and so the same profiling data will be collected repeatedly. Alternatively, different schemes could be employed to lower memory usage: increase the period between flushes or even turning the profiling hardware on and off dynamically so that specific regions in the code can be targeted.
6
Related Work
The importance of profiling for identifying performance bottlenecks and guiding optimizations has been long recognized. In the single processor environment, a number of profiling systems including specialized hardware support have been proposed. Important profiling systems that have actually been deployed commercially are the ProfileMe system from DEC [9], the VTune system from Intel [1] and the R10K [25] profile system from MIPS. Today all modern microprocessors include extensive hardware profiling support for application performance tuning. In the parallel processor environment, there are fewer examples of profiling systems. Early tools were MTOOL [10], MemSpy [15] and Paradyn [24], which were developed to optimize parallel applications for a distributed shared memory multiprocessor. MTOOL and MemSpy used simulation to characterize the memory hierarchy behavior of applications, which resulted in at least a ten times application slowdown on a single processor. These slowdowns became worse as more processors were added to the system. MemSpy provided both data structure and procedure-level information about cache misses, but did not provide application source line information. Paradyn, on the other hand, detects data sharing patterns and generates a data-centric presentation of the memory performance. In their case study of a protein-folding application, the instrumentation overhead remained a constant 2%; however, the data collection overhead grew linearly with the number of counters and timers. Although Paradyn effectively locates memory-related bottlenecks, detection of other degradations such as load imbalances and exces-
Description
Benchmark art initial + step 1 + step 2 equake initial + step 1 + step 2 lufact initial moldyn initial + step 1 + step 2 mp3d initial + step 1 quicksort initial + step 1 radix initial + step 1 + step 2 swim initial + step 1 + step 2 tomcatv initial + step 1 + step 2
Filtering Compression (%)
8P Speedup
Unfilt. Mem. Usage (BW Usage)
Filt. Mem. Usage (BW Usage)
1.09 2.92 7.30
125 MB/hr (1.83%) 156 (2.27) 48 (0.70)
0.877 MB/hr (0.0128%) 0.467 (.00680) 1.05 (0.0153)
99.3 99.7 97.8
2.87 3.00 5.90
710 (10.40) 273 (3.97) 0.6 (0.01)
0.711 (0.0104) 0.546 (0.00795) 0.0394 (0.000574)
99.9 99.8 93.8
7.53
1.3 (0.02)
0.305 (0.00444)
77.3
1.06 4.75 6.31
21 (0.30) 180 (2.63) 1.1 (0.02)
0.167 (0.00243) 0.541 (0.00788) 0.776 (0.0113)
99.2 99.7 29.2
1.05 5.32
40 (0.58) 117 (1.71)
1.85 (0.0269) 7.62 (0.111)
95.4 93.5
2.16 3.83
2.0 (0.03) 3.5 (0.05)
1.99 (0.0289) 3.5 (0.05)
0.0 0.0
1.20 7.49 7.64
0.9 (0.01) 1.4 (0.02) 1.4 (0.02)
0.182 (0.00266) 0.867 (0.0129) 0.840 (0.0122)
79.0 34.8 38.3
1.00 3.73 6.68
19 (0.06) 21 (0.16) 5 (0.00)
0.0256 (0.000374) 0.0892 (0.00130) 0.131 (0.00191)
99.4 99.2 49.5
1.48 4.71 7.16
19 (0.27) 21 (0.31) 5 (0.07)
0.204 (0.00298) 0.379 (0.00552) 0.571 (0.00832)
98.9 98.2 88.5
Image recognition / neural networks.
decreased chunking to fix overflows privatized to fix violations Seismic wave propagation simulation.
decreased chunking to fix overflows privatized to fix violations LU factorization and triangular solve. N-body particle modeling.
unordered trans. to reduce imbalance decreased chunking to fix overflows privatized to fix violations Simulate rarefied hypersonic flow.
unordered trans. to reduce imbalance split transactions to fix violations Quick sort.
unordered trans. to reduce imbalance Radix sort.
unordered trans. to reduce imbalance decreased chunking to fix overflows privatized to fix violations Shallow water modeling.
decreased chunking to fix overflows privatized to fix violations Vectorized mesh generation.
decreased chunking to fix overflows privatized to fix violations
Table 3. Details on optimization steps for each application. Speedups for eight processor runs are included. Memory usage (in MB/hr) and bandwidth requirements (in percent of available bandwidth) are reported as measured on unfiltered and filtered runs. We also report the percentage of compression provided by the hardware filters (bigger is better, 100% maximum). Note memory usage is based on a 1 GHz machine. sive barrier time require the user to formulate hypotheses to guide the tools. FlashPoint [16] makes memory system profiling more efficient by taking advantage of the programmable cache controller in the FLASH multiprocessor [14]. By extending the cache coherence protocol, it can provide cache miss statistics at the data structure level with a 10% slowdown; when these statistics are augmented with procedure information, the slowdown increases to a factor of two. Tempest has similar functionality to FlashPoint [20]. The DIGITAL Continuous Profiling Infrastructure (DCPI) is an example of a mutiprocessor profiling system designed to run continuously on production systems [6]. Unmodified applications are sampled by the DCPI programs at a high rate (over 5,200 samples/sec per 333 MHz processor) via inter-processor interrupts, and data is collected at a low 1–3% overhead. Unfortunately, due to sampling errors, the accuracy of DCPI’s estimates may vary greatly, depending on the application. Moreover, it was not designed to work with out-of-order processors.
The profiling systems discussed so far focused on identifying cache misses as the cause of performance loss in conventional shared memory parallel processors. However, it is often not straightforward to relate cache misses of various types (cold, capacity, conflict, communication, false) with the true cause of the performance bottleneck. In contrast to these approaches, TEST [8] is a profiling system for analyzing potential parallel decompositions of a sequential application for execution on a CMP with Thread-Level Speculation (TLS). The TEST profile analysis uses modified TLS support to provide information on speculative thread coverage, data dependency behavior between threads and speculative buffer requirements. The output of TEST is used to automatically direct the parallelization of Java programs in a dynamic compiler environment. The performance overheads for TEST on a range of Java applications are between 3% and 25%.
7
Conclusions
TCC provides a new shared-memory model that relies on userdefined transactions as the basic unit of work. It simplifies writing correct parallel applications and allows programmers to focus on performance issues. Nevertheless, it is important to optimize TCC applications to avoid bottlenecks such as costly overflows, expensive violations, workload imbalances, and excessively small transactions dominated by overhead. We propose TAPE, a hardware and software profiling environment to help programmers achieve good parallel performance from their applications in a few guided steps. TAPE builds on the hardware for transaction execution, adding a set of hardware filters that aggregate profiling data, filtering out infrequent events. Software processes the profiling information to emphasize critical bottlenecks. Using the proposed infrastructure, we optimized a series of benchmark applications, achieving an increase in speedup from an average of 1.5× to an average of 6.5× on 8 processors. Moreover, we demonstrate that TAPE exhibits all the desired attributes of profiling systems, namely usability, accuracy, expressiveness, and low overhead. Specifically, the die area and performance overheads of TAPE are low enough to allow for continuous profiling even on production runs, so you can “leave the TAPE on” all the time.
8
Acknowledgements
This research was sponsored by the Defense Advanced Research Projects Agency (DARPA) through the Department of the Interior National Business Center under grant number NBCH104009. The views and conclusions contained in this document are those of the authors and should not be interpreted as representing the official policies, either expressed or implied, of the Defense Advanced Research Projects Agency (DARPA) or the U.S. Government.
9
[10] A. J. Goldberg and J. L. Hennessy. Performance debugging shared memory multiprocessor programs with MTOOL. In Supercomputing ’91: Proceedings of the 1991 ACM/IEEE conference on Supercomputing, pages 481–490. ACM Press, 1991. [11] L. Hammond, B. D. Carlstrom, V. Wong, B. Hertzberg, M. Chen, C. Kozyrakis, , and K. Olukotun. Programming with transactional coherence and consistency. In ASPLOS-XI: Proceedings of the 11th Intl. Conference on Arch. Support for Programming Languages and Operating Systems, Oct. 2004. [12] L. Hammond, V. Wong, M. Chen, B. D. Carlstrom, J. D. Davis, B. Hertzberg, M. K. Prabhu, H. Wijaya, C. Kozyrakis, and K. Olukotun. Transactional memory coherence and consistency. In ISCA-31: Proceedings of the 31st International Symposium on Computer Architecture, pages 102–113, June 2004. [13] P. Kongetira. A 32-way multithreaded Sparc processor. In Conference Record of Hot Chips 16, Stanford, CA, August 2004. [14] J. Kuskin, D. Ofelt, M. Heinrich, J. Heinlein, R. Simoni, K. Gharachorloo, J. Chapin, D. Nakahira, J. Baxter, M. Horowitz, A. Gupta, M. Rosenblum, and J. Hennessy. The Stanford FLASH multiprocessor. In ISCA-21: Proceedings of the 21st International Symposium on Computer Architecture, pages 302–313, 1994. [15] M. Martonosi, A. Gupta, and T. Anderson. MemSpy: analyzing memory system bottlenecks in programs. In SIGMETRICS ’92/PERFORMANCE ’92: Proceedings of the 1992 ACM SIGMETRICS joint international conference on Measurement and modeling of computer systems, pages 1–12. ACM Press, 1992. [16] M. Martonosi, D. Ofelt, and M. Heinrich. Integrating performance monitoring and communication in parallel computers. In Measurement and Modeling of Computer Systems, pages 138–147, 1996. [17] A. McDonald et al. Characterization of TCC on ChipMultiprocessors. In PACT-XIV: The Fourteenth International Conference on Parallel Architectures and Compilation Techniques, Sept. 2005. [18] J. T. R. Kalla, B. Sinharoy. Simultaneous multi-threading implementation in POWER5. In Conference Record of Hot Chips 15 Symposium, Stanford, CA, August 2003.
References
[1] Intel Corporation, VTune: a visual tuning environment. http://support.intel.com/support/performancetools/vtune/. [2] Stanford Parallel Applications for Shared Memory, SPLASH. http://www-flash.stanford.edu/apps/SPLASH/. [3] Java Grande Forum, Java Grande http://www.epcc.ed.ac.uk/javagrande/, 2000.
Chrysos. ProfileMe : Hardware support for instruction-level profiling on out-of-order processors. In MICRO’97: International Symposium on Microarchitecture, pages 292–302, 1997.
Benchmark
Suite.
[4] V. Agarwal, M. S. Hrishikesh, S. W. Keckler, and D. Burger. Clock rate versus IPC: the end of the road for conventional microarchitectures. In ISCA-27: Proceedings of the 27th International Symposium on Computer Architecture, pages 248–259, 2000. [5] C. S. Ananian, K. Asanovi´c, B. C. Kuszmaul, C. E. Leiserson, and S. Lie. Unbounded Transactional Memory. In HPCA’05: Proceedings of the 11th International Symposium on High-Performance Computer Architecture, pages 316–327, Feb. 2005. [6] J. M. Anderson et al. Continuous profiling: where have all the cycles gone? In SOSP-XVI: Proceedings of the sixteenth ACM symposium on Operating systems principles, 1997. [7] Broadcom Corporation. The Broadcom BCM-1250 Multiprocessor. In Presentation at 2002 Embedded Processor Forum, April 2002. [8] M. Chen and K. Olukotun. TEST: a tracer for extracting speculative threads. In CGO ’03: Proceedings of the international symposium on Code generation and optimization, pages 301–312. IEEE Computer Society, 2003. [9] J. Dean, J. E. Hicks, C. A. Waldspurger, W. E. Weihl, and G. Z.
[19] R. Raman. UltraSparc Gemini: Dual CPU processor. In Conference Record of Hot Chips 15 Symposium, Palo Alto, CA, August 2003. [20] S. K. Reinhardt, R. W. Pfile, and D. A. Wood. Hardware support for flexible distributed shared memory. IEEE Transactions on Computers, 47(10):1056–1072, 1998. [21] Standard Performance Evaluation Corporation, SPEC CPU Benchmarks. http://www.specbench.org/, 1995–2000. [22] S.Woo, M. Ohara, E. Torrie, J.P.Singh, and A. Gupta. The SPLASH2 programs: Characterization and methodological considerations. In ISCA-22: Proceedings of the 22nd International Symposium on Computer Architecture, pages 24–36, June 1995. [23] M. Wolfe. High-Performance Compilers for Parallel Computing. Addison-Wesley, 1995. [24] Z. Xu, J. R. Larus, and B. P. Miller. Shared-memory performance profiling. In PPoPP-VI: Proceedings of the sixth ACM SIGPLAN symposium on Principles and practice of parallel programming, pages 240–251, 1997. [25] M. Zagha, B. Larson, S. Turner, and M. Itzkowitz. Performance analysis using the MIPS R10000 performance counters. 1996. [26] C. B. Zilles and G. S. Sohi. A programmable co-processor for profiling. In HPCA-7: Proceedings of the 7th International Symposium on High-Performance Computer Architecture, pages 241–253, 2001.