1910 • The Journal of Neuroscience, February 15, 2017 • 37(7):1910 –1924
Cellular/Molecular
Target Cell Type-Dependent Differences in Ca2⫹ Channel Function Underlie Distinct Release Probabilities at Hippocampal Glutamatergic Terminals X Tímea E´ltes,1,2* X Tekla Kirizs,1,2* X Zoltan Nusser,1 and X Noemi Holderith1 1
Laboratory of Cellular Neurophysiology, Institute of Experimental Medicine, Hungarian Academy of Sciences, 1083 Budapest, Hungary, and 2Ja´nos Szenta´gothai School of Neurosciences, Semmelweis University, 1085 Budapest, Hungary
Target cell type-dependent differences in presynaptic release probability (Pr) and short-term plasticity are intriguing features of cortical microcircuits that increase the computational power of neuronal networks. Here, we tested the hypothesis that different voltage-gated Ca 2⫹ channel densities in presynaptic active zones (AZs) underlie different Pr values. Two-photon Ca 2⫹ imaging, triple immunofluorescent labeling, and 3D electron microscopic (EM) reconstruction of rat CA3 pyramidal cell axon terminals revealed ⬃1.7–1.9 times higher Ca 2⫹ inflow per AZ area in high Pr boutons synapsing onto parvalbumin-positive interneurons (INs) than in low Pr boutons synapsing onto mGluR1␣-positive INs. EM replica immunogold labeling, however, demonstrated only 1.15 times larger Cav2.1 and Cav2.2 subunit densities in high Pr AZs. Our results indicate target cell type-specific modulation of voltage-gated Ca 2⫹ channel function or different subunit composition as possible mechanisms underlying the functional differences. In addition, high Pr synapses are also characterized by a higher density of docked vesicles, suggesting that a concerted action of these mechanisms underlies the functional differences. Key words: Ca 2⫹; electron microscopy; EM tomography; hippocampus; immunogold labeling; two-photon imaging
Significance Statement Target cell type-dependent variability in presynaptic properties is an intriguing feature of cortical synapses. When a single cortical pyramidal cell establishes a synapse onto a somatostatin-expressing interneuron (IN), the synapse releases glutamate with low probability, whereas the next bouton of the same axon has high release probability when its postsynaptic target is a parvalbuminexpressing IN. Here, we used combined molecular, imaging, and anatomical approaches to investigate the mechanisms underlying these differences. Our functional experiments implied an approximately twofold larger Ca 2⫹ channel density in high release probability boutons, whereas freeze–fracture immunolocalization demonstrated only a 15% difference in Ca 2⫹ channel subunit densities. Our results point toward a postsynaptic target cell type-dependent regulation of Ca 2⫹ channel function or different subunit composition as the underlying mechanism.
Introduction Target cell type-dependent differences in the probability of glutamate release (Pr) and the consequent differences in short-term plasticity are well established phenomena of cortical microcirReceived June 24, 2016; revised Jan. 4, 2017; accepted Jan. 10, 2017. Author contributions: Z.N. and N.H. designed research; T.E., T.K., and N.H. performed research; T.E., T.K., Z.N., and N.H. analyzed data; Z.N. and N.H. wrote the paper. Z.N. is supported by the Hungarian Academy of Sciences Momentum (Lendu¨let Grant LP2012–29) and the European Research Council (Advanced Grant 293681). N.H. is supported by the Hungarian Academy of Sciences (Janos Bolyai Scholarship). We thank E´va Dobai and Do´ra Ro´nasze´ki for excellent technical assistance; Borba´la Bolonyai for contributing to the quantification of Elfn1/2-mGluR1␣ colocalization and Neurolucida reconstructions; Miklo´s Szoboszlay for writing the gold distribution analysis software; Csaba Csere´p for invaluable help in EM tomography; Balazs Hangya, Judit Makara, and Gabor Makara for help with statistical analysis; and Mark Eyre for comments on the manuscript. The authors declare no competing financial interests. *T.E. and T.K. contributed equally to this work.
cuits. Two decades ago, Thomson (1997) reported that neocortical pyramidal cell (PC)-to-PC connections showed paired-pulse depression, whereas PC-to-certain interneuron (IN) synapses displayed robust short-term facilitation. Later, a similar phenomenon was found in the hippocampus (Ali and Thomson, 1998; Ali et al., 1998; Scanziani et al., 1998; Losonczy et al., 2002), where combined functional and molecular neuroanatomical approaches led to the identification of the postsynaptic IN types. Somatostatin and metabotropic glutamate receptor 1␣ (mGluR1␣)-expressing, oriens–lacunosum moleculare (O-LM) and oriens– bistratified Correspondence should be addressed to either Zoltan Nusser or Noemi Holderith, Laboratory of Cellular Neurophysiology, Institute of Experimental Medicine, Hungarian Academy of Sciences, Szigony Str. 43, 1083 Budapest, Hungary. E-mail:
[email protected] or
[email protected]. DOI:10.1523/JNEUROSCI.2024-16.2017 Copyright © 2017 the authors 0270-6474/17/371910-15$15.00/0
E´ltes, Kirizs et al. • Target Cell Type-Dependent Differences in Presynaptic Ca2⫹ Channel Function
(O-Bi) INs of the CA1 area receive facilitating EPSCs with low initial Pr, whereas synaptic inputs onto fast-spiking (FS) parvalbumin (PV)-expressing INs (e.g., basket, axo-axonic, bistratified cells) display short-term depression and have high initial Pr (Atwood and Karunanithi, 2002; Losonczy et al., 2002; Biro´ et al., 2005; Koester and Johnston, 2005; Mercer et al., 2012). Simultaneous recordings between a presynaptic PC and two distinct types of IN revealed that the axon of a single PC can transmit different aspects of information coded in a complex spike train to distinct postsynaptic cell types (Markram et al., 1998b, 1998a; Reyes et al., 1998; Pouille and Scanziani, 2004; Koester and Johnston, 2005). It has also been demonstrated that distinct types of short-term plasticity enable neuronal networks to perform complex computations (Pouille and Scanziani, 2004), but almost nothing is known about the mechanisms underlying these functional differences. A candidate protein bestowing different Pr and short-term plasticity to axon terminals was mGluR7, a metabotropic glutamate receptor that shows postsynaptic target cell type-dependent differences in its presynaptic density (Shigemoto et al., 1996). However, a group III mGluR-specific antagonist failed to abolish the differences in short-term plasticity of synapses expressing or lacking mGluR7 (Losonczy et al., 2003). More recently, Sylwestrak and Ghosh (2012) identified the extracellular leucinerich repeat fibronectin-containing protein 1 (Elfn1) as a key molecule in bestowing short-term facilitation. This protein is selectively expressed postsynaptically in O-LM cell somata and dendrites and imposes facilitating neurotransmitter release to the presynaptic axon terminals. Although, to date, there are no data available regarding the mechanisms underlying the low initial Pr of these facilitating synapses, Rozov et al. (2001) put forward an elegant hypothesis based on their experiments involving fast and slow Ca 2⫹ buffers. They postulated that the low initial Pr of facilitating cortical PC synapses can be explained by a larger coupling distance between voltage-gated Ca 2⫹ channels and Ca 2⫹ sensors on the docked vesicles compared with the high Pr PC synapses on FS INs. Assuming similar Ca 2⫹ sensors and docked vesicle distributions, this would suggest a lower average Ca 2⫹ channel density within the AZs of low Pr synapses. Here, we tested this hypothesis with two independent methods. First, using two-photon Ca 2⫹ imaging in hippocampal CA3 PC axon terminals, post hoc immunohistochemical identification of their postsynaptic target cells, followed by 3D electron microscopy (EM) reconstructions of the imaged boutons, we estimated the amount of Ca 2⫹ entering the bouton (peak concentration ⫻ the bouton volume) and divided it by the AZ area. We refer to this as our “functional Ca 2⫹ channel density” estimate. For the second method, we also measured the densities and distribution of Cav2.1 and Cav2.2 voltage-gated Ca 2⫹ channel subunits in presynaptic AZs using SDS-digested freeze–fracture replica immunogold labeling (SDS-FRL), which we refer to as “Ca 2⫹ channel density.” Finally, we assessed the densities of docked vesicles in boutons with different postsynaptic target cell types using EM tomography.
Materials and Methods Slice preparation and electrophysiological recordings. Male Wistar rats (14 –17 d old, n ⫽ 97) were killed by decapitation in accordance with the Hungarian Act of Animal Care and Experimentation (1998, XXVIII, section 243/1998) and with the ethical guidelines of the Institute of Experimental Medicine Protection of Research Subjects Committee. The animals were housed in the vivarium of the Institute of Experimental Medicine in a normal 12 h/12 h light/dark cycle. Young experimental
J. Neurosci., February 15, 2017 • 37(7):1910 –1924 • 1911
animals were kept in a cage with their mothers and were used before weaning. Acute hippocampal slices were prepared as described previously (Holderith et al., 2012). Briefly, after decapitation, the brain was quickly removed and placed into an ice-cold cutting solution containing the following (in mM): sucrose, 205.2; KCl, 2.5; NaHCO3, 26; CaCl2, 0.5; MgCl2, 5; NaH2PO4, 1.25; and glucose, 10, saturated with 95% O2 and 5% CO2. Then, 300-m-thick horizontal slices were cut from the ventral part of the hippocampus using a Leica Vibratome (VT1200S) and were incubated in an interface-type holding chamber in ACSF containing the following (in mM): NaCl, 126; KCl, 2.5; NaHCO3, 26; CaCl2, 2; MgCl2, 2; NaH2PO4, 1.25; and glucose, 10, saturated with 95% O2 and 5% CO2, pH 7.2–7.4, at 36°C, and were then kept at 22–24°C. Recordings were performed in the same ACSF at 22–24°C up to 6 h after slicing. Cells were visualized using a Femto2D microscope equipped with oblique illumination and a water-immersion lens [25⫻, numerical aperture (NA) ⫽ 1.05, Olympus, or 25⫻, NA ⫽ 1.1, Nikon). Whole-cell voltage- or current-clamp recordings were performed from CA3 PCs or INs located in the strata oriens and pyramidale using MultiClamp 700A and B amplifiers (Molecular Devices). Recorded traces were filtered at 3– 4 kHz and digitized online at 20 kHz. Patch pipettes (resistance 3– 6 M⍀) were pulled from thick-walled borosilicate glass capillaries with an inner filament. Intracellular solution contained the following (in mM): K-gluconate, 110; KCl, 5; creatine phosphate, 10; HEPES, 10; ATP, 2; GTP, 0.4; and biocytin, 5, pH 7.3; 290 –300 mOsm. For voltage-clamp recordings of evoked EPSCs in INs, the intracellular solution contained picrotoxin (0.6 – 0.8 mM). For current-clamp recordings and Ca 2⫹ imaging in PC axons, 100 or 300 M Fluo5F (Invitrogen) and 20 M Alexa Fluor 594 (Invitrogen) were added to the intracellular solution. The firing pattern of the INs was determined with a series of 500-mslong hyperpolarizing and depolarizing current pulses with amplitudes of 125–500 pA. A cell was considered fast spiking if the average firing frequency exceeded 70 Hz. For extracellular stimulation, a unipolar stimulating electrode was placed in the stratum oriens at least 100 m away from the soma. INs were held at ⫺70 mV and 5 stimuli (0.2– 0.3 ms duration, 20 –200 A) at 40 or 50 Hz with 30 s interstimulus interval (15–70 repetitions) were applied. Data from 40 and 50 Hz stimulations were pooled (see Fig. 1I ). To be able to assess the Elfn1/2 expression in mGluR1␣ ⫹ cells with different short-term plasticity, cells with inputs exhibiting short-term depression (⬃10% in the random mGluR1␣ ⫹ population) were searched for selectively (see Fig. 1 J, K ). Series resistance was monitored and was ⬍20 M⍀. Pyramidal cells were held at ⫺70 mV (with a maximum of ⫺100 pA DC current) and single action potentials (APs) at 0.05– 0.016 Hz were evoked with 2- to 4-ms-long depolarizing current pulses (1–1.2 nA). Peak amplitude and full width at half-maximal amplitude of the APs were monitored and cells were rejected if any of these parameters changed ⬎10%. Two-photon [Ca 2⫹] imaging. Experiments were performed with a Femto2D (Femtonics) laser scanning microscope equipped with a MaiTai femtosecond pulsing laser tuned to 810 nm (described in Holderith et al., 2012). Electrophysiological data and image acquisition were controlled with software written in MATLAB (The MathWorks). Cells were filled for 2 h with a Ca 2⫹-insensitive (20 M Alexa Fluor 594) and a Ca 2⫹-sensitive fluorophore (100 or 300 M Fluo5F). Boutons were selected at 150 –300 m distances from the soma on the second- and thirdorder collaterals of the main axon in the stratum oriens at 35– 80 m slice depth. They were imaged in line scan mode (scan duration 500 or 1200 ms at 1 kHz, 1–3 per minute repetition, 2–3 scans averaged for each bouton) with a laser intensity of 2– 6 mW at the back aperture of the objective lens. Single AP-evoked changes in fluorescence were quantified during the recording as ⌬G/R(t) ⫽ (Fgreen(t) ⫺ Frest, green)/(Fred ⫺ Idark, red) where Fgreen(t) represents the green fluorescence signal as a function of time, Frest, green is the green fluorescence before stimulation, and Idark, red is the dark current in the red channel. To normalize data across batches of dyes, Gmax/R values were measured by imaging a sealed (tip melted and closed by heating) pipette filled with intracellular solution containing 10 mM CaCl2 for each cell at the same position where the boutons were imaged. ⌬G/R measurements from boutons were divided by Gmax/R, yielding the reported values of G/Gmax. The effects of 50 M CdCl2 and 1 M -CTX MVIIC (diluted in 1 mg/ml BSA; Tocris Bioscience and
1912 • J. Neurosci., February 15, 2017 • 37(7):1910 –1924
Alomone Laboratories) were tested by comparing the peak amplitudes of presynaptic [Ca 2⫹] transients in individual boutons averaged from two to three consecutive scans in control conditions and after 10 (for CdCl2) or 30 min (for -CTX MVIIC) of wash-in of the drug. Tissue processing. After recordings, the slices were fixed in a solution containing 4% paraformaldehyde (PFA), 0.2% picric acid in 0.1 M phosphate buffer (PB), pH 7.4, at 4°C for either 12–36 h (PV or mGluR1␣ immunolabeling) or 1–3 h (for Elfn1/2 labeling). Slices containing filled PCs were incubated in 10% and 20% sucrose as a cryoprotectant, repeatedly freeze-thawed above liquid nitrogen, embedded in agarose (2%), and resectioned at 70 –90 m thickness. Slices containing filled INs were immunolabeled without resectioning. For quantification of colocalization of mGluR1␣ and Elfn1/2 (n ⫽ 6) and for mGluR1␣ and PV (n ⫽ 3) 14- to 17-d-old male Wistar rats were deeply anesthetized and transcardially perfused with ice-cold fixative containing 2% or 4% PFA and 0.2% picric acid in 0.1 M PB for 25 min. The brains were then quickly removed from the skull and placed in 0.1 M PB. For serial EM reconstructions and EM tomography, the fixative contained 2% PFA and 1% glutaraldehyde (GA) in 0.1 M sodium acetate buffer, pH 6, for 2 min, followed by 45 min of perfusion with 2% PFA and 1% GA in 0.1 M borate buffer, pH 9, in 14- to 17-d-old male Wistar rats (n ⫽ 6). The brains were left in the skull overnight and then removed and placed in 0.1 M PB. Next, 60-m-thick sections were cut from the ventral hippocampus. Light microscopy. Sections/slices were washed in 0.1 M PB and blocked in normal goat serum (NGS, 10%) for 1 h made in Tris-buffered saline (TBS; pH 7.4), incubated in the following primary antibodies: mouse anti-PV (1:1000, RRID:AB_10000343; Swant); rabbit anti-PV (1:1000, RRID:AB_1210396; Synaptic Systems), guinea pig anti-mGluR1␣ (1:1000, RRID:AB_2531897; Frontier Institute; Mansouri et al., 2015), or rabbit anti-Elfn1/2 (1:500, RRID:AB_1079280; Sigma-Aldrich) diluted in TBS containing 2% NGS. After several washes, the following secondary antibodies were applied: Alexa Fluor 488- or Cy5-conjugated goat antimouse or goat anti-rabbit and Cy3-conjugated donkey anti-guinea pig IgGs. Biocytin was visualized with Alexa Fluor 488-conjugated (Invitrogen) or Cy5-conjugated (Jackson Laboratories) streptavidin (1:500). Sections were mounted in Vectashield (Vector Laboratories). Image stacks were acquired with an Olympus FV1000 confocal microscope with 20⫻ and 60⫻ (oil-immersion) objectives. Contacts between PC boutons and IN dendrites were considered as putative synapses if they had no apparent gap between them in the focal plane. EM. For standard transmission EM and EM tomography, biotinylated goat anti-mouse, goat anti-rabbit, and goat anti-guinea pig secondary antibodies were used (Vector Laboratories, 1:50). Reactions and biocytin in the filled cells (after fluorescent examination) were visualized using an avidin-biotin-horseradish peroxidase complex (Vector Laboratories) and 3–3⬘-diaminobenzidine tetrahydrochloride as chromogen. Sections were treated with 1% OsO4, stained in 1% uranyl acetate, dehydrated in a graded series of ethanol, and embedded in epoxy resin (Durcupan). Representative cells were reconstructed using the Neurolucida system (MicroBrightField) attached to a Zeiss Axioscope2 microscope using 40⫻ or 100⫻ oil-immersion objectives. Imaged axon segments were reembedded and sectioned at 60 nm. Digital images from serial EM sections were taken from the identified imaged boutons or randomly selected PV ⫹ or mGluR1␣ ⫹ dendrites in the stratum oriens at magnifications of 7500⫻ or 10,000⫻ with a Jeol model 1011 EM. Boutons were 3D reconstructed and their volumes and the area of the AZ (equal to the corresponding PSD) were measured using Reconstruct software (http:// synapses.clm.utexas.edu/). In the case of multiple AZ boutons (12% in PV and 9% in mGluR1␣ targeting population), the total AZ area was calculated by summing the individual AZ areas (see Fig. 3E). EM tomography. Sections (200 nm thick) were cut and protein A-conjugated 10 nm gold particles (Cytodiagnostic) were applied on both sides as fiducial markers. Immunolabeled dendritic segments (n ⫽ 3 age-matched rats) were randomly selected in the stratum oriens. Single-axis tilt series of perpendicularly oriented synapses were acquired using a Tecnai G2 Spirit BioTWIN transmission EM operating at 120 kV and equipped with an Eagle 4K HS digital camera (Fei Europe Nanoport). Tilt series were recorded between ⫾ 65° (with 2° increments be-
E´ltes, Kirizs et al. • Target Cell Type-Dependent Differences in Presynaptic Ca2⫹ Channel Function
tween ⫾ 45° and with 1° increments between ⫾45° and 65°) at 30 000⫻ magnification using Fei Xplore3D. Tomographic volumes were reconstructed using the IMOD package (Kremer et al., 1996; Imig et al., 2014) and exported without binning as z-stacks for analysis (320 images per subvolume, resulting an 0.6 nm virtual pixel size in the Z dimension). AZ area and vesicle distance from the presynaptic membrane were measured with Reconstruct software. A vesicle was considered to be docked if the outer part of the lipid bilayer was in direct contact with the inner part of the AZ membrane bilayer. A vesicle was considered to be predocked if the distance between these lipid bilayers did not exceed 5 nm. The “membrane-proximal” population was pooled from docked and predocked populations. SDS-FRL. Eight male Wistar rats (postnatal day 15–17) were deeply anesthetized and transcardially perfused with a fixative containing 2% PFA and 0.2% picric acid in 0.1 M PB for 15 min. The brains were then quickly removed from the skull and placed in 0.1 M PB. Horizontal sections of 80 m thickness were cut from the forebrain with a vibratome and cryoprotected in 30% glycerol. Small blocks from the ventral CA3 area were frozen with a high-pressure freezing machine (HPM100; Leica Microsystems), fractured with a freeze-fracture machine (BAF060; Leica Microsystems), and processed for SDS-FRL as described previously (Kerti et al., 2012). Tissue debris was digested from the replicas in a TBS solution containing 2.5% SDS and 20% sucrose at 80°C overnight. The replicas were then washed and blocked with 5% BSA in TBS for 1 h followed by an incubation in a solution of the following primary antibodies: rabbit anti-Cav2.1 (1:500 or 1:600, catalog #152 203, RRID: AB_2619841, Synaptic Systems; this Ab provides identical labeling to that of a guinea pig anti-Cav2.1, the specificity of which was proven in Holderith et al., 2012) rabbit anti-Cav2.2 (1:400, catalog #152 303, RRID: AB_2619844 Synaptic Systems; specificity of the reaction with this Ab is verified in Lenkey et al., 2015), rabbit anti-Kv3.1b (1:200 –1:250, RRID: AB_2040166; Alomone), guinea pig anti-mGluR1␣ (1:100, RRID: AB_2531897; Frontier Institute). Replicas then were washed and incubated in a solution containing the following secondary antibodies: goat anti-rabbit IgGs coupled to 5 or 10 nm gold particles (1:75 or 1:100; British Biocell) and goat anti-guinea pig IgGs coupled to 15 nm gold particles (1:75 or 1:100; British Biocell). Replicas were rinsed in TBS and distilled water before they were picked up on copper parallel bar grids and examined with a Jeol model 1011 EM. All antibodies used in this study recognized intracellular epitopes on their target proteins and thus were visualized by gold particles on the protoplasmic face (P-face). The nonspecific background labeling was measured on surrounding extracellular face (E-face) structures. To quantify the Cav2.1 and the Cav2.2 subunit densities in the AZs of axon terminals targeting Kv3.1b ⫹ or mGluR1␣ ⫹ dendrites, all experiments were performed using the “mirror replica method” (Hagiwara et al., 2005). With this method, replicas are generated from both matching sides of the fractured tissue surface, allowing the examination of the corresponding E- and P-faces of exactly the same membranes. The AZs were delineated on the P-face based on the underlying high density of intramembrane particles. Gold particles inside the synaptic area and up to 30 nm away from its edge were counted. Axon terminals containing Cav subunit labeling without an elevated density of intramembrane particles were discarded from the analysis because this is a characteristic feature of inhibitory terminals (Lenkey et al., 2015). All AZs, fractured partially or in their completeness, were quantified. When the synaptic area was not flat, the replica was tilted. To eliminate reaction-to-reaction variability in the Cav subunit labeling, synaptic, extrasynaptic bouton, and background Cav densities were normalized to the mean of the Cav densities measured in the AZs targeting mGluR1␣ ⫹ profiles in each reaction. Analysis of the sub-AZ distribution of immunoreactive Cav2.1 and Cav2.2 subunits. To investigate whether the within-AZ distribution of gold particles labeling the Cav2.1 or Cav2.2 subunits is different from random distributions, we computed two measures using software developed in-house. First, we calculated the mean of the nearest neighbor distances of all gold particles within an AZ (NND) and that of random distributed gold particles within the same AZ (same number of gold particles, 1000 repetitions). The NND’s were then compared statistically
E´ltes, Kirizs et al. • Target Cell Type-Dependent Differences in Presynaptic Ca2⫹ Channel Function
J. Neurosci., February 15, 2017 • 37(7):1910 –1924 • 1913
Results
1I ). These results clearly demonstrate robust differences in the short-term plasticity of evoked EPSCs in PV ⫹ and mGluR1␣ ⫹ INs in the CA3 area similar to those observed in the CA1 area and the neocortex, offering the use of these molecules in this brain region as markers to label the postsynaptic compartments of functionally distinct presynaptic axon terminals. Because 75% of mGluR1␣ ⫹ cells also contain low amounts of PV in the dorsal hippocampal CA1 area (Ferraguti et al., 2004), we performed colocalization of these two molecules in the dorsal and ventral CA1 and CA3 areas. Our results confirmed those of Ferraguti et al. (2004) revealing 66 ⫾ 4% and 65 ⫾ 21% colocalization in the dorsal CA1 and CA3 areas, respectively. However, we found that ⬍4% of the mGluR1␣ ⫹ cells are immunopositive for PV in the ventral CA3 area. This low prevalence of colocalization was observed in perfusion-fixed brain sections (2.4 ⫾ 1.7%, n ⫽ 3 rats), as well as in immersion-fixed hippocampal in vitro slices (3.3 ⫾ 3.5%, n ⫽ 4 rats). Because Elfn1 has been demonstrated to play a critical role in the short-term facilitation of EPSCs in mGluR1␣ ⫹ O-LM cells of the CA1 region (Sylwestrak and Ghosh, 2012), we performed double immunolocalization for mGluR1␣ and Elfn1/2 in the stratum oriens of the CA3 area of perfusion fixed rats. We found that almost all (99 ⫾ 4%) Elfn1/2-immunopositive (Elfn1/2 ⫹) dendrites also contained mGluR1␣ and that, conversely, 90 ⫾ 5% of the mGluR1␣ ⫹ dendrites were also Elfn1/2 ⫹ (⬃6000 m dendrite/animal, n ⫽ 3 animals). When we tested the short-term plasticity of EPSCs in Elfn1/2 and mGluR1␣ double-labeled INs, they showed a robust short-term facilitation, the degree of which was significantly larger than that detected in mGluR1␣ ⫹, but Elfn1/2 ⫺ cells (Fig. 1 J, K ). These results reveal a previously unseen diversity among mGluR1␣ ⫹ INs and provide an explanation for the variance in the short-term plasticity of their inputs. Elfn1/2 seems to be an ideal molecular marker for postsynaptic INs that receive strongly facilitating inputs, but its post hoc visualization requires very mild fixation (see Materials and Methods) that is incompatible with post hoc recovery of axonal arbor and EM analysis. However, because 90% of mGluR1␣ ⫹ IN dendrites are also Elfn1/2 ⫹, we decided to use mGluR1␣ as our molecular marker for facilitating synapses.
Distinct short-term plasticity of EPSCs in different IN types of the hippocampal CA3 region We chose CA3 PC local axon collaterals as the subject of our study because they are amenable to presynaptic [Ca 2⫹] measurements (Holderith et al., 2012) and establish synaptic contacts onto both FS/PV-positive (PV ⫹) INs and mGluR1␣-positive (mGluR1␣ ⫹) INs. First we characterized the short-term plasticity of EPSCs recorded from PV ⫹ and mGluR1␣ ⫹ INs in the CA3 region of young Wistar rats. Whole-cell voltage-clamp recordings were performed from the somata of GABAergic INs located in the stratum oriens with biocytin-containing intracellular solutions and five EPSCs were evoked by extracellular stimulation of PC axons (Fig. 1). The cells were characterized based on their firing patterns (Fig. 1C,G), post hoc determined dendritic and axonal arbors (Fig. 1 A, E), and their PV or mGluR1␣ immunoreactivity (Fig. 1 B, F ). EPSCs evoked by a train of stimuli at 40 or 50 Hz in PV ⫹ INs showed short-term depression (EPSC fifth/EPSC first: 0.48 ⫾ 0.16, n ⫽ 10; Fig. 1 D, I ). In contrast, five stimuli elicited facilitating EPSCs in mGluR1␣ ⫹ INs (EPSC fifth/ EPSC first ⫽ 3.0 ⫾ 1.9, n ⫽ 31; Fig. 1 H, I ). Although the mGluR1␣ ⫹ cells showed marked heterogeneity based on their dendritic and axonal arbors, firing patterns, and short-term plasticity, their excitatory inputs showed a different short-term plasticity pattern compared with those recorded from PV ⫹ cells (Fig.
Target cell type-dependent differences in Ca 2ⴙ inflow at the AZ First, we opted for a combined functional and morphological approach to estimate the functional Ca 2⫹ channel density in the presynaptic AZs of CA3 PCs (Holderith et al., 2012). This approach requires the measurements of [Ca 2⫹] in local axon terminals of PCs using two-photon microscopy with an intracellularly applied Ca 2⫹-sensitive dye (300 M Fluo5F; Fig. 2). Single APevoked [Ca 2⫹] transients showed sizeable variability in their peak amplitudes (coefficient of variation ⫽ 0.37, n ⫽ 692 boutons in 30 cells). To examine [Ca 2⫹] specifically in axon terminals with identified postsynaptic target cell types, we fixed the slices after the in vitro imaging experiments and then visualized the intracellular biocytin and immunolabeled the tissue for mGluR1␣ and PV for confocal microscopy analysis (Fig. 2D–G). In most experiments, we imaged 15–30 boutons, of which few had apparently PV ⫹ or mGluR1␣ ⫹ dendrites as postsynaptic targets. From the total of 692 imaged boutons, we found 26 and 61 as potential presynaptic elements to PV ⫹ and mGluR1␣ ⫹ INs, respectively. Our post hoc analysis revealed that the peak amplitude of the [Ca 2⫹] transient was 1.25 times larger in PV ⫹ dendrite-targeting boutons compared with their mGluR1␣ ⫹ dendrite-targeting counterparts (PV: median: 0.134 G/Gmax, IQR: 0.105– 0.168
using the Wilcoxon signed-rank test. In our second approach, we computed a 2D spatial autocorrelation function [g(r)] for our experimental data and for their random controls based on the methods of Veatch et al. (2012). The g(r) reports the probability of finding a second gold particle at a given distance r away from a given gold particle (Veatch et al., 2012). For randomly distributed gold particles, g(r) ⫽ 1, whereas spatial inhomogeneities result in g(r) values ⬎1 at short distances. In our experiments, we computed the g(r) for 0 ⬍ r ⬍ 80 nm and then their mean ( g共r兲) was calculated and compared with those obtained from random distributions using the Wilcoxon signed-rank test. Quantification of mGluR1␣ and Elfn1/2, and mGluR1␣ and PV colocalization. Colocalization of immunolabeled somata and dendrites was assessed in image stacks acquired with an Olympus FV1000 confocal microscope with 20⫻ (somata) or 60⫻ (dendrites) objectives in randomly selected areas of the CA3 stratum oriens for Elfn1/2 and dorsal and ventral CA1 and CA3 areas for PV. Image stacks were acquired at 20⫻ magnification and cells were quantified in ROIs of 200 ⫻ 600 ⫻ 60 m using Fluoview software. Image stacks at 60⫻ magnification were imported into Neurolucida software and the total lengths of single- and double-labeled dendrites were measured in ROIs of 70 ⫻ 70 ⫻ 36 m. Data analysis and statistical tests. Analysis of electrophysiological and two-photon imaging data was performed using specialized MATLABbased software (The MathWorks). Data were plotted using OriginPro. Normality of data was assessed using Shapiro–Wilks test; statistical significance was assessed with t test (independent two-sample with unequal variances; see Table 1) when the distribution was not statistically different from normal. For non-normal distributions and when the sample size was small, either Mann–Whitney (MW) U test (two unpaired groups; see Figs. 2J, 3 D, E, 4O–Q, 7G,H ), or Wilcoxon signed-rank test (two paired groups; see Figs. 5 P, R, 6 K, L), or Kruskal–Wallis test (multiple unpaired groups) with MW U test with Bonferroni adjustment [see Figs. 2I (3 groups), 5O (5 groups), 6J (5 groups)] were used. For the comparison of the short-term plasticity of evoked EPSCs, two-way repeated-measures ANOVA with Bonferroni post hoc test was used (see Fig. 1). Power analysis were performed and predicted a power of 0.8 for every dataset in Figures 2 and 3 and 0.75 for data in Figure 7. Data are presented as mean ⫾ SD for normally distributed data or median and interquartile ranges (IQRs) for non-normal distributions. Results were considered significant when p ⬍ 0.05. In all figures, *p ⬍ 0.05, **p ⱕ 0.01, ***p ⱕ 0.001.
1914 • J. Neurosci., February 15, 2017 • 37(7):1910 –1924
E´ltes, Kirizs et al. • Target Cell Type-Dependent Differences in Presynaptic Ca2⫹ Channel Function
G/Gmax, n ⫽ 26; mGluR1␣: median: 0.107 G/Gmax, IQR: 0.081– 0.138 G/Gmax, n ⫽ 61, unidentified target: median: 0.114 G/Gmax, IQR: 0.084 – 0.145 G/Gmax, n ⫽ 605; Fig. 2I, Table 1). To minimize potential errors caused by slightly different dye concentrations in distinct PCs, we calculated peak amplitude ratios with two other methods. First, we restricted our analyses to cells that contained both PV ⫹ and mGluR1␣ ⫹ dendrite-targeting boutons and calculated within-cell ratios and found a similar 1.28 times higher value in boutons targeting PV ⫹ dendrites (n ⫽ 10 cells). Second, we normalized the peak amplitude of the [Ca 2⫹] transients in each PV ⫹ and mGluR1␣ ⫹ dendriteinnervating bouton to the mean of peak amplitudes recorded from all boutons of a given cell and again found a 1.21 times larger value in boutons targeting PV ⫹ dendrites. In a separate set of experiments, we performed [Ca 2⫹] imaging with 100 M Fluo5F and calculated the above mentioned peak amplitude ratios. The within-cell ratio of peak [Ca 2⫹] in boutons innervating PV ⫹ or mGluR1␣ ⫹ dendrites was 1.32 (n ⫽ 11 cells), whereas the [Ca 2⫹] transients in PV or mGluR1␣innervating boutons normalized to the mean [Ca 2⫹] transients were 1.33 (n ⫽ 18) and 1.04 (n ⫽ 35), respectively, yielding a ratio of 1.27 (Table 1). Because Sylwestrak and Ghosh (2012) reported the presence of kainate receptors in axon terminals innervating mGluR1␣ ⫹ O-LM cells that could potentially contribute to the presynaptic [Ca 2⫹], we examined the effect of a nonselective voltagegated Ca 2⫹ channel blocker. We found that 50 M Cd 2⫹ caused a similar reduction in the peak [Ca 2⫹] in mGluR1␣ ⫹ dendrite-innervating boutons (89 ⫾ 10% block n ⫽ 8) compared with that of unidentified targets (87 ⫾ 10% block, n ⫽ 36 in n ⫽ 4 cells), ruling out a significant 4
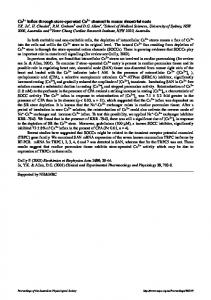
Figure 1. Short-term plasticity of CA3 pyramidal cell synapses contacting PV ⫹ or mGluR1␣ ⫹ INs. A, Neurolucida reconstruction of an in vitro recorded basket cell in stratum pyramidale (str. pyr.) of the CA3 region of the hippocampus (soma and dendrites orange, axon black). B, Confocal image of the biocytin-filled IN (left) showing immunoreactivity for PV (right). Arrows indicate PV immunoreactivity of the biocytin-filled boutons. C, Membrane potential responses upon depolarizing and hyperpolarizing current injections. The depolarizing suprathreshold response shows FS characteristics. D, EPSCs (average of 20 traces) evoked by extracellular stimulation in the stratum oriens (str. ori.) display short-term depression. E, Neurolucida reconstruction of an in vitro recorded and biocytin-filled oriens-bistratified IN (soma and dendrites blue, axon black) in the str. ori. F, The biocytin-filled cell (left) is intensely labeled for mGluR1␣ (right). G, Membrane potential responses to hyperpolarizing and depolarizing current pulses. Firing pattern shows moderate spike frequency adaptation and amplitude accommodation. Note the prominent sag and the slow membrane time constant in response to the hyperpolarizing current step. H, Extracellular-stimulation-evoked EPSCs
display short-term facilitation (average of 20 traces). I, Shortterm plasticity of evoked EPSCs onto PV ⫹ and mGluR1␣ ⫹ INs differs significantly ( p ⬍ 0.01 for cell type, p ⫽ 0.2 for stimulus number and p ⫽ 0.01 for cell type and stimulus number interaction, two-way repeated-measures ANOVA, Bonferroni post hoc test). J, A biocytin-filled IN is intensely labeled for mGluR1␣ and Elfn1/2. K, Peak amplitudes of evoked EPSCs onto mGluR1␣ and Elfn1/2 double-positive INs are significantly larger ( p ⬍ 0.05 for cell type, p ⫽ 0.31 for stimulus number and p ⫽ 0.17 for cell type and stimulus number interaction, two-way repeated-measures ANOVA, Bonferroni post hoc test) than those recorded from mGluR1␣-positive, but Elfn1/2-negative cells. str. luc., Stratum lucidum; str. rad., stratum radiatum; str. l-m, stratum lacunosum-moleculare. Data are presented as mean ⫾ SD.
E´ltes, Kirizs et al. • Target Cell Type-Dependent Differences in Presynaptic Ca2⫹ Channel Function
J. Neurosci., February 15, 2017 • 37(7):1910 –1924 • 1915
Figure 2. Larger [Ca 2⫹] transients in PV ⫹ than in mGluR1␣ ⫹ dendrite-contacting boutons. A, Two-photon (2P) image stack of a CA3 PC basal dendritic tree and axonal arbor filled with 20 M Alexa Fluor 594 (Alexa594, red), 300 M Fluo5F, and biocytin. Boxed area is shown at higher magnification in C. Diagram at the upper left corner illustrates the position of the cell in the CA3 area. B, Neurolucida reconstruction of the cell shown in A. Boxed areas correspond to A and C. C, D, High-magnification two-photon (C) and confocal (D) images of the scanned axon collaterals after fixation and visualization of the biocytin. Numbers indicate the boutons that have been line scanned. Inset in C shows bouton #1 at a higher magnification. The line indicates the position of the line scan. E–G, Some of the imaged boutons are in contact with PV (E,F, boutons #6 and #12) or mGluR1␣ (G, boutons #15 and #16) immunolabeled dendrites (biocytin: white, PV: orange, mGluR1␣: cyan). H, Single AP-evoked [Ca 2⫹] transients (n ⫽ 16 transients from 16 boutons, each trace is the average of two scans) recorded in the axon terminals shown in C. Orange and cyan traces are transients from PV ⫹ and mGluR1␣ ⫹ dendrite-contacting boutons, respectively. Inset shows the same traces after Gaussian filtering on an extended time scale. I, Peak [Ca 2⫹] transient amplitudes are significantly larger (Kruskal–Wallis test: p ⫽ 0.01,MWUposthoctest,p⫽0.01betweenunidentifiedandPVandp⫽0.01betweenPVandmGluR1␣)inPV ⫹ (orange)thaninmGluR1␣ ⫹ dendrite-contacting(cyan)orallotherboutons(gray,n⫽605 boutons from 30 cells). Black symbols correspond to individual data points obtained from the cell shown in A–G. J, Averaged [Ca 2⫹] transients recorded with 100 M Fluo5F in PV ⫹ (orange) or mGluR1␣ ⫹ (cyan) dendrite-targeting boutons. Mono-exponential fits show similar decay kinetics. Inset shows the individual decay time constant values in 18 PV ⫹ and 35 mGluR1␣ ⫹ dendrite-innervating boutons. The two populations are not significantly different (p ⫽ 0.61, MW U test). Circles indicate individual boutons, boxes indicate IQRs, and horizontal bars indicate medians.
cell-type-dependent differential contribution of kainate receptors to single AP-evoked presynaptic [Ca 2⫹] transients. To assess the contribution of the N/P/Q-type Ca 2⫹ channels to the [Ca 2⫹] transients, we applied -CTX MVIIC (a selective N- and P/Qtype Ca 2⫹ channel blocker) in a concentration (1 M) that almost completely abolishes the evoked EPSCs in both PV ⫹ (96 ⫾ 3% block, n ⫽ 4 cells) and mGluR1␣ ⫹ (93 ⫾ 7% block, n ⫽ 6) INs in the stratum oriens of the CA3 area. The toxin reduced the peak amplitude of the presynaptic [Ca 2⫹] transients by 45 ⫾ 10% (n ⫽ 12 PV-innervating boutons) and 46 ⫾ 18% (n ⫽ 19 mGluR1␣innervating boutons), demonstrating a similar contribution of these channels to the [Ca 2⫹] transients in the two bouton populations. A larger [Ca 2⫹] transient might be the consequence of lower 2⫹ Ca buffering, a smaller bouton volume, or a larger amount of Ca 2⫹ entering the bouton. To assess potential differences in Ca 2⫹ buffering in these boutons, which were often only a few micrometers away from each other (interbouton distance: 6.4 ⫾ 3.5 m) on the same axon branch, we first fitted the decay of the grand total averaged [Ca 2⫹] transients with single exponentials and found very similar time constants (PV: 352 ms vs mGluR1␣: 413 ms). However, the high fluorescent dye concentration (300 M) used in these experiments might dominate the decay, masking potential differences in the fixed buffer concentration. To circumvent this problem, we recorded [Ca 2⫹] transients with
100 M Fluo5F and analyzed their decay times (Fig. 2J ). The [Ca 2⫹] transients recorded with lower dye concentrations displayed a substantially faster decay (300 M: 463 ms vs 100 M: 210 ms, fitted to the first 260 ms of the averaged traces). When the decay time constants of [Ca 2⫹] transients were compared in boutons innervating PV ⫹ and mGluR1␣ ⫹ dendrites, no significant difference was found (PV: median: 277 ms, IQR: 212– 403 ms, n ⫽ 18; mGluR1␣: median: 259 ms, IQR: 207–322 ms, n ⫽ 35; p ⫽ 0.61, MW U test; Fig. 2J ), arguing against a robust difference in Ca 2⫹ buffering. To test potential differences in bouton volumes, we performed 3D EM reconstructions of PV ⫹ or mGluR1␣ ⫹ dendritic segments together with their presynaptic axon terminals in the stratum oriens of perfusion fixed tissue (Fig. 3). Both PV ⫹ and mGluR1␣ ⫹ dendrites were densely innervated by axon terminals, the majority of which formed asymmetrical (excitatory) synapses onto dendritic shafts (Fig. 3 A, B). These boutons mainly originate from CA3 PCs located either in the ipsilateral or contralateral hemisphere. 3D reconstructions (Fig. 3C) revealed no significant difference in the volume of the boutons innervating these IN types (PV: median: 0.20 m 3, IQR: 0.136 – 0.25 m 3, n ⫽ 67; mGluR1␣: median: 0.20 m 3, IQR: 0.125– 0.291 m 3, n ⫽ 87; p ⫽ 0.65, MW U test; Fig. 3D), demonstrating that distinct bouton volumes are not the main cause of the observed differences in peak [Ca 2⫹]. Because previous studies from our laboratory revealed that presynaptic Cav2.1 and
E´ltes, Kirizs et al. • Target Cell Type-Dependent Differences in Presynaptic Ca2⫹ Channel Function
1916 • J. Neurosci., February 15, 2017 • 37(7):1910 –1924
Table 1. Properties of 关Ca 2ⴙ兴 transients, bouton volumes, AZ areas and Cav immunoreactivities in PV ⴙ and mGluR1␣ⴙ dendrite-innervating axon terminals Dendrite-targeting boutons PV ⫹
Peak amplitude of 关Ca 2⫹兴 transient (300 M Fluo5F) (G/Gmax) Normalized peak amplitude of 关Ca 2⫹兴 transient (300 M Fluo5F)a Peak amplitude of 关Ca 2⫹兴 transient (100 M Fluo5F) (G/Gmax) Normalized peak amplitude of 关Ca 2⫹兴 transient (100 M Fluo5F)a Bouton volume in perfused tissue (m 3) Bouton volume in vitro slices (m 3) Total AZ area in perfused tissue (m 2) AZ area in vitro slices (m 2) Cav2.1 density in AZs (gold/m 2)b Cav2.2 density in AZs (gold/m 2)b Cav2.1 extrasynaptic density (gold/m 2)b Cav2.2 extrasynaptic density (gold/m 2)b Background Cav2.1 density (gold/m 2)b Background Cav2.2 density (gold/m 2)b Cav2.1 NND distance (nm) Cav2.2 NND distance (nm) Docked vesicle density (vesicle/m 2) Membrane proximal vesicle density (vesicle/m 2)
mGluR1␣⫹
Mean
SD
Median
n
No. of animals
Mean
SD
Median
n
No. of animals
0.14 1.20 0.21 1.33 0.20 0.31 0.06 0.10 373 151 2.14 2.69 2.27 0.66 24.7 32.1 33.1 64.9
0.05 0.41 0.10 0.51 0.10 0.12 0.03 0.04 47 30 2.46 3.15 1.93 0.33 4.0 7.2 21.1 42.0
0.13 1.12 0.22 1.36 0.20 0.26 0.06 0.09 370 139 2.21 2.35 2.94 0.62 23.3 30.3 35.5 59.1
26* 26* 14* 18* 67* 7 67* 7 112 52 93 48 132 104 43 21 47* 47*
15 15 9 12 3 5 3 5 5 4 5 4 5 4 5 4 3 3
0.11 1.00 0.17 1.04 0.25 0.20 0.09 0.09 321 130 2.88 1.02 2.27 0.66 24.3 32.0 21.9 47.3
0.04 0.28 0.11 0.25 0.18 0.12 0.05 0.03 46 39 2.64 1.26 1.93 0.33 4.6 8.3 17.5 26.6
0.11 0.98 0.14 1.03 0.20 0.18 0.08 0.09 325 130 2.23 0.75 2.94 0.62 23.1 28.7 22.2 49.9
61* 61* 21* 35* 87* 10 87* 10 172 114 174 113 132 104 72 40 49* 49*
23 23 13 18 3 4 3 4 5 4 5 4 5 4 5 4 3 3
Test
p
MW U test t test MW U test t test MW U test
0.012 0.024 0.100 0.037 0.650
MW U test
0.000
MW U test MW U test
0.010 0.037
*Used for the statistical comparisons. a 关Ca 2⫹兴 transients were normalized to the mean of all measured 关Ca 2⫹兴 transients of the given cell. b Values calculated from the medians of 5 (Cav2.1) and 4 (Cav2.2) rats.
Cav2.2 Ca 2⫹ channel subunits are confined to the AZ of hippocampal glutamatergic and GABAergic axon terminals (Holderith et al., 2012; Lenkey et al., 2015), we measured the total AZ areas in the 3D reconstructed boutons and found significantly smaller AZs in PV ⫹ dendrite-innervating boutons (PV: median: 0.06 m 2, IQR: 0.04 – 0.08 m 2, n ⫽ 67; mGluR1␣: median: 0.08 m 2, IQR: 0.05– 0.11 m 2, n ⫽ 87; p ⫽ 0.0001, MW U test; Fig. 3E). Finally, we calculated the total Ca 2⫹ that enters upon an AP by multiplying the peak [Ca 2⫹] with the medians of the volume of randomly selected and 3D reconstructed boutons. Assuming that this Ca 2⫹ enters through Ca 2⫹ channels located in the AZs, we normalized these data to the median AZ area. This way, we could calculate the total amount of Ca 2⫹ that enters the boutons through a unit AZ area (functional Ca 2⫹ channel density) in PV ⫹ and mGluR1␣ ⫹ dendrite-targeting boutons and found it to be 1.7 times larger in PV ⫹ dendrite-innervating boutons. To provide a more direct measure of the functional Ca 2⫹ channel density in these AZs, we randomly selected a subset of our in vitro two-photon imaged boutons with light microscopy immunofluorescent identification of their postsynaptic target cells (n ⫽ 12 PV ⫹ and n ⫽ 18 mGluR1␣ ⫹-targeting boutons from 9 PCs) and performed serial section EM of the imaged boutons (Fig. 4A–M ). This method provides a more accurate functional Ca 2⫹ channel density estimate, but it has the disadvantage of being so labor intensive that a smaller dataset was obtained. The peak amplitude of the [Ca 2⫹] transient in EMverified PV ⫹ dendrite-targeting boutons was 1.32 times larger compared with that recorded in mGluR1␣ ⫹ dendrite-targeting boutons (PV: 0.18 ⫾ 0.06 G/Gmax, median: 0.17 G/Gmax, n ⫽ 10; mGluR1␣: 0.13 ⫾ 0.03 G/Gmax, median: 0.13 G/Gmax, n ⫽ 13, p ⫽ 0.02, MW U test). We could measure the AZ area accurately in seven and 10 boutons targeting PV ⫹ and mGluR1␣ ⫹ dendrites, respectively. In this subset, the peak [Ca 2⫹] in PV ⫹ dendritetargeting boutons was 1.34 times larger compared with that in mGluR1␣ ⫹ dendrite-targeting ones (PV: 0.17 ⫾ 0.05 G/Gmax, median: 0.17 G/Gmax, n ⫽ 7; mGluR1␣: 0.13 ⫾ 0.02 G/Gmax,
median: 0.13 G/Gmax, n ⫽ 10, p ⫽ 0.045, MW U test), similar to the difference observed for the population data (cf. Figs. 2I, 4 N, O). EM analysis of these boutons revealed that they established synapses onto dendritic shafts that received many convergent asymmetrical synapses (implying that they were IN dendrites). None of these boutons had any ultrastructural sign of photodamage; they had only a single AZ and appeared qualitatively similar to those reconstructed from perfusion-fixed tissue. When the AZ area to bouton volume ratio was calculated for this subset of boutons (PV: 0.32 ⫾ 0.08 1/m, median: 0.31 1/m, n ⫽ 7; mGluR1␣: 0.47 ⫾ 0.13 1/m, median: 0.50 1/m, n ⫽ 10; p ⫽ 0.04, MW U test; Fig. 4P), a similar significant difference was observed compared with the larger population obtained from the perfusion-fixed tissue with better ultrastructural preservation (PV: 0.32 ⫾ 0.13 1/m, median: 0.29 1/m, n ⫽ 59; mGluR1␣: 0.42 ⫾ 0.18 1/m, median: 0.40 1/m, n ⫽ 79; p ⬍ 0.001, MW U test, single AZ boutons only). Finally, we calculated the total amount of Ca 2⫹ per AZ area for these imaged and EM analyzed boutons and obtained a 1.9 times larger value for the PV ⫹ dendrite-innervating axon terminals (PV: 0.54 ⫾ 0.12, median: 0.56, n ⫽ 7; mGluR1␣: 0.28 ⫾ 0.06, median: 0.27, n ⫽ 10; p ⫽ 0.002, MW U test; Fig. 4Q). These two combined functional– structural approaches indicated 1.7 and 1.9 times differences in the functional Ca 2⫹ channel density in the AZs of these two bouton populations, respectively. Finally, our EM analysis revealed a similar accuracy in predicting synaptic contacts with confocal microscopy between biocytin-filled axon terminals and PV ⫹ (10 of 12 boutons) or mGluR1␣ ⫹ (13 of 18 boutons) dendrites. Cav2.1 and Cav2.2 subunit densities in presynaptic AZs as determined with replica immunolabeling In the next set of experiments, we performed SDS-FRL to obtain an independent measure of presynaptic Ca 2⫹ channel densities. To compare the immunogold labeling for Ca 2⫹ channel subunits quantitatively in presynaptic AZs that synapse onto distinct IN types, the postsynaptic targets of the axon terminals need to be
E´ltes, Kirizs et al. • Target Cell Type-Dependent Differences in Presynaptic Ca2⫹ Channel Function
J. Neurosci., February 15, 2017 • 37(7):1910 –1924 • 1917
fractured surfaces (Figs. 5, 6). One replica was immunoreacted to identify IN dendrites; its mirror surface was labeled for a Ca 2⫹ channel subunit and all subcellular structures (dendrites, AZs) were identified in both replicas. Metabotropic GluR1␣ is a transmembrane protein that is expressed in the somatodendritic plasma membrane of hippocampal INs and specific antibodies are available that can be used for replica labeling (Mansouri et al., 2015). PV is a cytoplasmic protein that cannot be detected with SDS-FRL, so we identified somatodendritic regions of PV ⫹ INs based on the presence of immunogold labeling for the Kv3.1b voltagegated K ⫹ channel subunit (Du et al., 1996). Both mGluR1␣ and Kv3.1b antibodies recognize intracellular epitopes and thus label the P-face of dendritic plasma membranes (Figs. 5, 6). Many membrane segments are attached to these IN dendrites that represent the E-face of presynaptic axon terminals. Because our antibodies against Ca 2⫹ channel subunits recognize intracellular epitopes (label on the P-face), they cannot be used to localize these channels in these attached axonal E-face membranes. The P-faces of these dendrite-attached presynaptic membranes are present in the mirror replicas (Figs. 5, 6). Because the release of glutamate from these axon terminals are mainly mediated by P/Q- and N-type Ca 2⫹ channels (see above), we localized both Cav2.1 and Cav2.2 subunits. The dendrite-attached P-face membrane segments were often labeled for the Cav2.1 subunit and the gold particles were concentrated over areas that had an elevated density of intramembrane particles, corresponding to the AZs (Fig. 5A–N ). The normalized density of gold particles within the AZs was significantly larger than that found in the surrounding E-face plasma membranes (defined as background), whereas the Cav2.1 subunit density in extrasynaptic bouton membranes was similar to that of ⫹ ⫹ ⫹ the background (Fig. 5O). We performed Figure 3. 3D reconstructions of PC axon terminals targeting PV or mGluR1␣ dendrites. A, B, Electron micrograph of a PV (orange, A) and an mGluR1␣ ⫹ (cyan, B) dendrite (labeled with preembedding peroxidase reaction, dark precipitate) receiving these experiments in five animals and anseveral excitatory inputs from presynaptic boutons (b). Arrowheads indicate the postsynaptic densities. C, Representative dendritic alyzed a total of 112 and 172 AZs attached ⫹ ⫹ segments are reconstructed in 3D. Boutons are white and postsynaptic dendrites are orange (PV ⫹) or cyan (mGluR1␣ ⫹). to Kv3.1b and mGluR1␣ dendrites, reD, E, Bouton volume is not ( p ⫽ 0.65 MW U test, D), but the total active zone area is significantly ( p ⫽ 0.0001 MW U test, E) spectively, in the stratum oriens of the different between PV ⫹ and mGluR1␣ ⫹ dendrite-targeting terminals. Circles indicate individual boutons, boxes indicate IQRs, CA3 area. Quantitative comparison of the and horizontal bars indicate medians. two AZ populations revealed an overall 1.15 times higher density in Kv3.1b ⫹ identified. This requires the use of the so-called face-matched dendrite-targeting AZs (Fig. 5O; for non-normalized gold densimirror replica technique (Hagiwara et al., 2005) and the molecties, see Table 1) ular identification of the target IN types because the type of IN Next, we conducted the same investigation for the other major from small fractured membrane segments cannot be determined Ca 2⫹ channel subunit (Cav2.2; Fig. 6). Presynaptic P-face plasma membranes attached to Kv3.1b ⫹ (n ⫽ 52) or mGluR1␣ ⫹ (n ⫽ based on morphological features. After rapid freezing under high 114) dendrites were also heavily labeled for the Cav2.2 subunit pressure, we randomly fractured tissue sections from the CA3 (Fig. 6A–I ). Gold particles were confined to the AZs, where their area and created carbon–platinum– carbon replicas of both
1918 • J. Neurosci., February 15, 2017 • 37(7):1910 –1924
E´ltes, Kirizs et al. • Target Cell Type-Dependent Differences in Presynaptic Ca2⫹ Channel Function
Figure 4. Combined functional and morphological analyses of individual boutons show differences in the amount of Ca 2⫹ in PC axon terminals innervating PV ⫹ or mGluR1␣ ⫹ INs. A, Neurolucida reconstruction of a CA3 PC filled with 20 M Alexa Fluor 594, 300 M Fluo5F, and biocytin. B, Low-magnification 2P microscopic image stack of the basal dendritic tree and the axonal arbor of the cell. C, Low-magnification confocal image stack of the same cell. Boxed areas in A–C indicate the axon collaterals where 21 boutons were imaged. D–I, High-magnification views of the two imaged axon collaterals (2P images: D and G; corresponding confocal images: E and H; corresponding transmission light microscopy images: F and I). Inset in E shows the same axonal arbor at a lower magnification. Arrows indicate those boutons that contacted either mGluR1␣ (#1, #2, and #4) or PV (#3) immunopositive dendrites. J, Immunofluorescent labeling for mGluR1␣ (cyan), PV (orange), and biocytin (white) of the imaged area. Arrows point to boutons that form putative synapses on the labeled dendrites. K, Correlated electron micrographs of the boutons shown in J. Arrowheads indicate the edges of the morphologically identified postsynaptic densities. L, 3D reconstructions of the boutons shown in J and K. Light blue indicates the active zone; dark gray indicates mitochondria. M, Individual [Ca 2⫹] transients (average of two scans) recorded in the same boutons. N, O, Calcium transients in boutons with EM reconstructed AZs (N: individual transients: semitransparent, mean: bold; PV: orange, n ⫽ 7, mGluR1␣: cyan, n ⫽ 10). The peak amplitude of the [Ca 2⫹] transients is 1.3 times larger in PV-targeting (orange) compared with mGluR1␣-targeting (cyan) boutons ( p ⫽ 0.045 MW U test, black circles correspond to data points obtained from the cell shown in A–M). Gray symbols indicate average [Ca 2⫹] transients of the two bouton populations that were verified with confocal microscopy only (data from Fig. 2I). P, Active zone area normalized to the bouton volume was significantly ( p ⫽ 0.04 MW U test) larger in mGluR1␣ ⫹ (n ⫽ 10) than in PV ⫹ (n ⫽ 7) dendrite-targeting boutons similar to the population averages (gray symbols, p ⬍ 0.0001 MW U test). Q, Calculated total Ca 2⫹ per AZ area is twice as large in PV ⫹ (n ⫽ 7) as in mGluR1␣ ⫹ (n ⫽ 10) dendrite-targeting boutons ( p ⫽ 0.002, MW U test). Data are presented as mean ⫾ SD.
densities were significantly higher than the background (Fig. 6J ). Cav2.2 subunit densities also showed a 1.20-fold higher values in Kv3.1b ⫹ compared with mGluR1␣ ⫹ dendrite-targeting AZs, but the difference did not reach significance (Fig. 6J; for nonnormalized gold densities, see Table 1). Finally, we investigated whether the sub-AZ distribution of the gold particles labeling the Cav subunits is compatible with a random process. To test this, we computed two measures, the nearest neighbor distance (NND) and a 2D spatial autocorrelation function (ACF) (see Materials and Methods) and compared the real anti-Cav2.1 immunogold distribution data in 43 Kv3.1b ⫹ and 72 mGluR1␣ ⫹ dendrite-targeting AZs (fractured in their completeness) with those of random gold distributions. Both NND and ACF analysis
revealed that the actual data were significantly different from random distributions (Fig. 5 P, R). A similar result was obtained for the Cav2.2 subunit in 21 (Kv3.1b) and 40 (mGluR1␣) AZs (Fig. 6 K, L). The significantly lower mean NNDs in both Kv3.1b ⫹ and mGluR1␣ ⫹ dendrite-innervating AZs demonstrate spatial inhomogeneities of gold particles. Difference in docked vesicle density in PV ⴙ and mGluR1␣ⴙ dendrite-innervating boutons It is not just the Ca 2⫹ channel density that influences the distance between the presynaptic Ca 2⫹ channels and the Ca 2⫹ sensors on the synaptic vesicles; the density of vesicles docked at the AZ is also a key parameter. The best currently known method to ana-
E´ltes, Kirizs et al. • Target Cell Type-Dependent Differences in Presynaptic Ca2⫹ Channel Function
J. Neurosci., February 15, 2017 • 37(7):1910 –1924 • 1919
Figure 5. The density of Cav2.1 subunits is 1.15 times larger in the AZs of Kv3.1b ⫹ compared with mGluR1␣ ⫹ dendrite-targeting boutons. A, B, Corresponding EM protoplasmic-face (PF) and exoplasmic-face (EF) images of a Kv3.1b ⫹ (expressed in PV ⫹ cells) cells receiving several excitatory inputs (orange in B). C, D, Higher-magnification images of the boxed areas in A and B show a perisomatic EF membrane with attached PF fragments of axon terminals (bPF) containing AZs (orange in D). Active zones are indicated by the loose cluster of intramembrane particles. E, Higher-magnification view of the boxed areas in D. F–H, Another example of an intensely Cav2.1 labeled AZ attached to a Kv3.1b ⫹ dendrite. I, J, PF and EF images of an mGluR1␣-immunoreactive dendrite contacted by axon terminals with AZs (cyan in J). K, Higher-magnification image of the boxed area in J. L–N, Another mGluR1␣ ⫹ dendrite-attached AZ with intense Cav2.1 labeling. O, Normalized densities of gold particles labeling the Cav2.1 subunit within presynaptic AZ (syn.), extrasynaptic bouton membranes (extrasyn.), and surrounding EF membranes (background: bg., gray) obtained from five rats. Post hoc MW U tests with Bonferroni correction after Kruskal–Wallis test ( p ⬍ 0.0001) demonstrated a significant difference between the synaptic and background labeling ( p ⬍ 0.0001) and between the synaptic compartments of Kv3.1b ⫹ and mGluR1␣ ⫹ dendrite-targeting boutons ( p ⬍ 0.001). Circles indicate individual (Figure legend continues.)
1920 • J. Neurosci., February 15, 2017 • 37(7):1910 –1924
lyze the distribution of synaptic vesicles around the AZ at high resolution is EM tomography (Siksou et al., 2007; Imig et al., 2014). We therefore performed EM tomography on 200-nmthick, resin-embedded, perfusion-fixed tissue immunoreacted for PV or mGluR1␣ (Fig. 7) and estimated the densities of vesicles associated with these two AZ populations. Examining the tomographic subvolumes at a resolution of 0.6 nm allowed the selection of the Z-directional planes where each vesicle is closest to the presynaptic AZ membrane from which the measurements were performed. We defined a vesicle as docked if it contacted the AZ membrane directly (Fig. 7 B, E) or as predocked if the vesicle to AZ membrane distance was ⬍5 nm (Fig. 7C,F ). Quantitative comparisons revealed a 1.5 and 1.4 times higher density, respectively, of docked (Fig. 7G) and membraneproximal (docked and predocked vesicles pooled together; Fig. 7H, Table 1) vesicles in AZs contacting PV ⫹ INs compared with mGluR1␣ ⫹ INs.
Discussion Here, we performed two series of experiments to estimate the densities of Ca 2⫹ channels in presynaptic AZs of CA3 PCs contacting two distinct types of IN. First, we performed a combined functional and morphological investigation to estimate what we call functional Ca 2⫹ channel density and found an almost twofold higher density in the AZs innervating PV ⫹ compared with mGluR1␣ ⫹ INs. This is the consequence of a larger presynaptic [Ca 2⫹] transient, a smaller AZ area, and a similar volume of boutons innervating PV ⫹ INs. We also determined the densities of immunogold particles labeling the Cav2.1 and Cav2.2 Ca 2⫹ channel subunits using SDS-FRL and found that PV ⫹ dendriteinnervating terminals exhibited only a 1.15 times higher Ca 2⫹ channel subunit density. Finally, a 1.5 times higher density of docked vesicles in PV ⫹ dendrite-innervating AZs was revealed by EM tomography. Target cell type-dependent differential modulation of Ca 2ⴙ channel function Our Ca 2⫹ imaging experiments are consistent with the results of Koester and Johnston (2005), who performed simultaneous paired whole-cell recordings and imaged [Ca 2⫹] transients in presynaptic boutons mediating either facilitating or depressing EPSPs in the neocortex. They also observed a larger presynaptic [Ca 2⫹] transient in depressing PC to multipolar cell synapses compared with those mediating facilitating EPSPs in bitufted cells. However, the difference in the recorded cortical boutons was more robust than that found in our present study in CA3 PCs. Koester and Johnston (2005) did not provide ultrastructural information regarding the bouton volume or AZ size, so the basis for the difference in [Ca 2⫹] between the depressing and facilitating synapses could not be determined. Our data thus extend the current knowledge by demonstrating that the larger [Ca 2⫹] in 4 (Figure legend continued.) measurements of AZs, boxes indicate IQRs, and horizontal bars indicate medians. P, NND was calculated for each gold particle within an AZ and the mean value (NND) is plotted against the NND of randomly placed gold particles (repeated 1000 times) for each AZ contacting Kv3.1b ⫹ (n ⫽ 43) or mGluR1␣ ⫹ (n ⫽ 72) dendrites. Wilcoxon signedrank test revealed a significant difference ( p ⬍ 0.0001) between the data and the random distributions for both AZ populations. R, Comparison of the mean two dimensional spatial autocorrelation functions (g共r兲) measured in individual Kv3.1b ⫹ (n ⫽ 43) or mGluR1␣ ⫹ (n ⫽ 72) dendrite-targeting AZs to their simulated random controls (repeated 1000 times). Wilcoxon signed-rank test revealed significant differences ( p ⬍ 0.0001) between the data and the random distributions for both AZ populations.
E´ltes, Kirizs et al. • Target Cell Type-Dependent Differences in Presynaptic Ca2⫹ Channel Function
high Pr, FS PV ⫹ IN-innervating boutons is not the consequence of a smaller bouton volume, but rather is caused by a larger amount of Ca 2⫹ entering the bouton upon an AP. By determining the size of the AZs (where Ca 2⫹ channels are concentrated), we can predict the [Ca 2⫹] in the vicinity of the release sites. Assuming similar Ca 2⫹ channel properties in different Pr boutons, our data predict a 1.7–1.9 times higher density of Ca 2⫹ channels in high Pr AZs. However, quantitative evaluation of several hundreds of AZs with SDS-FRL for both Cav2.1 (P/Q) and Cav2.2 (N-type) Ca 2⫹ channel subunits in AZs that remained physically attached to Kv3.1b ⫹ (PV ⫹) or mGluR1␣ ⫹ somatodendritic membranes revealed only an ⬃15% higher Cav subunit density in the Kv3.1b ⫹ dendrite-innervating AZs. A potential explanation for the discrepancy between our functional channel density and SDS-FRL Cav subunit density estimates is a preferential enrichment of Cav2.3 (R-type)/Cav1 (L-type)/Cav3 (T-type) subunits in PV ⫹ dendrite-innervating boutons (Parajuli et al., 2012; Carbone et al., 2014). However, our experiments with 1 M -CTX MVIIC (a concentration that almost fully block the evoked EPSCs in both IN types) revealed an almost identical block of [Ca 2⫹] transients in boutons targeting these distinct IN types, arguing against differential contribution of R-, T-, and L-type Ca 2⫹ channels to the [Ca 2⫹] transients. Another possible explanation for this discrepancy is a differential fixed Ca 2⫹ buffer concentration in these two bouton populations. However, the similar decay of the [Ca 2⫹] transients (recorded with either 300 or 100 M Fluo5F) in these bouton populations argues against this possibility. We suggest that differential target cell type-dependent regulation of Ca 2⫹ channel function is the most likely mechanism underlying the differences. There are a number of ways to regulate Ca 2⫹ channel function. Association with different  subunits promotes different voltage-dependent activation and inactivation (for review, see Buraei and Yang, 2010). Interactions with SNARE proteins such as syntaxin and SNAP25 at the so-called “synprint” motif reduce the channel open probability, whereas additional coexpression of synaptotagmin reverses this effect (Zhong et al., 1999). This suggests a regulatory switch by which presynaptic Ca 2⫹ channels bound to Ca 2⫹ sensors are functionally enabled, whereas Ca 2⫹ channels decoupled from Ca 2⫹ sensors are disabled (Eggermann et al., 2011). The AZ protein Munc13, which is involved in vesicle priming processes, has also been found to alter Ca 2⫹ inflow by modulating the kinetic properties of Ca 2⫹ channels without changing their density (Calloway et al., 2015). Probably the most widely studied modulation of Ca 2⫹ channel function is its regulation by presynaptic G-protein-coupled receptors (e.g., mGluRs, A1 adenosine- ␣2 noradrenergic, GABAB, or endocannabinoid receptors; Bean, 1989; Dittman and Regehr, 1996; Takahashi et al., 1996; Lea˜o and Von Gersdorff, 2002; Brown et al., 2004; Szabo´ et al., 2014; Kupferschmidt and Lovinger, 2015). P/Q- and N-type Ca 2⫹ channel function is reduced via direct binding of G-protein /␥-subunits to Ca 2⫹ channel  subunits. In a recent study, Anderson et al. (2015) demonstrated that presynaptic  neurexins can reduce tonic endocannabinoid production transsynaptically and increase the Pr of CA1 PC axons by alleviating presynaptic [Ca 2⫹] from CB1-mediated inhibition. Another way of modulating Ca 2⫹ channel function is phosphorylation: CDK5 (kinase)/calcineurin (phosphatase) equilibrium has been shown to set the phosphorylation state of the ␣1 subunit of N-type Ca 2⫹ channels, which influences the voltage dependence of the open probability of the channel (Su et al., 2012; Kim and Ryan, 2013). Whatever the mechanisms are, they must be
E´ltes, Kirizs et al. • Target Cell Type-Dependent Differences in Presynaptic Ca2⫹ Channel Function
J. Neurosci., February 15, 2017 • 37(7):1910 –1924 • 1921
Figure 6. The densities of Cav2.2 subunit in AZs of PC boutons targeting Kv3.1b ⫹ and mGluR1␣ ⫹ dendrites. A, B, A Kv3.1b ⫹ dendrite (dendritePF in A) is contacted by boutons with PF (bPF) membranes that show strong Cav2.2 subunit reactivity in their AZs (orange in B). C, D, High-magnification images of the boxed areas shown in A and B. E, F, PF bouton membranes contacting an mGluR1␣ ⫹ dendrite (dendritePF in E) contain Cav2.2 subunit immunolabeled AZs (cyan in F). G–I, Enlarged views of the boxed areas in E and F. J, Normalized densities of gold particles labeling the Cav2.2 subunit within presynaptic AZs (syn.) and extrasynaptic membranes (extrasyn.) of boutons contacting Kv3.1b ⫹ or mGluR1␣ ⫹ profiles and in surrounding EF membranes (background: bg., gray). Post hoc MW U tests with Bonferroni correction after Kruskal–Wallis test ( p ⬍ 0.0001) demonstrated a significant difference between the synaptic and background labeling ( p ⬍ 0.0001). Circles indicate individual measurements of AZs, boxes indicate IQRs, and horizontal bars indicate medians. K, Comparison of NND’s measured in 21 Kv3.1b ⫹ and 40 mGluR1␣ ⫹ dendrite-contacting AZs to their random controls (repeated 1000 times). Wilcoxon signed-rank test revealed significant difference ( p ⬍ 0.0001) between the data and the random distributions for both AZ populations. L, g 共 r兲 of individual Kv3.1b ⫹ (n ⫽ 21) or mGluR1␣ ⫹ (n ⫽ 40) dendrite-targeting AZs is plotted against the g 共 r兲 of their random controls (repeated 1000 times). Wilcoxon signed-rank test revealed significant differences ( p ⬍ 0.0001) between the data and the random distributions for both AZ populations.
able to modulate the function of presynaptic Ca 2⫹ channels in a postsynaptic target cell type-dependent manner. The amount of Ca 2⫹ entering through presynaptic voltagegated Ca 2⫹ channels is very sensitive to the shape/waveform of
the AP (Geiger and Jonas, 2000), so a postsynaptic target cell type-dependent difference in the AP waveform could also explain our results. It remains to be seen whether the AP waveform in boutons (Rowan et al., 2014) that are segregated by only a few
1922 • J. Neurosci., February 15, 2017 • 37(7):1910 –1924
E´ltes, Kirizs et al. • Target Cell Type-Dependent Differences in Presynaptic Ca2⫹ Channel Function
Figure 7. EM tomography of the AZs of PC axon terminals synapsing onto PV ⫹ or mGluR1␣ ⫹ dendrites. A, D, Electron tomographic subvolumes (0.6 nm thick) of representative boutons (b) establishing asymmetric synaptic contacts (arrowheads demarcate the edges of the synapses) on a PV ⫹ (orange, A) and a mGluR1␣ ⫹ (cyan, D) dendrite (labeled with preembedding peroxidase reaction). B, C and E, F, Higher-magnification views show docked (B and E, area boxed on A and D, respectively) and predocked vesicles (C, F). G, H, Docked (G, p ⫽ 0.01, MW U test) and membrane proximal (H, p ⫽ 0.037, MW U test, docked ⫹ predocked vesicles) vesicles have significantly different densities (PV ⫹: n ⫽ 47; mGluR1␣ ⫹: n ⫽ 49 subvolumes) in the two AZ populations. Circles indicate individual AZ subvolumes, boxes indicate IQRs, and horizontal bars indicate medians.
micrometers along the same axon could be sufficiently different to account for the ⬃30% difference in the [Ca 2⫹] transient observed in our experiments. The larger amount of Ca 2⫹, together with a higher docked vesicle density in high Pr boutons, indicates a higher [Ca 2⫹] at the Ca 2⫹ sensors. Rozov et al. (2001) tested the transmission between cortical PCs and two distinct IN types (multipolar and bitufted) with fast and slow Ca 2⫹ buffers. The more robust effect of EGTA (slow buffer) on neurotransmitter release from PC to bitufted compared with multipolar cells predicted a larger physical distance between the Ca 2⫹ channels and Ca 2⫹ sensors (larger coupling distance) in the low Pr synapse. Our functional Ca 2⫹ channel density estimate is consistent with this prediction and supports the hypothesis that the mechanisms underlying the low initial Pr and the subsequent short-term facilitation is a large Ca 2⫹ channel to Ca 2⫹ sensor distance (Neher, 1998; Atwood and Karunanithi, 2002; Eggermann et al., 2011). Another level of complexity might arise from the potential target cell type-dependent differences in the sub-AZ distribution of Ca 2⫹ channels (Holderith et al., 2012; Nakamura et al., 2015). Our NND and ACF analysis revealed that Cav2.1 and Cav2.2 subunits show within-AZ distributions that are significantly different from random distributions. However, the fact that the distribution of gold particles in both AZ populations differ from random does not mean that the sub-AZ distribution of Cav channels is identical in both AZ populations. Target cell type-dependent molecular differences in presynaptic axon terminals So far, the only known protein with a dramatic difference in its density between low- and high-Pr synapses of a single PC axon is mGluR7 (Shigemoto et al., 1996), making it an ideal candidate through which a low initial Pr and a consequent short-term facil-
itation could be achieved. The pharmacological blockade of group III mGluRs (including mGluR7) increases the amplitude of evoked EPSCs, but does not change the facilitating phenotype of EPSCs recorded from CA1 mGluR1␣ ⫹ INs (Losonczy et al., 2003), suggesting a tonic, mGluR-mediated reduction of transmitter release from these axon terminals. Similarly, knocking down Elfn1 from somatostatin-positive INs also led to an increase in the amplitude of the first EPSC of a train and a reduction in the degree of short-term facilitation, consistent with the results of pharmacological block of mGluR7. Indeed, it has been shown recently that the postsynaptically located Elfn1 has a key role in the selective recruitment of mGluR7 to the presynaptic AZs of PC axons that contact somatostatin/mGluR1␣ ⫹ INs (Tomioka et al., 2014). However, the short-term plasticity of the mGluR1␣ ⫹ dendrite-targeting boutons in mGluR7 antagonist or after Elfn1 knock-down is still facilitating, very different from that observed in PV ⫹ IN-targeting boutons, suggesting that other mechanisms must be involved. These might include the regulation of Ca 2⫹ channel function mentioned above or the selective presence of molecules that might impose facilitation on synapses (e.g., NMDA receptors, Buchanan et al., 2012; kainate receptors, Sylwestrak and Ghosh, 2012; or synaptotagmin-7, Jackman et al., 2016). Additional factors could contribute to differences in initial Pr by changing the sensitivity of the release machinery to [Ca 2⫹]. Proteins such as Rab3A-D and Munc13–3 increase Pr (Schlu¨ter et al., 2004; Schlu¨ter et al., 2006; Ishiyama et al., 2014), whereas others such as mover decrease Pr (Ko¨rber et al., 2015) without affecting the readily releasable pool. Unc13 isoforms have been implicated in the preferential targeting of vesicles to docking sites that are formed at varying distances from the Ca 2⫹ channels (Bo¨hme et al., 2016). Any of these mechanisms may also contribute to the differences in initial Pr in addition to the above described differences in [Ca 2⫹].
E´ltes, Kirizs et al. • Target Cell Type-Dependent Differences in Presynaptic Ca2⫹ Channel Function
References Ali AB, Thomson AM (1998) Facilitating pyramid to horizontal oriensalveus interneurone inputs: dual intracellular recordings in slices of rat hippocampus. J Physiol 507:185–199. CrossRef Medline Ali AB, Deuchars J, Pawelzik H, Thomson AM (1998) CA1 pyramidal to basket and bistratified cell EPSPs: dual intracellular recordings in rat hippocampal slices. J Physiol 507:201–217. CrossRef Medline Anderson GR, Aoto J, Tabuchi K, Fo¨ldy C, Covy J, Yee AX, Wu D, Lee SJ, Chen L, Malenka RC, Su¨dhof TC (2015) Beta-neurexins control neural circuits by regulating synaptic endocannabinoid signaling. Cell 162:593– 606. CrossRef Medline Atwood HL, Karunanithi S (2002) Diversification of synaptic strength: presynaptic elements. Nat Rev Neurosci 3:497–516. Medline Bean BP (1989) Neurotransmitter inhibition of neuronal calcium currents by changes in channel voltage dependence. Nature 340:153–156. CrossRef Medline Biro´ AA, Holderith NB, Nusser Z (2005) Quantal size is independent of the release probability at hippocampal excitatory synapses. J Neurosci 25: 223–232. CrossRef Medline Bo¨hme MA, Beis C, Reddy-Alla S, Reynolds E, Mampell MM, Grasskamp AT, Lu¨tzkendorf J, Bergeron DD, Driller JH, Babikir H, Go¨ttfert F, Robinson IM, O’Kane CJ, Hell SW, Wahl MC, Stelzl U, Loll B, Walter AM, Sigrist SJ (2016) Active zone scaffolds differentially accumulate Unc13 isoforms to tune Ca 2⫹ channel-vesicle coupling. Nat Neurosci 19:1311–1320. CrossRef Medline Brown SP, Safo PK, Regehr WG (2004) Endocannabinoids inhibit transmission at granule cell to Purkinje cell synapses by modulating three types of presynaptic calcium channels. J Neurosci 24:5623–5631. CrossRef Medline Buchanan KA, Blackman AV, Moreau AW, Elgar D, Costa RP, Lalanne T, Tudor Jones AA, Oyrer J, Sjo¨stro¨m PJ (2012) Target-specific expression of presynaptic NMDA receptors in neocortical microcircuits. Neuron 75:451– 466. CrossRef Medline Buraei Z, Yang J (2010) The  subunit of voltage-gated Ca 2⫹ channels. Physiol Rev 90:1461–1506. CrossRef Medline Calloway N, Gouzer G, Xue M, Ryan TA (2015) The active-zone protein Munc13 controls the use dependence of presynaptic voltage-gated calcium channels. eLife 4. Carbone E, Calorio C, Vandael DH (2014) T-type channel-mediated neurotransmitter release. Pflugers Arch 466:677– 687. CrossRef Medline Dittman JS, Regehr WG (1996) Contributions of calcium-dependent and calcium-independent mechanisms to presynaptic inhibition at a cerebellar synapse. J Neurosci 16:1623–1633. Medline Du J, Zhang L, Weiser M, Rudy B, McBain CJ (1996) Developmental expression and functional characterization of the potassium-channel subunit Kv3.1b in parvalbumin-containing interneurons in the rat hippocampus. J Neurosci 16:506 –518. Medline Eggermann E, Bucurenciu I, Goswami SP, Jonas P (2011) Nanodomain coupling between Ca(2⫹) channels and sensors of exocytosis at fast mammalian synapses. Nat Rev Neurosci 13:7–21. CrossRef Medline Ferraguti F, Cobden P, Pollard M, Cope D, Shigemoto R, Watanabe M, Somogyi P (2004) Immunolocalization of metabotropic glutamate receptor 1␣ (mGluR1␣) in distinct classes of interneuron in the CA1 region of the rat hippocampus. Hippocampus 14:193–215. CrossRef Medline Geiger JR, Jonas P (2000) Dynamic control of presynaptic Ca 2⫹ inflow by fast-inactivating K ⫹ channels in hippocampal mossy fiber boutons. Neuron 28:927–939. CrossRef Medline Hagiwara A, Fukazawa Y, Deguchi-Tawarada M, Ohtsuka T, Shigemoto R (2005) Differential distribution of release-related proteins in the hippocampal CA3 area as revealed by freeze-fracture replica labeling. J Comp Neurol 489:195–216. CrossRef Medline Holderith N, Lorincz A, Katona G, Ro´zsa B, Kulik A, Watanabe M, Nusser Z (2012) Release probability of hippocampal glutamatergic terminals scales with the size of the active zone. Nat Neurosci 15:988 –997. CrossRef Medline Imig C, Min SW, Krinner S, Arancillo M, Rosenmund C, Su¨dhof TC, Rhee J, Brose N, Cooper BH (2014) The morphological and molecular nature of synaptic vesicle priming at presynaptic active zones. Neuron 84:416 – 431. CrossRef Medline Ishiyama S, Schmidt H, Cooper BH, Brose N, Eilers J (2014) Munc13–3 superprimes synaptic vesicles at granule cell-to-basket cell synapses in the mouse cerebellum. J Neurosci 34:14687–14696. CrossRef Medline
J. Neurosci., February 15, 2017 • 37(7):1910 –1924 • 1923 Jackman SL, Turecek J, Belinsky JE, Regehr WG (2016) The calcium sensor synaptotagmin 7 is required for synaptic facilitation. Nature 529:88 –91. CrossRef Medline Kerti K, Lorincz A, Nusser Z (2012) Unique somatodendritic distribution pattern of Kv4.2 channels on hippocampal CA1 pyramidal cells. Eur J Neurosci 35:66 –75. CrossRef Medline Kim SH, Ryan TA (2013) Balance of calcineurin Aalpha and CDK5 activities sets release probability at nerve terminals. J Neurosci 33:8937– 8950. CrossRef Medline Koester HJ, Johnston D (2005) Target cell-dependent normalization of transmitter release at neocortical synapses. Science 308:863– 866. CrossRef Medline Ko¨rber C, Horstmann H, Venkataramani V, Herrmannsdo¨rfer F, Kremer T, Kaiser M, Schwenger DB, Ahmed S, Dean C, Dresbach T, Kuner T (2015) Modulation of presynaptic release probability by the vertebrate-specific protein mover. Neuron 87:521–533. CrossRef Medline Kremer JR, Mastronarde DN, McIntosh JR (1996) Computer visualization of three-dimensional image data using IMOD. J Struct Biol 116:71–76. CrossRef Medline Kupferschmidt DA, Lovinger DM (2015) Inhibition of presynaptic calcium transients in cortical inputs to the dorsolateral striatum by metabotropic GABAB and mGlu2/3 receptors. J Physiol 593:2295–2310. CrossRef Medline Lea˜o RM, Von Gersdorff H (2002) Noradrenaline increases high-frequency firing at the calyx of Held synapse during development by inhibiting glutamate release. J Neurophysiol 87:2297–2306. Medline Lenkey N, Kirizs T, Holderith N, Ma´te´ Z, Szabo´ G, Vizi ES, **Ha´jos N, Nusser Z (2015) Tonic endocannabinoid-mediated modulation of GABA release is independent of the CB1 content of axon terminals. Nat Commun 6:6557. CrossRef Medline Losonczy A, Zhang L, Shigemoto R, Somogyi P, Nusser Z (2002) Cell type dependence and variability in the short-term plasticity of EPSCs in identified mouse hippocampal interneurones. J Physiol 542:193–210. CrossRef Medline Losonczy A, Somogyi P, Nusser Z (2003) Reduction of excitatory postsynaptic responses by persistently active metabotropic glutamate receptors in the hippocampus. J Neurophysiol 89:1910 –1919. Medline Mansouri M, Kasugai Y, Fukazawa Y, Bertaso F, Raynaud F, Perroy J, Fagni L, Kaufmann WA, Watanabe M, Shigemoto R, Ferraguti F (2015) Distinct subsynaptic localization of type 1 metabotropic glutamate receptors at glutamatergic and GABAergic synapses in the rodent cerebellar cortex. Eur J Neurosci 41:157–167. CrossRef Medline Markram H, Wang Y, Tsodyks M (1998a) Differential signaling via the same axon of neocortical pyramidal neurons. Proc Natl Acad Sci U S A 95: 5323–5328. CrossRef Medline Markram H, Gupta A, Uziel A, Wang Y, Tsodyks M (1998b) Information processing with frequency-dependent synaptic connections. Neurobiol Learn Mem 70:101–112. CrossRef Medline Mercer A, Eastlake K, Trigg HL, Thomson AM (2012) Local circuitry involving parvalbumin-positive basket cells in the CA2 region of the hippocampus. Hippocampus 22:43–56. CrossRef Medline Nakamura Y, Harada H, Kamasawa N, Matsui K, Rothman JS, Shigemoto R, Silver RA, DiGregorio DA, Takahashi T (2015) Nanoscale distribution of presynaptic Ca 2⫹ channels and its impact on vesicular release during development. Neuron 85:145–158. CrossRef Medline Neher E (1998) Vesicle pools and Ca 2⫹ microdomains: new tools for understanding their roles in neurotransmitter release. Neuron 20:389 –399. CrossRef Medline Parajuli LK, Nakajima C, Kulik A, Matsui K, Schneider T, Shigemoto R, Fukazawa Y (2012) Quantitative regional and ultrastructural localization of the Cav2.3 subunit of R-type calcium channel in mouse brain. J Neurosci 32:13555–13567. CrossRef Medline Pouille F, Scanziani M (2004) Routing of spike series by dynamic circuits in the hippocampus. Nature 429:717–723. CrossRef Medline Reyes A, Lujan R, Rozov A, Burnashev N, Somogyi P, Sakmann B (1998) Target-cell-specific facilitation and depression in neocortical circuits. Nat Neurosci 1:279 –285. CrossRef Medline Rowan MJ, Tranquil E, Christie JM (2014) Distinct Kv channel subtypes contribute to differences in spike signaling properties in the axon initial segment and presynaptic boutons of cerebellar interneurons. J Neurosci 34:6611– 6623. CrossRef Medline Rozov A, Burnashev N, Sakmann B, Neher E (2001) Transmitter release
1924 • J. Neurosci., February 15, 2017 • 37(7):1910 –1924 modulation by intracellular Ca2⫹ buffers in facilitating and depressing nerve terminals of pyramidal cells in layer 2/3 of the rat neocortex indicates a target cell-specific difference in presynaptic calcium dynamics. J Physiol 531:807– 826. CrossRef Medline Scanziani M, Ga¨hwiler BH, Charpak S (1998) Target cell-specific modulation of transmitter release at terminals from a single axon. Proc Natl Acad Sci U S A 95:12004 –12009. CrossRef Medline Schlu¨ter OM, Schmitz F, Jahn R, Rosenmund C, Su¨dhof TC (2004) A complete genetic analysis of neuronal Rab3 function. J Neurosci 24:6629 – 6637. CrossRef Medline Schlu¨ter OM, Basu J, Su¨dhof TC, Rosenmund C (2006) Rab3 superprimes synaptic vesicles for release: implications for short-term synaptic plasticity. J Neurosci 26:1239 –1246. CrossRef Medline Shigemoto R, Kulik A, Roberts JD, Ohishi H, Nusser Z, Kaneko T, Somogyi P (1996) Target-cell-specific concentration of a metabotropic glutamate receptor in the presynaptic active zone. Nature 381:523–525. CrossRef Medline Siksou L, Rostaing P, Lechaire JP, Boudier T, Ohtsuka T, Fejtova´ A, Kao HT, Greengard P, Gundelfinger ED, Triller A, Marty S (2007) Threedimensional architecture of presynaptic terminal cytomatrix. J Neurosci 27:6868 – 6877. CrossRef Medline Su SC, Seo J, Pan JQ, Samuels BA, Rudenko A, Ericsson M, Neve RL, Yue DT, Tsai LH (2012) Regulation of N-type voltage-gated calcium channels and presynaptic function by cyclin-dependent kinase 5. Neuron 75:675– 687. CrossRef Medline
E´ltes, Kirizs et al. • Target Cell Type-Dependent Differences in Presynaptic Ca2⫹ Channel Function Sylwestrak EL, Ghosh A (2012) Elfn1 regulates target-specific release probability at CA1-interneuron synapses. Science 338:536 –540. CrossRef Medline Szabo´ GG, Lenkey N, Holderith N, Andra´si T, Nusser Z, Hajos N (2014) Presynaptic calcium channel inhibition underlies CB1 cannabinoid receptor-mediated suppression of GABA release. J Neurosci 34:7958 – 7963. CrossRef Medline Takahashi T, Forsythe ID, Tsujimoto T, Barnes-Davies M, Onodera K (1996) Presynaptic calcium current modulation by a metabotropic glutamate receptor. Science 274:594 –597. CrossRef Medline Thomson AM (1997) Activity-dependent properties of synaptic transmission at two classes of connections made by rat neocortical pyramidal axons in vitro. J Physiol 502:131–147. CrossRef Medline Tomioka NH, Yasuda H, Miyamoto H, Hatayama M, Morimura N, Matsumoto Y, Suzuki T, Odagawa M, Odaka YS, Iwayama Y, Won Um J, Ko J, Inoue Y, Kaneko S, Hirose S, Yamada K, Yoshikawa T, Yamakawa K, Aruga J (2014) Elfn1 recruits presynaptic mGluR7 in trans and its loss results in seizures. Nat Commun 5:4501. CrossRef Medline Veatch SL, Machta BB, Shelby SA, Chiang EN, Holowka DA, Baird BA (2012) Correlation functions quantify super-resolution images and estimate apparent clustering due to over-counting. PLoS One 7:e31457. CrossRef Medline Zhong H, Yokoyama CT, Scheuer T, Catterall WA (1999) Reciprocal regulation of P/Q-type Ca 2⫹ channels by SNAP-25, syntaxin and synaptotagmin. Nat Neurosci 2:939 –941. CrossRef Medline