Targeted and Depth-first Exploration for Systematic Testing of Android Apps.
Tanzirul Azim. University of California, Riverside
Targeted and Depth-first Exploration for Systematic Testing of Android Apps Tanzirul Azim
Iulian Neamtiu
University of California, Riverside
[email protected]
University of California, Riverside
[email protected]
Abstract Systematic exploration of Android apps is an enabler for a variety of app analysis and testing tasks. Performing the exploration while apps run on actual phones is essential for exploring the full range of app capabilities. However, exploring real-world apps on real phones is challenging due to non-determinism, non-standard control flow, scalability and overhead constraints. Relying on end-users to conduct the exploration might not be very effective: we performed a 7-user study on popular Android apps, and found that the combined 7-user coverage was 30.08% of the app screens and 6.46% of the app methods. Prior approaches for automated exploration of Android apps have run apps in an emulator or focused on small apps whose source code was available. To address these problems, we present A3 E, an approach and tool that allows substantial Android apps to be explored systematically while running on actual phones, yet without requiring access to the app’s source code. The key insight of our approach is to use a static, taint-style, dataflow analysis on the app bytecode in a novel way, to construct a high-level control flow graph that captures legal transitions among activities (app screens). We then use this graph to develop an exploration strategy named Targeted Exploration that permits fast, direct exploration of activities, including activities that would be difficult to reach during normal use. We also developed a strategy named Depth-first Exploration that mimics user actions for exploring activities and their constituents in a slower, but more systematic way. To measure the effectiveness of our techniques, we use two metrics: activity coverage (number of screens explored) and method coverage. Experiments with using our approach on 25 popular Android apps including BBC News, Gas Buddy, Amazon
Permission to make digital or hard copies of all or part of this work for personal or classroom use is granted without fee provided that copies are not made or distributed for profit or commercial advantage and that copies bear this notice and the full citation on the first page. Copyrights for components of this work owned by others than ACM must be honored. Abstracting with credit is permitted. To copy otherwise, or republish, to post on servers or to redistribute to lists, requires prior specific permission and/or a fee. Request permissions from
[email protected]. OOPSLA ’13, October 29–31, 2013, Indianapolis, Indiana, USA. c 2013 ACM 978-1-4503-2374-1/13/10. . . $15.00. Copyright http://dx.doi.org/10.1145/2509136.2509549
Mobile, YouTube, Shazam Encore, and CNN, show that our exploration techniques achieve 59.39–64.11% activity coverage and 29.53–36.46% method coverage.
Categories and Subject Descriptors D.2.4 [Software Engineering]: Software/Program Verification—Reliability, Validation; D.2.5 [Software Engineering]: Testing and Debugging— Testing tools,Tracing General Terms Languages, Reliability, Verification Keywords Google Android, GUI testing, Systematic exploration, Test case generation, Code coverage, Greybox testing, Dynamic analysis, Taint analysis
1.
Introduction
Users are increasingly relying on smartphones for computational tasks [1, 2], hence concerns such as app correctness, performance, and security become increasingly pressing [6, 8, 30, 31, 38]. Dynamic analysis is an attractive approach for tackling such concerns via profiling and monitoring, and has been used to study a wide range of properties, from energy usage [38, 39] to profiling [40] and security [31]. However, dynamic analysis critically hinges on the availability of test cases that can ensure good coverage, i.e., drive program execution through a significant set of representative program states [36, 37]. To facilitate test case construction and exploration for smartphone apps, several approaches have emerged. The Monkey tool [15] can send random event streams to an app, but this limits exploration effectiveness. Frameworks such as Monkeyrunner [24], Robotium [18] and Troyd [20] support scripting and sending events, but scripting takes manual effort. Prior approaches for automated GUI exploration [9– 12, 17, 34] have one or more limitations that stand in the way of understanding how popular apps run in their natural environment, i.e., on actual phones: running apps in an emulator, targeting small apps whose source code is available, incomplete model extraction, state space explosion. For illustration, consider the task of automatically exploring popular apps, such as Amazon Mobile, Gas Buddy, YouTube, Shazam Encore, or CNN, whose source code is not available. Our approach can carry out this task, as shown in Section 6, since we connect to apps running naturally on the
phone. However, existing approaches have multiple difficulties due to the lack of source code or running the app on the emulator where the full range of required sensor inputs (camera, GPS, microphone) or output devices (e.g., flashlight) is either unavailable [32] or would have to be simulated. To tackle these challenges, we present Automatic Android App Explorer (A3 E), an approach and open-source tool1 for systematically exploring real-world, popular apps Android apps running on actual phones. Developers can use our approach to complement their existing test suites with automatically-generated test cases aimed at systematic exploration. Since A3 E does not require access to source code, users other than the developers can execute substantial parts of the app automatically. A3 E supports sensors and does not require kernel- or framework-level instrumentation, so the typical overhead of instrumentation and device emulation can be avoided. Hence we believe that researchers and practitioners can use A3 E as a basis for dynamic analyses [36] (e.g., monitoring, profiling, information flow tracking), testing, debugging, etc. In this paper, our approach is focused on improving coverage at two granularity levels: activity (high-level) and method (low-level). Activities are the main parts of Android apps—an activity roughly corresponds to a different screen or window in traditional GUI-based applications. Increasing activity coverage means, roughly, exploring more screens. For method coverage we focus on covering app methods, as available in the Dalvik bytecode (compiled from Java), that runs on the Dalvik VM on an actual phone; an activity’s implementation usually consists of many methods, so by improving method coverage we allow the functionality associated with each activity to be systematically explored and tested. In Section 2 we provide an overview of the Android platform and apps, we define the graphs that help drive our approach, and provide definitions for our coverage metrics. To understand the level of exploration attained by Android app users in practice, we performed a user study and measured coverage during regular interaction. For the study, we enrolled 7 users that exercised 28 popular Android apps. We found that across all apps and participants, on average, just 30.08% of the app screens and 6.46% of the app methods were explored. The results and reasons for these low levels of coverage are presented in Section 3. In Section 4 we present our approach for automated exploration: given an app, we construct systematic exploration traces that can then be replayed, analyzed and used for a variety of purposes, e.g., to drive dynamic analysis or assemble test suites. Our approach consists of two techniques, Targeted Exploration and Depth-First Exploration. Targeted Exploration is a directed approach that first uses static bytecode analysis to extract a Static Activity Transition Graph and then explore the graph systematically while the app runs 1 http://spruce.cs.ucr.edu/A3E/
on a phone. Depth-First Exploration is a completely dynamic approach based on automated exploration of activities and GUI elements in a depth-first manner. In Section 5 we provide an overview of A3 E’s implementation: hardware platform, tools and measurement procedures. In Section 6 we provide an evaluation of our approach on 25 apps (3 apps could not be explored because they were written mainly in native code rather than bytecode). We show that our approach is effective: on average it attains 64.11% and 59.39% activity coverage via Targeted and Depth-first Exploration, respectively (a 2x increase compared to what the 7 users have attained); it also attains 29.53% and 36.46% method coverage via Targeted and Depth-first Exploration, respectively (a 4.5x increase compared to the 7 users). Our approach is also efficient: average figures are 74 seconds for Static Activity Transition Graph construction, 87 minutes for Targeted Exploration and 104 minutes for Depth-first Exploration. In summary, this work makes the following contributions: • A qualitative and quantitative study of coverage attained in practice by 7 users for 28 popular Android apps. • Two approaches, Targeted Exploration and Depth-first Exploration, for exploring substantial apps running on Android smartphones. • An evaluation of the effectiveness of Targeted and Depthfirst Exploration on 25 popular Android apps.
2.
Android Activities, Graphs and Metrics
We have chosen Android as the target platform for our A3 E implementation as it is currently the leading mobile platform in the US [4] and worldwide [3]. We now describe the highlevel structure of Android platform and apps; introduce two kinds of Activity Graphs that define the high-level workflow within an app; and define coverage based on these graphs. 2.1
Android App Structure
Android platform and apps. Android apps are typically written in Java (possibly with some additional native code). The Java code is compiled to a .dex file, containing compressed bytecode. The bytecode runs in the Dalvik virtual machine, which in turn runs on top of a smartphone-specific version of the Linux kernel. Android apps are distributed as .apk files, which bundle the .dex code with a “manifest” (app specification) file named AndroidManifest.xml. Android app workflow. A rich application framework facilitates Android app construction, as it provides a set of libraries, a high-level interface for interaction with low-level devices, etc. More importantly, for our purposes, the application framework orchestrates the workflow of an app, which makes it easy to construct apps but hard to reason about control flow. A typical Android app consists of separate screens named Activities. An activity defines a set of tasks that can be grouped together in terms of their behavior and corresponds
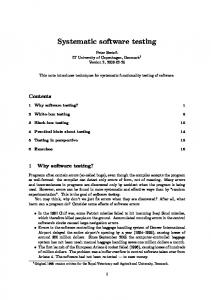
Activity Coverage: Activities and Transition Clicking Search Box
Typing in Search Box
Selecting in the List of Items
1
2
3
1. Main Activity
2. Search Activity
3. Search List Activity
Figure 1. An example activity transition scenario from the popular Android app, Amazon Mobile. to a window in a conventional desktop GUI. Developers implement activities by thereach android .app. Activitypoint Canextending be used to a particular class. As Android apps are GUI-centric, the programming application. i.e., regenerate bugs. model is based on callbacks and differs from the traditional main()-based model. The Android framework will invoke the callbacks in response to GUI events and developers can control activity behavior throughout its life-cycle (create, paused, resumed, or destroy) by filling-in the appropriate callbacks. An activity acts as a container for typical GUI elements such as toasts (pop-ups), text boxes, text view objects, spinners, list items, progress bars, check boxes. When interacting with an app, users navigate (i.e., transition between) different activities using the aforementioned GUI elements. Therefore in our approach activities, activity transitions and activity coverage are fundamental, because activities are the main interfaces presented to an end-user. For this reason we primarily focused on activity transition during a normal application run, because its role is very significant in GUI testing. Activities can serve different purposes. For example in a typical news app, an activity home screen shows the list of current news; selecting a news headline will trigger the transition to another activity that displays the full news item. Activities are usually invoked from within the app, though some activities can be invoked from outside the app if the host app allows it. Naturally, these activity transitions form a graph. In Figure 1 we illustrate how activity transitions graphs emerge as a result of a user interaction in the popular Android app, Amazon Mobile. On top we have the textual description of users’ actions, in the middle we have an actual screen shot, and on the bottom we have the activities and their transitions. Initially the app is in the Main Activity; when the user clicks the search box, the app transitions to the Search Activity (note the different screen). The user searches for items by typing in item names, and a textual list of items is presented. When the user presses “Go”, the screen layout changes as the app transitions to the Search List Activity.
App Amazon Mobile Angry Birds Angry Birds Space P. Advanced Task Killer Advanced Task Killer P. BBC News CNN Craigslist Mobile Dictionary.com Dictionary.com Ad-free Dolphin Browser ESPN ScoreCenter Facebook Tiny Flashlight + LED Movies by Flixster Gas Buddy IMDb Movies & TV Instant Heart Rate Instant Heart R.-Pro ofPandora the internet radio PicSay - Photo Editor PicSay Pro - Photo E. Shazam Shazam Encore WeatherBug WeatherBug Elite YouTube ZEDGE
Type Category Free Free Paid Free Paid Free Free Free Free Paid Free Free Free Free Free Free Free Free Paid Free Free Paid Free Paid Free Paid Free Free
Size Kinst. KBytes Shopping 146 4,501 Games 167 23,560 Games 179 25,256 Productivity 9 75 Productivity 3 99 News&Mag. 77 890 News&Mag. 204 5,402 Shopping 56 648 Books&Ref. 105 2,253 Books&Ref. 49 1,972 Communication 248 4,170 Sports 78 1,620 Social 475 3,779 Tools 47 1,320 Entertainment 202 4,115 Travel&Local 125 1,622 Entertainment 242 3,899 Health&Fit. 63 5,068 Health&Fit. 63 5,068 Music&Audio 214 4,485 Photography 49 1,315 Photography 80 955 Music&Audio 308 4,503 Music&Audio 308 4,321 Weather 187 4,284 Weather 190 4,031 Media&Video 253 3,582 Personalization 144 1,855
# Downloads 58,745 1,586,884 14,962 428,808 4,638 14,477 33,788 61,771 285,373 2,775 1,040,437 195,761 6,499,521 1,612,517 398,239 421,422 129,759 100,075 6,969 968,714 96,404 18,455 432,875 18,617 213,688 40,145 1,262,070 515,369
Table 1. Overview of our examined apps. We now proceed to defining the activity transitions graphs that form the basis of our work. 2.2
Static Activity Transition Graph
The Static Activity Transition Graph (SATG) is a graph GS = (VS , ES ) where the set of vertices, VS , represents the app activities, while the set of edges, ES , represents possible activity transitions. We extract SATG’s automatically from apps using static analysis, as described in Section 4.1. Figure 2 shows the SATG for the popular shopping app, Craigslist Mobile; the reader can ignore node and edge colors as well as line styles for now. Note that activities can be called independently, i.e., without the need for entering into another activity. Therefore, the SATG can be a disconnected graph. SATG’s are useful for program understanding as they provide an at-a-glance view of the high-level app workflow. 2.3
Dynamic Activity Transition Graph
The Dynamic Activity Transition Graph (DATG) is a graph GD = (VD , ED ) where the set of vertices, VD , represents the app activities, while the set of edges, ED , represents actual activity transitions, as observed at runtime. A DATG captures the footprint of dynamic exploration or user interaction in an intuitive way and is a subgraph of the SATG. Figure 2 contains the DATG for the popular shopping app, Craigslist Mobile: the DATG is the subgraph consisting of solid edges and nodes. Paths in DATG’s illustrate sequences of actions required to reach a particular state of an app, which is helpful for constructing test cases or repro-
CraigslistStartup
SearchActivity
StateActivity
LocationActivity
ItemListActivity
CityActivity
ItemActivity
MMAdViewWebOverlay
PostSelectionActivity
PostComposeActivity
MMAdViewController
VideoPlayerActivity
LoginActivity
BrowserActivity
SearchSettingActivity
CategoryActivity
AdActivity
PlusOneActivity
MMAdViewOverlayActivity
VerificationActivity
Figure 2. Static Activity Transition Graph extracted automatically by our approach from the Craigslist Mobile app. Grey nodes and associated edges have been explored by users. Solid-contour nodes (grey or white) and solid-line edges were traversed dynamically by our exploration. Dashed-contour nodes and dashed-line edges remained unexplored. Activity names are simplified for legibility. ducing bugs. In the Appendix (Figure 7) we present a second DATG example based on runs from 5 different users, which is illustrates how different users exercise the app differently. 2.4
Coverage Metrics
We chose two coverage metrics as basis for measuring and assessing the effectiveness of our approach: activity coverage and method coverage. We chose these metrics because they strike a good balance between utility and collection overhead: first, activities and methods are central to app construction, so the numeric values of activity and method coverage are intuitive and informative; second, the runtime performance overhead associated with collecting these metrics is low enough so that user experience and app performance are not affected. We now proceed to defining the metrics. Activity coverage. We define activity coverage (AC) as the ratio of activities reached during execution (AR) to the total number of activities defined in the app (AT ), that is, AC = AR AT . Intuitively, the higher the AC for a certain run, the more screens have been explored, and the more thorough and complete the app exploration has been. We retrieve the AR dynamically, and the AT statically, as described in Section 5.2. Method coverage. Activity coverage is intuitive, as it indicates what percentage of the screens (that is, functionality at a high level) are reached. In addition, users might be interested in the thoroughness of exploration measured at a lower, method-level. Hence we use a finer-grained metric—what percentage of methods are reached—to quantify this aspect. We define method coverage (M C) as the ratio of methods
called during execution (M E) to the total number of methE ods defined in the app (M T ), that is, M C = M MT . We found that all the examined apps, except Advanced Task Killer, ship with third-party library code bundled in the app’s APK file; we exclude third-party methods from M E and M T computations as these methods were not defined by app developers hence we consider that including them would be misleading. We measured the M E using runtime profiling information and the M T via static analysis, as described in Section 5.2.
3.
User Study: Coverage During Regular Use
One possible approach to exploration is to rely on (or at least seed the exploration with) actual runs, i.e., by observing how end-users interact with the app. Unfortunately, this approach is not systematic: as our measurements indicate, during normal user interaction, coverage tends to be low, as users explore just a small set among the features and functionality offered by the app. Therefore, relying on users might have limited utility. To quantify the actual coverage attained by endusers, we have performed a user study, as described next. App dataset. As of March 2013, Google Play, the main Android app market, lists more than 600,000 apps. We selected a set of 28 apps for our study; the apps and their characteristics are presented in Table 1. The selection was based on several criteria. First, we wanted a mix of free and paid apps, so for 7 apps we selected both the free and the paid versions (column 2). Second, we wanted representation across different categories such as productivity, games, entertainment, news; in total, our dataset has apps from 17 dif-
ferent categories (column 3). Third, we wanted substantial apps; the sizes of our selected apps, in thousands of bytecode instructions and KB, respectively, are shown in columns 4 and 5. Finally, we wanted to investigate popular apps; in the last column we show the number of downloads as listed on Google Play as of March 28, 2013; the number of downloads varied from 2,775 to 6,499,521. We believe that this set covers a good range of popular, real-world mobile apps. Methodology. We enrolled 7 different users in our study; one high-coverage minded user (called User 1) and six “regular” users (User 2–User 7). Each app was exercised by each user for 5 minutes, which is far longer than the typical average app session (71.56 seconds) [35]. To mirror actual app use “in the wild,” the six regular users were instructed to interact with the app as they normally would; that is, regular users were not told that they should try to achieve high coverage. However, User 1 was special because the user’s stated goal was to achieve maximum coverage within the time limit. For each run, we collected runtime information so we could replicate the experiment later. We then analyzed the 192 runs2 to quantify the levels of activity coverage (separate screens) and method coverage attained in practice. 3.1
We can see that in regular exploration cumulative coverage is quite low across users: mean3 cumulative coverage is 30.08% across all apps. We now proceed to explain why that is the case. Why are so few activities explored? The “Missed activities” group of columns in Table 2 shows, for each app, the number of activities that all users missed (first column in the group), and the reason why these activities were missed (the remaining 6 columns in the group). We were able to group the missing activities into the following categories: • Unexplored features. Specific features can be missed
because users are not aware of/interested in those features. For example, apps such as Dictionary.com or Tiny Flashlight + LED, provide a “widget” feature, i.e., an app interface typically wider than a desktop icon to provide easy to access functionality. Another example is “voice search” functionality in the Dolphin Browser browser, which is only explored when users search by voice. • Social network integration. Many apps offer the op-
tion to share information on social networking sites— third-party sites such as Facebook or Twitter, or the app’s own network, e.g., Shazam. During normal app use, users do not necessarily feel compelled to share information. These missed activity types appear in the “social” column.
Activity Coverage
We now turn to discussing the levels of activity coverage that could be attained based on end-user coverage (separate and combined across users) for each metric. Cumulative coverage. As different users might explore different app features, we developed a technique to “merge” different executions of the same app. More specifically, given two DATG’s G1 and G2 (as defined in Section 2.3), we construct the union, i.e., a graph G = G1 ∪ G2 that contains the union of G1 and G2 ’s nodes and edges. This technique can potentially increase coverage if the different executions explore different parts of the app. We use this graph unionbased cumulative coverage as a basis for comparing manual exploration with automated exploration. Results. In Table 2, we present the activity count and a summary of the activity coverage achieved manually by the 7 users. Column 2 presents the number of activities in each app, including ads. Column 3 presents the number of activities, excluding ads (hence these numbers indicate the maximum the number of activities users can explore without clicking on ads). Column 4 shows the cumulative activity coverage, i.e., when combining coverage via graph union. The percentages are calculated with respect to column 3, i.e., non-ad activities; we decided to exclude ads as they are not related to core app functionality. The complete dataset (each app, each user) is available in Table 5 in the Appendix.
• Account. Many apps can function, e.g., watch videos on YouTube, without the user necessarily logging-in. If an
user logs into her account, she can see her profile and have access to further activities, e.g., account settings or play-lists on YouTube. In those cases where users did not have (or did not log into) an account, account-specific activities were not exercised. • Purchase. E-commerce apps such as Amazon Mobile of-
fer functionality such as buy/sell items. If test users do not conduct such operations, those activities will not be explored. • Options. When users are content with the default settings
of the app and do not change settings, e.g., by accessing the “options” menu, options activities are not exercised. • Ads. Many free apps contain ad-related activities. For example, in Angry Birds, all the activities but one (play
game) were ad-related. Therefore, in general, free apps contain more activities than their paid counterparts—see Angry Birds, Advanced Task Killer, Dictionary.com. When users do not click on ads, the ad-related activities are not explored. 3.2
Method Coverage
Since activity coverage was on average about 30%, we would expect method coverage to be low as well, as the
2 We
had access to 192 (28 × 7 − 4) instead of 196 runs; due to the unavailability of two user study subjects, we could not collect app execution data for two users for the apps IMDb Movies & TV and BBC News.
3 We
use geometric mean for all mean computations due to large standard deviations.
Mean a
• • • • • • • • • • • • • • •
• • • • •
• • •
• • • • • • • •
•
•
• • • • • •
• • •
• •
• • •
• • • • • • • • • • •
• •
Method coverage (%) Users 1–7 (cumulative)
•
Methods
Ads
•
Options
Social
•
Purchase
30 6 0 3 2 3 10 35 11 4 49 2 95 4 48 29 30 15 16 30 9 9 36 33 24 24 17 18
Account
25.64 100 100 70 57 52.34 19.05 42 61 73.33 12.5 60 5.60 66.67 23.3 30.2 25.64 29.4 13.2 12.5 10 33.33 15.8 22.3 29 14.30 27.77 38.9 30.08
Features
36 1 1 6 6 10 39 15 18 15 56 5 107 4 67 33 37 14 16 30 10 10 37 37 24 28 18 34
Missed activities
# Missed
39 8 1 7 6 10 42 17 22 15 56 5 107 6 68 38 39 17 17 32 10 10 38 38 29 28 18 34
Users 1–7 (cumulative)
Activity coverage (%)
Excluding ads
Amazon Mobile Angry Birds Angry Birds Space Premium Advanced Task Killer Advanced Task Killer Pro BBC News CNN Craigslist Mobile Dictionary.com Dictionary.com Ad-free Dolphin Browser ESPN ScoreCenter Facebook Tiny Flashlight + LED Movies by Flixster Gas Buddy IMDb Movies & TV Instant Heart Rate Instant Heart Rate - Pro Pandora internet radio PicSay - Photo Editor PicSay Pro - Photo Editor Shazam Shazam Encore WeatherBug WeatherBug Elite YouTube ZEDGE
Activities
Total #
App
7,154 6,176 7,402 3,836 427 257 7,725 2,095 2,784 1,272 13,800 4,398 21,896 1,578 7,490 5,792 8,463 2,002 1,927 7,620 1,580 -a 9,884 9,914 7,948 8,194 11,125 6287
4.93 10.98 0.68 11.46 21.32 7.69 4.97 10.76 13.83 19.10 13.26 1.35 1.69 15.91 5.32 9.13 4.60 4.60 5.13 3.21 4.39 9.43 9.32 8.15 6.39 5.13 9.27 6.46
We could not get method profiling data for PicSay Pro as the profiler could not analyze it.
Table 2. The results of our user study. methods associated with unexplored activities will not be invoked. The last group of columns in Table 2 shows the total number of methods for each app, as well as the percentages of methods covered by Users 1 and 2–7, respectively. We can see that method coverage is quite low: 6.46% is the mean cumulative coverage for users 1–7. The complete dataset (each app, each user) is available in Table 6 in the Appendix. In Section 6.1 we provide a detailed account of why method coverage is low.
4.
Approach
We now present the two thrusts of our approach: Targeted Exploration, whose main goal is to achieve fast activity ex-
ploration, and Depth-first Exploration, whose main goal is to systematically explore app states. The two strategies are not complementary; rather, we devised them to achieve specific goals. Depth-first Exploration tests the GUI similarly to how an user would, i.e., clicking on objects or editing text boxes, going to newer activities and then returning to the previous ones via the “back” button. Targeted Exploration is designed to handle some special circumstances: it can list all the activities which can be called from other apps or background services directly without user intervention, and generates calls to invoke those activities directly. The Targeted strategy was required because not all activities are invoked through user interaction. Both strategies can start the exploration in the
// class NewsListActivity extends TitleActivity public void onItemClick (...) { Intent localIntent = new Intent(this , NewsStoryActivity . class ); ... startActivityWithoutAnimation ( localIntent ); } // class TitleActivity extends RootActivity public startActivityWithoutAnimation ( Intent paramIntent) { super. startActivityWithoutAnimation (paramIntent); } // class RootActivity protected void startActivityWithoutAnimation ( Intent paramIntent) { startActivity (paramIntent );...}
Figure 4. Intent passing through superclasses in NPR News. app entry points, inject user-like GUI actions and generate callbacks to invoke certain activities. To illustrate the main principles behind these strategies, let us get back to the flow of the Amazon Mobile app shown in Figure 1. In Targeted Exploration, the SATG is constructed via static analysis, and our exploration focuses on quickly traversing activities in the order imposed by the SATG—in the Amazon Mobile case, we quickly and automatically move from Main Activity to Search Activity to Search List Activity. In Depth-first Exploration, we use the app entry points from the SATG (that is, nodes with no incoming edges) to start the exploration. Then, in each activity, we retrieve the GUI elements and exercise them systematically. In the Amazon Mobile case, we start with the Main Activity and exercise all its contained GUI elements systematically (which will lead to eventually exploring Search Activity and from there, Search List Activity); this is more time-consuming, but significantly increases method coverage. We first discuss how the SATG is constructed (Section 4.1), then show how it drives Targeted Exploration (Section 4.2); next we present Depth-first Exploration (Section 4.3) and finally how our approach supports test case generation and debugging (Section 4.4). 4.1
SATG Construction
Determining the correct order in which GUI elements of an Android app should be explored is challenging. The main problem is that the control flow of Android apps is nonstandard: there is no main(), but rather apps are centered around callbacks invoked by the Android framework in response to user actions (e.g., GUI events) or background services (e.g, GPS location updates). This makes reasoning about control flow in the app difficult. For example, if the current activity is A and a transition to activity B is possible as a result of user interaction, the methods associated with A will not directly invoke B. Instead, the transition is based on a generic intent passing logic, which we will discuss shortly. We realized that intent passing and consequently SATG construction can be achieved via data-flow analysis, more specifically taint tracking. Hence our key insight is that
SATG construction can be reduced to a taint-tracking problem. Coming back to our prior example with the A and B activities, using an appropriately set-up taint analysis, we taint B; if the taint can reach an actual invocation request from A, that means activity B is reachable from A and we add an A→B edge to the SATG. The “glue” for activity transitions is realized by objects named Intents. Per the official Android documentation [33], an Intent is an “abstract description of an operation to be performed.” Intents can be used to start activities by passing the intent as an argument to a startActivity -like method. Intents are also used to start services, or send broadcast messages to other apps. Hence tracking taint through intents is key for understanding activity flow. We now provide several examples to illustrate SATG construction using taint analysis over the intent passing logic. In Figure 3, on the left we have valid Android Java code for class A that implements an activity. Suppose the programmer wants to set up a transition to another activity class, B. We show three examples of how this can be done by initializing the intent initialized in a method of A, say A.foo() , and coupling it with the information regarding the target activity B. In Example 1, we make the A→B connection by passing the class names to the intent constructor. In Example 2, the connection is made by setting the B’s class as the intent’s class. In Example 3, B is set to be called as a component of the intent. Our analysis will tag these Intent object declarations (new Intent() ) as sources. Next, the taint analysis will look for sinks; in our example, the tagged sinks are startActivity , startActivityForResult , and startActivityIfNeeded . Of course, while here we show the Java code for clarity, our analysis operates on bytecode. Taint tracking is shown in Figure 3 (center): after tagging sinks and sources, the taint analysis will propagate dataflow facts through the app code, and in the end check whether tainted sources reach sinks. For all (source, sink) pairs for which taint has been detected, we add an edge in the SATG (Figure 3 (right)). Hence the general principle for constructing the SATG is to identify Intent construction points as sources, and activity start requests as sinks. A more complicated, real-world example, of how our analysis tracks taint through a class hierarchy is shown in Figure 4, a code snippet extracted from the NPR News app. An Intent is initialized in NewsListActivity .onItemClick (...) , tagged as a source, and passed through the superclass TitleActivity to its superclass RootActivity . The startActivity (on the last line) is tagged as a sink. When the analysis concludes, based on the detected taint, we add an edge from NewsListActivity to NewsStoryActivity in the SATG. 4.2
Targeted Exploration
We now proceed to describing how we perform Targeted Exploration using the SATG as input. Figure 5 provides an overview. The automatic explorer, running on a desktop or
Tagging sources and sinks
Static analysis
public class A extends Activity { ... public void foo() { /∗ Example 1 ∗/ Intent intent1 = new Intent(A, B); //tagged as source ... startActivity ( intent1 ); //tagged as sink
Resulting SATG
SCanDroid
A: intent=new Intent (A, B)
/∗ Example 2 ∗/ Intent intent2 =new Intent(); //tagged as source intent . setClass ( this , B. class ); ... startActivityForResult ( intent2 , requestCode); //tagged as sink /∗ Example 3 ∗/ Intent intent3 = new Intent(); //Intent object tagged as source intent .setComponent(new ComponentName(‘‘package.name’’, ‘‘B’’)); ... startActivityIfNeeded ( intent3 , requestCode); //tagged as sink }}
A
Track taint through app
A: startActivity(intent)
B
Figure 3. Constructing SATG’s with taint analysis: sources and sinks are tagged automatically (left), taint is tracked by SCanDroid (center); the resulting SATG (right). App&Bytecode&
Automa/c* explorer*
SCanDroid*
Debugging&Bridge&
APK*
Sta$c&Ac$vity& Transi$on&Graph&
Sta$c&Taint&Analysis&
App&running&on&phone&
Targeted& Explora$on&
Results&
Replayable* Trace*
Coverage** summary*
Figure 5. Overview of Targeted Exploration in A3 E. laptop, orchestrates the exploration. The explorer first reads the SATG constructed by SCanDroid (a static dataflow analyzer that we customized to track intent tainting, as described in Section 4.1) from the app’s bytecode, and then starts the app on the phone. Our SATG construction algorithm lists all the exported activities, and entry point activities. Exported activities are activities that can be independently called from within or outside the app; they are marked as such by setting the parameter exported=true in the manifest file. Note that not all activities can be called from outside—some have to be reached by the normal process, primarily for security reasons and to maintain application workflow. For example, when an activity can receive parameters from a previous activity, the parameters may contain security information that
is limited to the application domain. Therefore, we cannot just “jump” to any arbitrary activity. Next, the explorer runs the Targeted Exploration algorithm, which we will describe shortly. The explorer controls the app execution and communicates with the phone via the Android Debugging Bridge. The result of the exploration consists of a replayable trace—a sequence of events that can be replayed using our RERAN tool [7]—as well as coverage information. We now proceed to describing the algorithm behind targeted exploration; parts of the algorithm run on the phone, parts in the automatic explorer. In a nutshell, the SATG contains edges A→B indicating legal activity transitions. Assuming we are currently exploring activity A, we have two
cases for B: (1) B is “exportable”,4 that is, reachable from A but not a result of local GUI interaction in A; or (2) B is reached from A as a result of local GUI interaction in A. In case (1) we switch to B directly, and in case (2) we switch to B when exploring A’s GUI elements. In either case, exploration continues recursively from B. Algorithm 1 provides a precise description of the Targeted Exploration approach. The algorithm starts with the SATG as input. First, we extract the app’s entry point activities from the SATG (line 2) and start exploration at one of these entry points Ai (lines 3–4). We look for all the exportable activities Aj that have an incoming edge from Ai (lines 5–6). We then switch to each of these exportable activities and invoke the algorithm recursively from Aj (lines 7–10). Activities An that are not exportable but reachable from Ai will be switched to automatically as a result of local GUI exploration (lines 13–16) and then we invoke the algorithm recursively from An (lines 17–19). The advantage of Targeted Exploration is that it can achieve activity coverage fast—we can switch to exportable activities without firing GUI events. 4 The
list of exportable activities is available AndroidManifest.xml file included with the app.
in
the
App#Bytecode# Automa'c) explorer)
APK)
Debugging#Bridge#
Algorithm 1 Targeted Exploration Input: SATG GS = (VS , ES ) 1: procedure TARGETED E XPLORATION (GS ) 2: for all nodes Ai in VS that are entry points do 3: Switch to activity Ai 4: currentActivity ← Ai 5: for all edges Ai → Aj in ES do 6: if Aj is exportable then 7: Switch to activity Aj 8: currentActivity ← Aj 9: G0S ← subgraph of GS from starting node Aj 10: TARGETED E XPLORATION(G0S ) 11: end if 12: end for 13: guiElementSet ← E XTRACT G UI E LE MENTS (currentActivity) 14: for each guiElement in guiElementSet do 15: exercise guiElement 16: if there is an activity transition to not-yetexplored activity An then 17: G0S ← subgraph of GS from starting node An 18: currentActivity ← An 19: TARGETED E XPLORATION(G0S ) 20: end if 21: end for 22: end for 23: end procedure
Depth3first# Explora:on#
App#running# on#phone#
Results#
Replayable) Trace)
Coverage)) summary)
Figure 6. Overview of Depth-first Exploration in A3 E. Algorithm 2 Depth-First Exploration Input: Entry point activities |A| 1: procedure DFE(|A|) 2: for all nodes Ai in |A| do 3: Switch to activity Ai 4: D EPTH F IRST E XPLORATION(Ai ) 5: end for 6: end procedure 7: 8: 9: 10: 11: 12: 13: 14: 15: 16: 17:
4.3
procedure D EPTH F IRST E XPLORATION(Ai ) guiElementSet ← E XTRACT G UI E LEMENTS(Ai ) for each guiElement in guiElementSet do excercise guiElement if there is an activity transition to not-yetexplored activity An then D EPTH F IRST E XPLORATION(An ) Switch back to activity Ai end if end for end procedure
Depth-First Exploration
We now proceed to presenting Depth-First Exploration, an approach that takes more time but can achieve higher method coverage. As it is a dynamic approach, Depth-First Exploration can be performed even when the tester does not have activity transition information (i.e., the SATG) beforehand. As the name suggests, this technique employs depth-first search to mimic how an actual user would interact with the app. Figure 5 provides an overview. In this case, no SATG is used, but the automatic explorer runs a different, Depthfirst Exploration algorithm, which we will describe shortly. The rest of the operations are identical with Targeted Explo-
ration, that is, the explorer orchestrates the exploration and the results are a replayable trace and coverage information. Algorithm 2 provides the precise description of the Depth-first Exploration approach. Similar to Targeted Exploration, we first extract the entry point activities from the app’s APK; these activities will act as starting points for the exploration. We then choose a starting point Ai and start depth-first exploration from that point (lines 1–5). For each activity Ai , we extract all its GUI elements (line 9). We then systematically exercise the GUI elements by firing their corresponding event handlers (lines 10–11). Whenever we detect a transition to a new activity An , we apply the same algorithm recursively on An (line 13). This process continues in a depth-first manner until we do not find any transition to a newer activity after exercising all the GUI elements in that screen. We then go back to the previous activity and continue exploring its view elements (line 14). 4.4
Replayable Test Cases and Debugging
During exploration, A3 E automatically records the event stream using R ERAN, a low-overhead record-and-replay tool [7], so that the exploration, or parts thereof, can be replayed. This feature helps users construct test cases that can later be executed via R ERAN’s replay facility. In addition, the integration with R ERAN facilitates debugging—if the app crashes during exploration, we have the exact event stream that has led to the crash; assuming the crash is deterministic, we can reproduce it by replaying the event stream.
5.
Implementation
We now proceed to presenting the experimental setup, implementation details, and measurement procedures used for constructing and evaluating A3 E. 5.1
Setup and Tools
The smartphones used for experiments were Motorola Droid Bionic running Android version 2.3.4, Linux kernel version 2.6.35. The phones have Dual Core ARM Cortex-A9 CPUs running at 1GHz. We controlled the experiments from a MacBook Pro laptop (2.66 GHz dual-core Intel Core i7 with 4GB RAM), running Mac OS X 10.8.3. For the user study, we used R ERAN, a tool we developed previously [7] to record user interaction so we could replay and analyze it later. SCanDroid is a tool for static analysis on Dalvik bytecode developed by other researchers and us [25]. For this work we extended SCanDroid in two directions: (1) to tag intents and activity life-cycle methods as sinks and sources so we can construct the SATG, and (2) to list all the app-defined methods—this information was used for method coverage analysis. 5.2
Measuring Coverage
Activity coverage. The automatic explorer keeps track of AR, the number of successfully explored activities, via the
logcat utility provided by Android Debug Bridge (adb) tool from the Android SDK. The total number of activities, AT , was obtained offline: we used the open source apktool to extract the app’s manifest file from the APK and parsed the manifest to list all the activities. From the AT and AR we exclude “outside” activities, as those are not part of the app’s code base. Examples of outside activities are ad-related activities and external system activities (browser, music player, camera, etc.) Method coverage. Android OS provides an Application Manager (am) utility that can create method profiles on-thefly, while the app is running. To measure M E, the number of methods called during execution, we extracted the method entries from the profiling data reported by am. We measured M T , the total number of methods in an app, via static analysis, by tailoring SCanDroid to find and list all the virtual and declared method calls within the app. Note that thirdparty code is not included in M E and M T computation (Section 3.2). 5.3
Automatic Explorer
GUI element extraction and exercising is required for both Targeted and Depth-first Exploration. To explore GUI elements, A3 E “rips” the app, i.e., extracts its GUI elements dynamically using the Troyd tool [20] (which in turn is based on Robotium [18]). Robotium can extract and fire event handlers for a rich set of GUI elements. This set includes lists, buttons, check boxes, toggle buttons, image views, text views, image buttons, spinners, etc. Robotium also provides functionality for editing text boxes, clearing text fields, clicking on text, clicking on screen positions, clicking on hardware home menu, and back button. Troyd allows developers to write Ruby scripts that can drive the app using the aforementioned functionality offered by Robotium (though Troyd does not require access to the app’s source code). A3 E is built on top of Troyd. We modified Troyd to allow automatic navigation through the app, as follows. Each Android screen consists of GUI elements linked via event handlers. Simply invoking all the possible event handlers and firing the events associated with them would be incorrect— the app has to be in a state where it can accept the events, which we detected by interacting with the live app. Hence A3 E relies on live extraction of the GUI elements that are actually present on the screen (we call a collection of such elements a view). We then systematically map the related event handlers, and call them mimicking a real user. This run-time knowledge of views was essential for our automated explorer to work. Once we get the information of the views, we can systematically fire the correct actions. As described in Section 3.1, our test users tended to skip features such as options, ads, settings, or sharing via social networks. To cover such activities and functionality, A3 E employs several strategies. A3 E automatically detects activities related to special responsibility, such as log in
screen, social networking, etc. We created sets of credential information (e.g., username/password pairs) that A3 E then sends to the app just like a user would do to get past the screen, and continues the exploration from there. As we implemented our approach on top of the Robotium testing framework, we had to compensate for its limitations. One such limitation was Robotium’s inability to generate and send gestures, which would leave many kinds of views incompletely exercised when using Robotium alone. To address this limitation we wrote a library of common simple gestures (horizontal and vertical swipes, straight line swipes, scrolling). We leave complex multi-touch gestures such as pinching and zooming to future work; as explained in our prior work [7], synthesizing complex, multi-touch gestures is non-trivial. In addition to the gesture library and log-on functionality, A3 E also supports microphone, GPS, compass, and accelerometer events. However, certain apps’ functionality required complex inputs, e.g., processing a user-selected file. Feeding such inputs could be achieved via OS-level record and replay, a task we leave to future work. With this library of input events, and GUI-element invocation strategies at hand, A3 E uses the appropriate exploration algorithm depending on the kind of exploration we perform, as described next. 5.4
Targeted Exploration
Section 4.1 described the intent passing logic among internal app activities, and Targeted Exploration uses the preconstructed SATG to explore these intra-app activity paths. However, the Android platform also allows activities to be called from external apps through implicit messaging by intents, as follows: apps can define intent “filters” to notify the OS that certain app activities accept intents and can be started when the external app sends such an intent. Therefore, when systematically exercising an app’s GUI elements, there is a chance that these externally-callable activities are missed if they are not reachable by internal activities. In addition to intent filters, developers can also identify activities as “exported,” by defining android:exported="true" in the manifest file. This will allow activities to be called from outside the app. When implementing Targeted Exploration we also invoked these externally-callable activities so we do not miss them when they are not reachable from internal activities. 5.5
Depth-First Exploration
With the infrastructure for dynamic GUI element extraction and event firing at hand, we implemented Depth-first Exploration using a standard depth-first strategy: each time we find a transition to a new activity, we switch to that activity and thus we enter deeper levels of the activity hierarchy. This process continues until we cannot detect any more transition from the current activity. At this point we recursively go back to the last activity and start exploring from there.
6.
Evaluation
We now turn to presenting experimental results. From the 28 examined apps presented in Section 3, we were able to explore 25; 3 apps could not be explored (Angry Birds, Angry Birds Space premium, Facebook) because they are written primarily in native code, rather than bytecode, as explained in Section 6.2. We first evaluate our automated exploration techniques on these apps in terms of effectiveness and efficiency (Section 6.1), then discuss app characteristics that make them more or less amenable to our techniques (Section 6.2). 6.1
Effectiveness and Efficiency
Activity coverage. We present the activity coverage results in Table 3. Column 2 shows the number of nodes in the SATG, that is, the number of activities in each app, excluding ads. The grouped columns 3–5 show the activity coverage in percents, in three scenarios: the cumulative coverage for users 1–7, coverage attained via Targeted Exploration, and coverage attained via Depth-first Exploration. We make several observations. First, systematic exploration increases activity coverage by a factor of 2x, from 30.08% attained by 7 users cumulatively to 64.11% and 59.39% attained by Targeted and Depth-first Exploration, respectively. Hence our approach is effective at systematically exploring activities. Second, SATG construction pays off; because it relies on statically-discovered transitions, Targeted Exploration will be able to fire transitions in cases where Depth-first Exploration cannot, and overcome a limitation of dynamic tools that start the exploration inside the app. Method coverage. The method coverage results are shown in the last columns of Table 3. The methods column shows the number of methods defined in the app, excluding thirdparty code. The next columns show activity coverage in percents, in three scenarios: the cumulative coverage for users 1–7, coverage attained via Targeted Exploration, and coverage attained via Depth-first Exploration. We make several observations. First, systematic exploration increases method coverage by about 4.5x, from 6.46% attained by 7 users cumulatively to 29.53% and 36.46% attained by Targeted and Depth-first Exploration, respectively. Hence our approach is effective at systematically exploring methods. Second, the lengthier, systematic exercising of each activity element performed by Depth-first Exploration translates to better exploration of methods associated directly (or transitively) with that activity. Exploration time. In Table 4 we show the time required for exploration. Column 2 contains the static analysis time, which is required for SATG construction; this is quite efficient, at most 10 minutes but typically 4 minutes or less. We measured exploration time by letting both Targeted and Depth-first explorations run to completion, that is until we have explored all entry point activities and activities we
Amazon Mobile Angry Birds Angry Birds Space Premium Advanced Task Killer Advanced Task Kill. P. BBC News CNN Craigslist Mobile Dictionary.com Dictionary.com Ad Free Dolphin Browser ESPN ScoreCenter Facebook Tiny Flashlight + LED Movies by Flixster Gas Buddy IMDb Movies & TV Instant Heart Rate Instant Heart Rate - Pro Pandora internet radio PicSay - Photo Editor PicSay Pro - Photo Editor Shazam Shazam Encore WeatherBug free WeatherBug Elite YouTube ZEDGE
Mean
vities 36 6 6 10 39 15 18 15 56 5 107 4 67 33 37 14 16 30 10 10 37 37 24 24 18 34
Activity coverage (%)
25.64 100 100 70 57 52.34 19.05 42 61 73.33 12.50 60 5.60 66.67 23.30 30.20 25.64 29.40 13.20 12.50 10 33.33 15.80 22.30 29 14.30 27.77 38.90 30.08
Targeted 63.90 83.33 83.30 80.00 69.23 73.30 83.33 100 42.86 80.00 75 77.60 72.70 54.10 42.86 37.50 80.0 50 50 45.95 45.90 54.17 91.70 55.56 67.60 64.11
Depth-first 58.30 83.33 83.30 80.00 61.54 66.70 72.22 80 37.50 80.00 75 61.20 63.60 62.10 35.71 37.50 76.70 40 40 45.95 51.40 45.83 87.50 50 67.60 59.39
Methods
Method coverage (%) Users 1–7 (cumulative)
Acti-
Users 1–7 (cumulative)
App
7,154 420 257 3,836 9,269 2,095 3,881 1,846 17,007 4,398 1,837 10,151 5,792 11,950 2,407 2,514 7,620 1,458 12,461 9,914 7,744 7,948 14,550 6,287
4.93 10.98 0.68 11.46 21.32 7.69 4.97 10.76 13.83 19.10 13.26 1.35 1.69 15.91 5.32 9.13 4.60 4.60 5.13 3.21 4.39 9.43 9.32 8.15 6.39 5.13 9.27 6.46
Targeted 28.1 59.76 39.30 31.80 29.88 30.50 44.29 47.72 42.92 16.10 28.03 29.50 31.40 29.80 20.40 26.05 21.10 25.58 34.74 29.10 40.05 17.20 26.95 16.60 29.53
Depth-first 45.10 62.86 73.20 37.40 29.97 41.10 44.62 49.13 43.37 31.20 47.63 31.80 47.80 32.40 23.18 26.21 31.70 27.43 35.67 36.30 40.33 25.70 26.99 24 36.46
Table 3. Evaluation results: activity and method coverage. could transitively reach from them. We imposed no timeout. Columns 3 and 4 show the dynamic exploration time, 18–236 minutes for Targeted Exploration and 39–239 minutes for Depth-first Exploration. Hence our approach performs systematic exploration efficiently. As expected, Targeted Exploration is faster, even after adding the SATG construction time, because it can fire activity transitions directly (there were two exceptions to this, explained shortly). We believe that these times are acceptable and well worth it, considering the provided benefits: a replayable trace that can be used as basis for dynamic analysis or constructing test cases.
Targeted vs. Depth-first Exploration. While the two exploration techniques implemented in A3 E have similar goals (automated exploration) they have several differences.
Targeted Exploration requires a preliminary static dataflow analysis stage to construct the SATG. However, once the SATG is constructed, targeted exploration is fast, especially if a high number of activities are exportable, hence we can quickly achieve high activity coverage by directly switching to activities. Depth-first Exploration does not require a SATG, but the exploration phase is slower—systematically exercising all GUI elements will prolong exploration. However, this prolonged exploration could be a worthy trade-off since Depthfirst Exploration achieves higher method coverage. We now present some examples that illustrate tradeoffs and shed light on some counterintuitive results. For Advanced Task Killer and ESPN ScoreCenter we attain similar activity coverage but for ESPN ScoreCenter method coverage is significantly lower. The reason for this is app structure:
App
Amazon Mobile Advanced Task Killer Advanced Task Kill. P. BBC News CNN Craigslist Mobile Dictionary.com Dictionary.com Ad Free Dolphin Browser ESPN ScoreCenter Tiny Flashlight + LED Movies by Flixster Gas Buddy IMDb Movies & TV Instant Heart Rate Instant Heart Rate - Pro Pandora internet radio PicSay - Photo Editor PicSay Pro - Photo Ed. Shazam Shazam Encore WeatherBug free WeatherBug Elite YouTube ZEDGE
Mean
Time SATG Targeted Depth-first (seconds) (minutes) (minutes) 222 123 131 39 41 47 24 27 58 68 18 52 14 158 161 43 83 91 66 113 131 45 153 156 595 171 179 42 22 44 52 33 39 53 228 219 157 109 124 107 135 126 56 47 51 50 48 49 92 89 111 36 119 121 40 112 129 64 236 239 248 188 230 120 69 107 119 115 124 200 131 135 124 97 114 74 87 104
Table 4. Evaluation results: time taken by SATG construction and exploration. Note the different units across columns (seconds vs. minutes). ESPN ScoreCenter employs complex activities, i.e., differ-
ent layouts within an activity with more features to use. The Targeted algorithm quickly switches the activities without exploring layout elements in depth, while Depth-first takes longer to exercise the layout elements thoroughly. For the same app structure reason, Targeted exploration finishes significantly faster for Advanced Task Killer Pro and BBC News. Most apps show better activity coverage for Targeted than Depth-first Exploration. This is primarily because they have multiple entry points, or they have activities with intent filters to allow functionality to be invoked from outside the app—starting the exploration from within the app for intentfilter based activities which are not invoked from within the app will fail to discover those activities. For instance, Amazon Mobile has a bar-code search activity which was missed during the Depth-first search, but the Targeted Exploration succeeded to call the activity with the information from the SATG. An exception from this were IMDb Movies & TV and Shazam Encore: both apps have lower activity coverage in Targeted Exploration than Depth-first. After investigation
we found that some activities could be invoked by Targeted Exploration using intent filters with parameters, but Targeted Exploration failed to exercise the activities; this was due to specific input parameters what Targeted exploration failed to produce. The Depth-first search exercised the app as a user would and landed on those particular pages from the right context with correct input parameters, achieving higher coverage. For example the “play trailer” activity in IMDb Movies & TV was not run during Targeted Exploration as it does not have the required parameter, in this case the video file name or location. The exploration times depicted in Table 4 also have some interesting data points. The exploration time largely depends on the size and GUI complexity of the app. Normally, Depth-first Exploration is slower than Targeted because of the switch back (line 14 in Algorithm 2). Two apps, though, Movies by Flixster and IMDb Movies & TV do not conform to this. Upon investigation, we found that activities in these apps form (almost) complete graphs, with many activities being callable from both inside the app or outside the app (but when called from outside, parameters need to be set correctly). Depth-first reached the activities naturally with the correct parameters, whereas Targeted had to back off repeatedly for some activities when attempting to invoke those activities before parameters were properly constructed. 6.2
Automatic Exploration Catalysts and Inhibitors
We now reflect on our experience with the 28 apps and discuss app features that facilitate or hinder exploration via A3 E. The reasons that prevent us from achieving 100% coverage are both fundamental and technical. Fundamental reasons include the presence of activities that cannot be automatically explored due to their nature, and for a good reason. For example, in Amazon Mobile, purchase-related activities could not be explored because server-side validation would be required: to go to the “purchased” state, we would first need to get past the checkout screen where credentials and credit card are verified. Complex gestures and inputs. Our techniques can get good traction for apps built around GUI elements provided by the Android SDK, such as text boxes, buttons, images, text views, list views, check boxes, toggle buttons, spinners, etc. However, some apps rely on complex, app-specific gestures. For example, in the PicSay-Photo Editor app, most of the view elements are custom-designed objects, e.g., artwork and images that are manipulated via specific gestures. Our gesture and sensor libraries (Section 5.3) partially address this limitation. Task switching. Another inhibitor is task switching: if our app under test loses focus, and another app gains focus, we cannot control this second app. For example, if an app invokes the default file browser to a specific file location, the A3 E explorer will stop tracking, because the file browser runs in a different process, and will resume tracking when the app under test regains focus. This is for a good reason,
as part of the Android app isolation policy, but we cannot track GUI events in other apps. Service-providing apps. Some apps can act as service providers by implementing services that run in the background. For example, WeatherBug runs in the background reporting the weather; Advanced Task Killer runs in the background and kills apps which were not accessed for a specific amount of time. Hence for such apps we cannot explore methods that implement background service-providing functionality because they are not reachable from the GUI. Native code. Finally, our static analysis works on Dalvik VM bytecode. If the app uses native code instead of Dalvik bytecode to handle GUI elements, we cannot apply our techniques. For example, the two Angry Birds apps use native Open GL code to manage drawing on the canvas, hence our GUI element extraction does not have access to the native GUI information. We could not explore the Facebook app for the same reason.
7.
Related Work
The work of Rastogi et. al. [10] is most closely related to ours. Their system, named Playground, runs apps in the Android emulator on top of a modified Android software stack (TaintDroid); their end goal was dynamic taint tracking. Their work introduced an automated exploration technique named intelligent execution (akin to our Depth-first Exploration). Intelligent execution involves starting the app, dynamically extracting GUI elements and exploring them (with pruning for some apps to ensure termination) according to a sequencing policy authors have identified works best— explore input events first, then explore action providers such as buttons. They ran Playground on an impressive 3,968 apps and achieved 33% code coverage on average. The are several differences between their approach and A3 E. First, they run the apps on a modified software stack on top of the Android emulator, whereas we run apps on actual phones using an unmodified software stack. The emulator has several limitations [32], e.g., no support for actual calls, USB, Bluetooth, in addition to lacking physical sensors (GPS, accelerometer, camera), which are essential for a complete app experience. Second, Playground, just like our Depth-first Exploration, can miss activities, as Table 4 shows—hence our need for Targeted Exploration which uses static analysis to find all the possible activities and entry points. Third, their GUI element exploration strategy is based on heuristics, ours is depth-first; both strategies have advantages and disadvantages. Fourth, since we ran our experiments on actual phones with unmodified VMs we could not collect instruction coverage, so we cannot directly compare our coverage numbers with theirs. Memon et. al.’s line of work on GUI testing for desktop applications [12–14] is centered around event-based modeling of the application to automate GUI exploration. Their approach models the GUI as an event interaction graph (EIG);
the EIG captures the sequences of user actions that can be executed on the GUI. While the EIG approach is suitable for devising exploration strategies for GUI testing in applications with traditional GUI design, i.e., desktop applications, several factors pose complications when using it for touchbased smartphone apps. First, and most importantly, transitions associated with non-activity elements cannot be easily captured as a graph. There is a rich set of user input features associated with smartphone apps in general (such as gestures—swipes, pinches and zooms) which are not tightly bound to a particular GUI object such as a text box or a button, so there is not always a “current node” as with EIG to determine the next action. For example, if the GUI consists of a widget overlapped on a canvas, each modeled as graphs, then the graph corresponding to the widget and the canvas combined has a set of nodes of size proportional to the product of number of nodes in the widget and canvas graphs; this quickly becomes intractable. Moreover, the next user action can affect the state of the canvas, widget, both, or neither, which again is intractable as it leads to an explosion in the number of edges in the combined graph. For example, activity com.aws.android.lib.location.LocationListActivity in the WeatherBug app contains different layouts, each containing multiple widgets; a horizontal swipe on any widget can change the layout, hence with EIGs we would have to represent this using a bipartite graph with a full set of edges among widgets in the two layouts. Second, as mobility is a core feature of smartphones, smartphone apps are built around multimodal sensors and sensor event streams (accelerometer, compass, GPS); these sensor events can change the state of the GUI, but are not easily captured in the EIG paradigm—many sensors do not exist on desktop systems and their supported actions are far richer than clicks or drags. Modeling such events to permit GUI exploration requires a different scheme compared to EIG; our event library (Section 5.3) and dynamic identification of next possible states allows us to generate multimodal events to permit systematic exploration. Third, Android app GUI state can be changed from outside the app, or by a background service. For example, an outside app can invoke an activity of another app through a system-wide callback which in the EIG model would a spontaneous transition into a node with no incoming edge. The behavior of the callback requests can certainly modify GUI states. Hence creating lists of action sequences that can be executed by a user on an interface will lead to exploring only a subset of GUI states. This is the reason why, while constructing the SATG, we analyze activities that accept intent filters and take appropriate action to design exploration test cases automatically. GUITAR [16] is a GUI testing framework for Java and Windows applications based on EIG. Android GUITAR [17] applies GUITAR to Android by extending Android SDK’s MonkeyRunner tool to allow users to create their own test cases with a point-and-click in-
terface that captures press events. In our approach, test case creation is automated. Yang et. al. [11] implemented a tool for automatic exploration called O RBIT. Their approach uses static analysis on the app’s Java source code to detect actions associated with GUI states and then use a dynamic crawler (built on top of Robotium) to fire the actions. We use static analysis on app bytecode to extract the SATG, as activities are stable, but then use dynamic GUI exploration to cope with dynamic layouts inside activities. They achieved significant statement coverage (63%–91%) on a set of 8 small open source apps; exploration took 80–480 seconds. We focus on a different problem domain: large real-world apps for which the source code is not available, so exploration times and coverage are not directly comparable. Anand et al. [34] developed an approach named ACTE VE for concolic generation of events for testing Android apps whose source code is available. Their focus is on covering branches while avoiding the path explosion problem. ACTE VE generated test inputs for five small open source in 0.3–2.7 hours. Similarly, Jensen et al. [5] have used concolic execution to derive event sequences that can lead to a specific target state in an Android app, and applied their approach to five open source apps (0.4–33KLOC) and show that their approach can reach states that could not be reached using Monkey. Our focus and problem domains are different: GUI and sensor-driven exploration for substantial, popular apps, rather than focusing on covering specific paths. We believe that using concolic execution would allow us to increase coverage (especially method coverage), but it would require a symbolic execution engine robust enough to work on APKs of real-world substantial apps. Monkey [15] is a testing utility provided by the Android SDK that can send a sequence of random and deterministic events to the app. Random events are effective for stress testing and fuzz testing, but not for systematic exploration; deterministic events have to be scripted, which involves effort, whereas in our case systematic exploration is automated. MonkeyRunner [24] is an API provided by the Android SDK which allows programmers to write Python test scripts for exercising Android apps. Similar to Monkey, scripts must be written to explore apps, rather than using automated exploration as we do. Robotium [18] is a testing framework for Android that supports both black-box and white-box testing. Robotium facilitates interaction with GUI components such as menus, toasts, text boxes, etc., as it can discover these elements, fire related events, and generate test cases for exercising the elements. However, it does not permit automated exploration as we do. Troyd [20] is a testing and capture-replay tool built on top of Robotium that can be used to extract GUI widgets, record GUI events and fire events from a script. We used parts of Troyd in our approach. However, Troyd cannot be used
directly for either Targeted or Depth-first Exploration, as it needs input scripts for exercising GUI elements. Moreover, in its unmodified form, Troyd had a substantial performance overhead which slowed down exploration considerably—we had to modify it to reduce the performance overhead. TEMA [41] is a collection of model-based testing tools which have been applied to Android. GUI elements form a state machine and basic GUI events are treated as keywords like events. Within this framework, test scripts can be designed and executed. In contrast, we extract a model either statically or dynamically and automatically construct test cases. Android Ripper [9] is a GUI-based static and dynamic testing tool for Android. It uses a state-based approach to dynamically analyze GUI events and can be used to automate testing by separate test cases. Android Ripper preserves the state of the application where state is actually a tuple of a particular GUI widget and its properties. An input event triggers the change in the state and users can write test scripts based on the tasks that can modify the state. The approach works only on the Android emulator and thus cannot mimic sensor events properly like a real world application. Several commercial tools provide functionality somewhat related to our approach, though their end-goals differ form ours. Testdroid [26] can record and run the tests on multiple devices. Ranorex [27] is a test automation framework. Eggplant [29] facilitates writing automated scripts for testing Android apps. Framework for Automated Software Testing (FAST) [28] can automate the testing process of Android apps over multiple devices. Finally, there exist a variety of static [19, 21, 23, 25] and dynamic [22, 31] analysis tools for Android, though these tools are only marginally related to our work. We apply static analysis for SATG construction but our end goal is not static analysis. However, our replayable traces can fit very well into a dynamic analysis scenario as they provide significant coverage.
8.
Conclusions
We have presented A3 E, an approach and tool that allow Android apps to be explored systematically. We performed a user study that has revealed that users tend to explore just a small set of features when interacting with Android apps. We have introduced Targeted Exploration, a novel technique that leverages static taint analysis to facilitate fast yet effective exploration of Android app activities. We have also introduced Depth-first Exploration, a technique that does not use static analysis, but instead performs a thorough GUI exploration which results in increased method coverage. Our approach has the advantage of permitting exploration without requiring the app source code. Through experiments on 25 popular Android apps, we have demonstrated that our techniques can achieve substantial coverage increases. Our
approach can serve as basis for a variety of dynamic analysis and testing tasks.
[13] Xun Yuan and Atif M. Memon. Using GUI Run-Time State as Feedback to Generate Test Cases. In ICSE ’07, pages 396-405.
Acknowledgments
[14] Atif M. Memon. An event-flow model of GUI-based applications for testing. In Software Testing, Verification and Reliability, 2007, pages 137-157.
We thank Lorenzo Gomez, Gavin Huang, Shashank Reddy Kothapalli, and Xuetao Wei for their assistance with the user study; Steve Suh and Jinseong Jeon for their valuable suggestions on the implementation; and the anonymous referees for their helpful comments. This research was supported in part by NSF grant CNS-1064646.
References [1] Gartner. Inc. Gartner Says Worldwide PC Shipment Growth Was Flat in Second Quarter of 2012. July, 2012. URL http://www.gartner.com/it/page.jsp?id=2079015. [2] Gartner. Inc. Gartner Highlights Key Predictions for IT Organizations and Users in 2010 and Beyond. January, 2010. URL http://www.gartner.com/it/page.jsp?id= 1278413. [3] IDC. Android and iOS Surge to New Smartphone OS Record in Second Quarter, According to IDC. August, 2012. URL http://www.idc.com/getdoc.jsp?containerId= prUS23638712. [4] CNET. Android reclaims 61 percent of all U.S. smartphone sales. May, 2012. URL http://news.cnet.com/8301-1023_3-57429192-93/ android-reclaims-61-percent-of-all-u. s-smartphone-sales/. [5] Casper S Jensen, M. R. Prasad, and A. Møller. Automated testing with targeted event sequence generation. In Proceedings of the 2013 International Symposium on Software Testing and Analysis, pages 67-77. [6] C. Hu and I. Neamtiu. Automating GUI testing for Android applications. In AST ’11, pages 77-83. [7] L. Gomez, I. Neamtiu, T.Azim, and T. Millstein. RERAN: Timing- and Touch-Sensitive Record and Replay for Android. In ICSE ’13. [8] Jessica Guyn. Facebook users give iPhone app thumbs down. In Los Angeles Times. July, 2011. URL http: //latimesblogs.latimes.com/technology/2011/07/ facebook-users-give-iphone-app-thumbs-down.html, July 21.
[15] Android Developers. UI/Application Exerciser Monkey. August, 2012. URL http://developer.android.com/ tools/help/monkey.html. [16] Atif Memon. GUITAR. August, 2012. URL guitar. sourceforge.net. [17] Atif Memon. Android GUITAR. August, 2012. URL http: //sourceforge.net/apps/mediawiki/guitar/index. php?title=Android_GUITAR. [18] Google Code. Robotium. August, 2012. URL http: //code.google.com/p/robotium/. [19] SONY. APK Analyzer. January, 2013. URL http://developer.sonymobile.com/knowledge-base/ tool-guides/analyse-your-apks-with-apkanalyser/. [20] J. Jeon and J. S. Foster. Troyd: Integration Testing for Android. Technical Report CS-TR-5013, Department of Computer Science, University of Maryland, College Park, August 2012. [21] Google Code. Androguard. January, 2013. URL http: //code.google.com/p/androguard/. [22] Google Code. Droidbox. January, 2013. URL http: //code.google.com/p/droidbox/. [23] Google Code. Android Assault. January, 2013. URL http://code.google.com/p/android-assault/. [24] Android Developers. MonkeyRunner. August, 2012. URL http://developer.android.com/guide/developing/ tools/monkeyrunner_concepts.html. [25] Various Authors. SCanDroid. January, 2013. https://github.com/scandroid/scandroid.
URL
[26] Bitbar. Automated Testing Tool for Android - Testdroid. January, 2013. URL http://testdroid.com/. [27] Ranonex. Android Test Automation - Automate your App Testing. January, 2013. URL http: //www.ranorex.com/mobile-automation-testing/ android-test-automation.html. [28] W. River. Wind River Framework for Automated Software Testing. January, 2013. URL http://www.windriver.com/ announces/fast/.
[9] Domenico Amalfitano, Anna Rita Fasolino and Salvatore De. Using GUI Ripping for Automated Testing of Android Applications. In ASE’2012, pages 258-261.
[29] TestPlant. eggPlant for mobile testing.. January, 2013. URL http://www.testplant.com/products/eggplant/ mobile/.
[10] Vaibhav Rastogi, Yan Chen and William Enck. AppsPlayground: automatic security analysis of smartphone applications. In CODASPY’2013, pages 209-220.
[30] Pamela Bhattacharya, Liudmila Ulanova, Iulian Neamtiu and Sai Charan Koduru. An Empirical Analysis of the Bug-fixing Process in Open Source Android Apps. In CSMR’13.
[11] Wei Yang, Mukul Prasad and Tao Xie. A Grey-box Approach for Automated GUI-Model Generation of Mobile Applications. In FASE’13, pages 250-265.
[31] W. Enck, P. Gilbert, B. G. Chun, L. P. Cox, J. Jung, P. McDaniel, and A. N. Sheth. Taintdroid: An information-flow tracking system for realtime privacy monitoring on smartphones. In OSDI, 2010, pages 393-407.
[12] Xun Yuan and Atif M. Memon. Generating Event SequenceBased Test Cases Using GUI Run-Time State Feedback. In IEEE Transactions on Software Engineering, 2010, pages 81-95.
[32] Android Developers. Android Emulator Limitations. March, 2013. URL http://developer.android.com/tools/
devices/emulator.html#limitations. [33] Android Developers. Android Intents. March, 2013. URL http://developer.android.com/reference/android/ content/Intent.html. [34] S. Anand, M. Naik, M. J. Harrold, and H. Yang. Automated concolic testing of smartphone apps. In FSE ’12, pages 1-11. [35] M. B¨ohmer, B. Hecht, J. Sch¨oning, A. Kr¨uger, and G. Bauer. Falling asleep with Angry Birds, Facebook and Kindle: a large scale study on mobile application usage. In MobileHCI ’11, pages 47-56. [36] B. Cornelissen, A. Zaidman, A. van Deursen, L. Moonen, and R. Koschke. A Systematic Survey of Program Comprehension through Dynamic Analysis. In Software Engineering, IEEE Transactions on, 2009, pages 684-702. [37] Michael D. Ernst. Static and dynamic analysis: Synergy and duality. In WODA 2003: Workshop on Dynamic Analysis, May 9, pages 24-27.
[38] S. Hao, D. Li, W. Halfond, and R. Govindan. Estimating Android applications’ CPU energy usage via bytecode profiling. In Green and Sustainable Software (GREENS), 2012 First International Workshop on, 2012, pages 1-7. [39] M. Dong and L. Zhong. Self-constructive high-rate system energy modeling for battery-powered mobile systems. In MobiSys ’11, pages 335-348. [40] X. Wei, L. Gomez, I. Neamtiu, and M. Faloutsos. ProfileDroid: multi-layer profiling of android applications. In Mobicom ’12, pages 137-148. [41] T. Takala, M. Katara, and J. Harty. Experiences of systemlevel model-based GUI testing of an Android application. In ICST ’11, pages 377-386.
Appendix
_HomeWwActivity 1 _PersonalisationActivity 3
9 1
8
1
1
4
2
7
_VideoActivity 3 10
_ArticleActivity
24 3 4 5
5 2
3
1 4
_AudioControlActivity
5 6 8
_SettingsActivity 12 6 11
_RemoteInfoViewActivity 7
bbc_mobile_news_ReportActivity
Figure 7. Dynamic Activity Transition Graph for the BBC News app, constructed based on runs from 5 different users: colors represent users and labels on the edges represent the sequence in which the edges are explored.
App Amazon Mobile Angry Birds Angry Birds Space Premium BBC News Advanced Task Killer Advanced Task Killer Pro CNN Craigslist Mobile Dictionary.com Dictionary.com Ad-free Dolphin Browser ESPN ScoreCenter Facebook Tiny Flashlight + LED Movies by Flixster Gas Buddy IMDb Movies & TV Instant Heart Rate Instant Heart Rate - Pro Pandora internet radio PicSay - Photo Editor PicSay Pro - Photo Editor Shazam Shazam Encore WeatherBug WeatherBug Elite YouTube ZEDGE
total # 39 8 1 10 7 6 42 17 22 15 56 5 107 6 68 38 39 17 17 32 10 10 38 38 29 28 18 34
Activities excluding ads 36 1 1 10 6 6 39 15 18 15 56 5 107 4 67 33 37 14 16 30 10 10 37 37 24 28 18 34
User 1 18 100 100 70 28.6 50 19.05 23.5 41 33.33 12.5 60 5.60 50 8.8 29 25.64 23.5 11.8 9.4 10 10 5.3 15.8 27.6 10.71 11.11 35.29
User 2 13 100 100 20 43 33.33 9.5 35.3 41 60 8.9 40 2.8 50 14.7 29 15.4 29.4 17.65 9.4 10 30 15.8 21 24.13 14.3 11.11 29.41
Activity coverage (%) User 3 User 4 User 5 15.4 10.26 13 100 100 100 100 100 100 30 43 28.6 28.6 50 16.66 16.66 14.29 12 12 41.2 23.5 29.4 59 32 41 53.33 20 20 1.78 1.78 1.78 20 20 20 4.67 4.67 6.54 50 50 50 5.9 13.2 8.8 23.6 21 29 15.4 29.4 23.5 23.5 11.8 11.8 11.8 12.5 12.5 12.5 10 10 10 10 10 10 5.3 5.3 5.3 21 8 8 20.7 20.7 20.7 14.28 7.14 7.14 11.11 11.11 11.11 32.35 29.41 20.58
User 6 25.64 100 100 70 28.6 16.66 19 29.4 59 73.33 1.78 20 3.73 50 20.6 26 20.5 23.5 11.8 9.4 10 10 5.3 10.5 20.7 3.57 11.11 11.76
User 7 13 100 100 20 57 33.33 14.29 35.3 41 33.33 1.78 20 3.73 66.67 7.3 15.8 12.8 23.5 11.8 12.5 10 10 8 10.5 27.6 3.57 27.77 23.52
Table 5. Activity count and coverage. User 1 has explicitly tried to achieve high coverage, while 2–7 are “regular” users.
App
Amazon Mobile Angry Birds Angry Birds Space Premium BBC News Advanced Task Killer Advanced Task Killer Pro CNN Craigslist Mobile Dictionary.com Dictionary.com Ad-free Dolphin Browser ESPN ScoreCenter Facebook Tiny Flashlight + LED Movies by Flixster Gas Buddy IMDb Movies & TV Instant Heart Rate Instant Heart Rate - Pro Pandora internet radio PicSay - Photo Editor Shazam Shazam Encore WeatherBug WeatherBug Elite YouTube ZEDGE
Method count
External packages
App specific method count
13151 12245 12953 4918 525 257 13029 2765 4664 2199 23701 5511 34883 2121 12476 7841 19781 3044 3044 13704 1580 22071 22071 9581 9688 19902 8308
5 4 4 1 0 4 11 4 6 4 6 5 12 3 8 4 9 5 5 7 0 13 9 10 8 10 11
7154 6176 7402 427 257 3836 7725 2095 2784 1272 13800 4398 21896 1578 7490 5792 8463 2002 1927 7620 1580 9884 9914 7948 8194 11125 6287
Method coverage (%) User 1 4.21 10.81 0.68 11.46 19.26 3.96 4.86 6.88 0.97 18.64 13.26 0.55 1.67 15.59 3.53 7.38 4.60 2.69 6.49 2.88 2.97 9.40 6.92 3.70 5.06 4.85 6.96
User 2 1.36 10.27 0.33 6.52 17.51 3.18 4.72 5.78 0.97 17.55 9.98 0.45 1.61 15.85 3.30 5.51 1.78 8.44 7.79 2.01 3.04 7.61 6.52 8.02 4.24 5.01 3.00
Table 6. Method count and coverage.
User 3 3.93 10.37 0.37 4.92 16.73 2.77 4.12 8.78 5.96 15.33 10.06 0.23 1.64 4.81 4.60 3.82 0.98 1.35 6.43 1.44 2.66 5.23 6.72 3.11 6.36 2.04 4.82
User 4 1.64 10.98 0.63 9.37 14.01 4.44 3.10 10.86 15.65 7.54 0.28 1.48 13.68 4.66 7.84 3.30 2.07 2.07 2.59 8.46 6.66 3.82 3.41 3.08 6.44
User 5 4.93 10.94 0.42 10.30 16.34 1.89 9.27 12.31 17.37 3.95 0.28 1.59 0.70 2.86 5.52 2.30 1.14 3.24 4.37 7.93 6.99 4.52 6.12 3.86 7.32
User 6 3.99 10.43 0.31 11.24 18.29 3.47 4.44 10.07 4.64 18.08 4.17 1.04 1.56 15.85 3.41 3.53 0.89 3.60 6.54 2.75 1.39 8.89 7.03 3.93 5.89 2.83 8.44
User 7 2.92 10.17 0.19 11.00 16.54 7.69 4.44 10.69 11.02 15.80 11.15 1.20 1.53 15.05 4.68 5.31 0.47 4.90 7.84 2.18 2.97 6.25 9.24 5.75 3.83 5.12 5.75