Tcf3 is an integral component of the core regulatory circuitry of embryonic stem cells Megan F. Cole,1,2,3 Sarah E. Johnstone,1,2,3 Jamie J. Newman,1,2,3 Michael H. Kagey,1 and Richard A. Young1,2,4 1
Whitehead Institute for Biomedical Research, Cambridge, Massachusetts 02142, USA; 2Department of Biology, Massachusetts Institute of Technology, Cambridge, Massachusetts 02139, USA
Embryonic stem (ES) cells have a unique regulatory circuitry, largely controlled by the transcription factors Oct4, Sox2, and Nanog, which generates a gene expression program necessary for pluripotency and self-renewal. How external signals connect to this regulatory circuitry to influence ES cell fate is not known. We report here that a terminal component of the canonical Wnt pathway in ES cells, the transcription factor T-cell factor-3 (Tcf3), co-occupies promoters throughout the genome in association with the pluripotency regulators Oct4 and Nanog. Thus, Tcf3 is an integral component of the core regulatory circuitry of ES cells, which includes an autoregulatory loop involving the pluripotency regulators. Both Tcf3 depletion and Wnt pathway activation cause increased expression of Oct4, Nanog, and other pluripotency factors and produce ES cells that are refractory to differentiation. Our results suggest that the Wnt pathway, through Tcf3, brings developmental signals directly to the core regulatory circuitry of ES cells to influence the balance between pluripotency and differentiation. [Keywords: Wnt pathway; embryonic stem cells; Tcf3; regulatory circuitry] Supplemental material is available at http://www.genesdev.org. Received December 12, 2007; revised version accepted January 18, 2008.
Embryonic stem (ES) cells provide a unique opportunity to study early development and hold great promise for regenerative medicine (Thomson et al. 1998; Reubinoff et al. 2000; Pera and Trounson 2004). ES cells are derived from the inner cell mass of the developing blastocyst, and can be propagated in culture in an undifferentiated state while maintaining the capacity to generate any cell type in the body. Discovering how signaling pathways and transcriptional regulatory circuitry contribute to self-renewal and pluripotency is essential for understanding early development and realizing the therapeutic potential of ES cells. A model for the core transcriptional regulatory circuitry of ES cells has emerged from studying the target genes of the ES cell transcription factors Oct4, Sox2, and Nanog (Boyer et al. 2005; Loh et al. 2006). These master regulators occupy the promoters of active genes encoding transcription factors, signal transduction components, and chromatin-modifying enzymes that promote ES cell self-renewal. They also occupy the promoters of a large set of developmental transcription fac-
3
These authors contributed equally to this work. Corresponding author. E-MAIL
[email protected]; FAX (617) 258-9872. Article is online at http://www.genesdev.org/cgi/doi/10.1101/gad.1642408. 4
746
tors that are silent in ES cells, but whose expression is associated with lineage commitment and cellular differentiation. Polycomb Repressive Complexes co-occupy the genes encoding these developmental transcription factors to help maintain a silent transcriptional state in ES cells (Boyer et al. 2006; Lee et al. 2006; Wilkinson et al. 2006; Rajasekhar and Begemann 2007; Stock et al. 2007). External signals can promote ES cell pluripotency or cause these cells to differentiate, but precisely how these pathways are connected to the ES cell regulatory network has not been determined. These signals are produced by the stem cell niche in the developing blastocyst or, for cultured ES cells, can be produced by added factors or serum to maintain stem cell identity or promote differentiation. Recent studies have demonstrated the importance of several signaling pathways in maintaining or modifying ES cell state, including the Activin/Nodal, Notch, BMP4, and Wnt pathways (Rao 2004; Boiani and Scholer 2005; Friel et al. 2005; Kristensen et al. 2005; Valdimarsdottir and Mummery 2005; Dreesen and Brivanlou 2007; Pan and Thomson 2007). By understanding how these signaling pathways influence the gene expression program of ES cells, it should be possible to discover how they contribute to ES cell identity or promote specific differentiation programs.
GENES & DEVELOPMENT 22:746–755 © 2008 by Cold Spring Harbor Laboratory Press ISSN 0890-9369/08; www.genesdev.org
Tcf3 in core ES cell circuitry
The Wnt/-catenin signaling pathway has multiple roles in ES cell biology, development, and disease (Logan and Nusse 2004; Reya and Clevers 2005; Clevers 2006). Several studies have shown that activation of the Wnt pathway can cause ES cells to remain pluripotent under conditions that induce differentiation (Kielman et al. 2002; Sato et al. 2004; Hao et al. 2006; Ogawa et al. 2006; Singla et al. 2006; Miyabayashi et al. 2007; Takao et al. 2007), while other studies have shown that the Wnt pathway has an important role in directing differentiation of ES cells (Otero et al. 2004; Lindsley et al. 2006). Recent studies have shown that T-Cell Factor-3 (Tcf3), a terminal component of the Wnt pathway, acts to repress the Nanog gene in ES cells (Pereira et al. 2006), providing an important clue for at least one mechanism by which the Wnt pathway regulates stem cell state. Nonetheless, we have an incomplete understanding of how the pathway exerts its effects, in part because few target genes have been identified for its terminal components in ES cells. Stimulation of the canonical Wnt signaling pathway causes the transcriptional coactivator -catenin to translocate to the nucleus, where it interacts with constitutively DNA-bound Tcf/Lef proteins to activate target genes (Behrens et al. 1996; Brantjes et al. 2001; Cadigan 2002). Tcf3, a member of the Tcf/Lef family, is highly expressed in murine ES (mES) cells, and is critical for early embryonic development (Korinek et al. 1998; Merrill et al. 2004; Pereira et al. 2006). To determine how the Wnt pathway is connected to the gene expression program of ES cells, we determined the genome-wide binding profile of Tcf3 and examined how perturbations of the pathway affect the gene expression program. Remarkably, the genome-wide data reveal that Tcf3 co-occupies the ES cell genome with the pluripotency transcription factors Oct4 and Nanog. These and other results reveal that the Wnt pathway brings developmental signals directly to the core regulatory circuitry of ES cells, which consists of the pluripotency transcription factors and Tcf3, together with their mutual target genes.
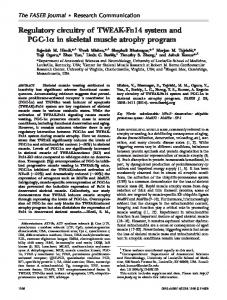
Results Identification of Tcf3-binding sites genome-wide To determine how the Wnt pathway regulates the gene expression program of mES cells, we first identified genes occupied by Tcf3. mES cells were grown under standard conditions (Supplemental Fig. S1) and DNA sequences occupied by Tcf3 were identified using chromatin immunoprecipitation (ChIP) combined with DNA microarrays (ChIP–Chip). For this purpose, DNA microarrays were designed with 60-mer oligonucleotide probes tiling the entire nonrepeat portion of the mouse genome. The results revealed that Tcf3 occupies >1000 murine promoters (Supplemental Table S1), including those of the known Wnt targets Axin2 and Myc (Fig. 1A; He et al. 1998; Yan et al. 2001; Jho et al. 2002).
Figure 1. Tcf3, Oct4, and Nanog co-occupy the genome in mouse ES cells. (A) Tcf3 binds to known target genes. Examples of previously known Tcf3-bound regions are displayed as unprocessed ChIP-enrichment ratios for all probes within the chromosomal region indicated below the plot. The gene is depicted below the plot, and the TSS and direction are denoted by an arrow. (B) Tcf3, Oct4, and Nanog display nearly identical binding profiles. Analysis of ChIP–chip data from genes bound by Tcf3, Oct4, or Nanog reveals that the three factors bind to similar genomic regions at all promoters. Regions from −8 kb to +2 kb around each TSS were divided into bins of 250 bp. The raw enrichment ratio for the probe closest to the center of the bin was used. If there was no probe within 250 bp of the bin center then no value was assigned. For genes with multiple promoters, each promoter was used for analysis. The analysis was performed on 3764 genes, which represents 4086 promoters. Promoters are organized according to the distance between the maximum Tcf3-binding ratio and the TSS. (C) Tcf3, Oct4, and Nanog bind in close proximity at target genes. Plots display unprocessed ChIP-enrichment ratios for all probes within the chromosomal region indicated below the plot. The gene is depicted below the plot, and the TSS and direction are denoted by an arrow.
Tcf3 Co-occupies the genome with ES cell master regulators Inspection of the genes occupied by Tcf3 revealed a large set that were previously shown to be bound by the ho-
GENES & DEVELOPMENT
747
Cole et al.
meodomain transcription factor Oct4 (Boyer et al. 2005; Loh et al. 2006), which is an essential regulator of early development and ES cell identity (Nichols et al. 1998; Hay et al. 2004). To examine the overlap of gene targets more precisely, we carried out ChIP–Chip experiments with antibodies directed against Oct4 in mES cells and used the same genome-wide microarray platform employed in the Tcf3 experiment. Remarkably, the binding profiles of Tcf3 and Oct4 revealed that they bind the same genomic regions and display identical spatial distribution patterns with regard to transcription start sites (TSSes) (Fig. 1B; Supplemental Fig. S2). These results identified a set of 1224 genes that are co-occupied by Tcf3 and Oct4 at high confidence (Supplemental Table S1) and suggested that the Wnt pathway connects directly to genes regulated by Oct4 through Tcf3. Previous studies in human ES cells have shown that Oct4 shares target genes with the transcription factors Nanog and Sox2 (Boyer et al. 2005), suggesting that Tcf3occupied genes in mES cells should also be occupied by Nanog and Sox2. Additional genome-wide ChIP–Chip experiments with antibodies directed against Nanog revealed that it does indeed bind the same sites occupied by Oct4 and Tcf3 (Figs. 1B,C, 2; Supplemental Fig. S2). The fact that Oct4 and Sox2 form heterodimers in ES cells (Dailey and Basilico 2001; Okumura-Nakanishi et al. 2005) and frequently co-occupy promoters in human ES cells (Boyer et al. 2005) makes it likely that Tcf3 co-occupies much of the genome with Oct4, Nanog, and Sox2. The observation that Tcf3 co-occupies much of the genome with the ES cell pluripotency transcription factors has a number of implications for the regulatory circuitry of these cells. Tcf3 binds its own promoter as well as the promoters of genes encoding Oct4, Sox2, and Nanog (Fig. 2). Thus, Tcf3 is an integral component of an interconnected autoregulatory loop, where all four transcription factors together occupy each of their own promoters (Fig. 3A). This feature of ES cell regulatory circuitry was described previously for Oct4, Sox2, and Nanog alone (Boyer et al. 2005), and has been postulated
Figure 2. Tcf3, Oct4, and Nanog bind the promoters of Tcf3, Oct4, Sox2, and Nanog. Plots display unprocessed ChIP-enrichment ratios for all probes within the chromosomal region indicated below the plot. The gene is depicted below the plot, and the TSS and direction are denoted by an arrow.
748
GENES & DEVELOPMENT
to be a common regulatory motif for master regulators of cell state (Chambers et al. 2003; Odom et al. 2004, 2006; Okumura-Nakanishi et al. 2005; Rodda et al. 2005). Autoregulation is thought to provide several advantages to the control of cell state, including reduced response time to environmental stimuli and increased stability of gene expression (McAdams and Arkin 1997; Thieffry et al. 1998; Rosenfeld et al. 2002; Shen-Orr et al. 2002). It is also notable that Tcf3 and the pluripotency transcription factors together occupy genes encoding many Wnt pathway components (Supplemental Fig. S3), suggesting that this transcription factor regulates much of its own signaling pathway apparatus together with the pluripotency factors. A model for the core regulatory circuitry of ES cells has been proposed in which the genes bound by the master regulators Oct4, Sox2, and Nanog fall into two classes: transcriptionally active genes encoding transcription factors, signaling components, and other products that support the stem cell state; and transcriptionally inactive genes, consisting mostly of developmental regulators, where Polycomb is bound and RNA polymerase II is recruited, but transcription is stalled (Boyer et al. 2005, 2006; Lee et al. 2006; Guenther et al. 2007; Stock et al. 2007; Zeitlinger et al. 2007). Our results reveal that Tcf3, together with the pluripotency regulators, is associated with both classes of genes, and thus provide a modified model of the core regulatory circuitry of ES cells (Fig. 3B). The association of Tcf3 with the set of genes encoding key transcription factors, signaling pathway components, and developmental regulators suggests that the Wnt signaling pathway contributes to the regulation of these genes, thereby impacting ES pluripotency and self-renewal. Expression analysis of Tcf3 knockdown in mES cells Genes bound by Tcf/Lef proteins are thought to be repressed in the absence of Wnt/-catenin signaling and to be activated upon Wnt pathway stimulation (Behrens et al. 1996; Cavallo et al. 1998; Brantjes et al. 2001; Daniels
Tcf3 in core ES cell circuitry
Figure 3. Tcf3 is an integral component of the core regulatory circuitry of ES cells. (A) Tcf3 forms an interconnected autoregulatory loop with Oct4, Sox2, and Nanog. Proteins are represented by ovals and genes are indicated by rectangles. (B) Model showing a key portion of the regulatory circuitry of mES cells where Oct4, Sox2, Nanog, and Tcf3 occupy both active and silent genes. The evidence that Oct4, Nanog, and Tcf3 occupy these genes is described here; Sox2 occupancy is inferred from previous studies in human ES cells (Boyer et al. 2005). Evidence that the transcriptionally silent genes are occupied by Polycomb Repressive Complexes is from Boyer et al. (2006), and unpublished data and that these genes have stalled RNA polymerases is from Guenther et al. (2007) and Stock et al. (2007). Proteins are represented by ovals and genes are indicated by rectangles.
and Weiss 2005; Miyabayashi et al. 2007). mES cells have low endogenous Wnt activity in standard culture conditions, and the Wnt pathway can be further stimulated in culture (Supplemental Fig. S4; Dravid et al. 2005; Yamaguchi et al. 2005; Lindsley et al. 2006; Ogawa et al. 2006; Anton et al. 2007; Takao et al. 2007). Thus, it is unclear
whether Tcf3-occupied genes are being repressed or activated at the low level of Wnt activity characteristic of standard ES cell culture conditions. To investigate whether the effect of Tcf3 occupancy is to repress or to activate genes, RNAi constructs were used to deplete Tcf3 mRNA in mES cells in two independent experiments (Supplemental Fig. S5) and changes in global mRNA levels were assayed with DNA microarrays (Fig. 4A). The ∼3.5% of mouse genes whose mRNA levels changed by at least twofold were significantly enriched for Tcf3 targets relative to genes whose expression was unaltered by the Tcf3 knockdown (P-value < 2 × 10⁻¹⁰) (Supplemental Fig. S6; Supplemental Table S2). The genes whose expression increased upon loss of Tcf3 included those encoding the master regulators Oct4, Sox2, and Nanog, other genes involved in pluripotency such as Lefty2 and Nodal, and the Wnt pathway component Dkk1 (Fig. 4A). The fact that up-regulated genes are strongly enriched for Tcf3 binding suggests that Tcf3 mainly acts to repress genes. Upon loss of Tcf3, target genes are no longer repressed and can now be activated by other factors (such as Oct4, Sox2, and Nanog) present at their promoters. While expression of Tcf3 target genes was often upregulated upon loss of Tcf3, the expression of a substantial number of Tcf3-bound genes remained unchanged, and a relatively small number of Tcf3-bound genes showed reduced expression (Fig. 4A). Nearly half of the genes occupied by Tcf3, Oct4, and Nanog are co-occupied by Polycomb Repressive Complexes (Boyer et al. 2006; Lee et al. 2006; Wilkinson et al. 2006; Rajasekhar and Begemann 2007), and their transcriptional state would not be expected to change as Polycomb would prevent elongation of transcripts at these genes (Stock et al. 2007). Indeed, we find that expression of genes occupied by Tcf3 and Polycomb do not show a significant expression change upon loss of Tcf3 (P-value > 0.4). There were some Tcf3 target genes whose expression was down-regulated upon loss of Tcf3; because mES cells have a low level of Wnt pathway activation, it is possible that sufficient -catenin enters the nucleus in order to associate with and activate this subset of genes. Indeed, we found that some amount of -catenin does associate with Tcf3 and Oct4, as -catenin can be detected in cross-linked chromatin extracts immunoprecipitated for either Tcf3 or Oct4 (Supplemental Fig. S7). It is also possible that the loss of expression of this set of Tcf3 target genes is a secondary consequence of the knockdown. The repressive activity of Tcf3 appears to be its dominant function for most genes under these conditions, as the set of Tcf3-bound genes were found to have a significantly higher increase in expression upon knockdown compared with all genes (P-value < 7 × 10⁻⁵) (Fig. 4A). Expression analysis of Wnt pathway activation in mES cells We next studied the effect of increased stimulation of the Wnt pathway on Tcf3 target genes in mES cells. Cells were treated with Wnt3a conditioned media in (CM) two
GENES & DEVELOPMENT
749
Cole et al.
Figure 4. Knockdown of Tcf3 and activation of the Wnt pathway in mES cells reveal a role for Tcf3 in repression of target genes and a role in regulating pluripotency. (A) Tcf3 knockdown results in up-regulation of target genes. The effect of Tcf3 knockdown on gene expression was measured by hybridization of labeled RNA prepared from Tcf3 knockdown cells against RNA prepared from cells infected with nonsilencing control lentivirus at 48 h post-infection. A heat map of biological replicate data sets of expression changes was generated where genes are ordered according to average expression change. Tcf3 target genes have a higher average expression change than the average for all genes upon knockdown of Tcf3. (B) Wnt CM results in up-regulation of Tcf3 target genes. The effect of Wnt activation on gene expression was measured by hybridization of labeled RNA prepared from mES cells grown in Wnt CM against RNA prepared from cells grown in mock CM. A heat map of biological replicate data sets of expression change upon addition of Wnt CM where genes are ordered according to average expression change of replicates. Tcf3 target genes have a higher average expression change than the average for all genes upon addition of Wnt CM. (C) Tcf3 knockdown results in increased expression of Oct4, Sox2, and Nanog. Real-time PCR demonstrates that Oct4, Sox, and Nanog have increased expression upon knockdown of Tcf3. Values are normalized to Gapdh transcript levels, and fold change is relative to cells transfected with a nonsilencing hairpin. (D) Tcf3 knockdown results in increased staining for Oct4 and Nanog. Immunofluorecence was performed on mES cells grown one passage off of feeders that were either infected with Tcf3 knockdown lentivirus or infected with nonsilencing control lentivirus. Cells were fixed with 4% paraformaldehyde 96 h post-infection. Cells were stained with Oct4, Nanog, and DAPI. Images for Oct4 and Nanog staining were taken at 40× magnification and an exposure time of 300 msec. Tcf3 KD 1 and KD 2 represent different knockdown hairpin constructs. Tcf3 KD 2 is the virus also used in A, C, E, and F. (E) Tcf3 knockdown results in a significant increase of Oct4 staining. Quantification of Oct4 staining was performed in cells infected with Tcf3 or Gfp knockdown virus. (F) Tcf3 knockdown cells proliferate over more passages in the absence of LIF. Relative cell numbers of ES cells transfected with Tcf3 or control virus through multiple passages off of feeders in the presence or absence of LIF. Identical cell numbers were initially plated, and cells were split 1:12 every 2–3 d. Cells were counted at each passage and values for cells grown in the absence of LIF were normalized to cells grown in the presence of LIF.
independent experiments, and changes in global mRNA levels were assayed with DNA microarrays (Fig. 4B). The