Second, we show how TCP can utilize the proposed timer framework to reduce ... are simulated by executing its actual protocol implementation code, rather than ...
TCP: Improving Startup Dynamics by Adaptive Timers and Congestion Control Mohit Aron
Peter Druschel TR98-318 Department of Computer Science Rice University
Abstract
This paper studies the startup dynamics of TCP on both high as well as low bandwidthdelay network paths and proposes a set of enhancements that improve both the latency as well as throughput of relatively short TCP transfers. Numerous studies have shown that the timer and congestion control mechanisms in TCP can have a limiting e�ect on performance in the startup phase. Based on the results of our study, we propose mechanisms for adapting TCP in order to yield increased performance. First, we propose a framework for the management of timing in TCP. Second, we show how TCP can utilize the proposed timer framework to reduce the overly conservative delay associated with a retransmission timeout. Third, we propose the use of packet pacing in the initial slow-start to improve the performance of relatively short transfers that characterize the web tra�c. Finally, we quantify the importance of estimating the initial slow-start threshold in TCP, specially on high bandwidth-delay paths.
1 Introduction As new network technologies emerge and transform the Internet, the TCP (Transmission Control Protocol) is being evolved to cope with new operating conditions and performance demands. For instance, extensions like large windows [4], selective acknowledgements [20], PAWS (protection agains wrapped sequence numbers) [4] and the timestamp option [4] are being incorporated in TCP to maintain correct operation and high performance on the evolving Internet. This paper studies the startup dynamics of TCP on both high as well as low bandwidth-delay network paths and proposes a set of enhancements that improve both the latency as well as throughput of relatively short TCP transfers. The term high bandwidth-delay path is intended for those network paths the product of whose bandwidth and round trip propagation delay is of the order of two orders of magnitude larger than the MTU (maximum transmission unit) supported by the network. Numerous studies have shown that the timer and congestion control mechanisms in TCP can have a limiting e�ect on performance in some network environments, specially in the startup phase. The coarse-grained clock1 used for measuring round-trip time 1
4.4BSD TCP uses a 500ms clock for measuring RTT and scheduling timeouts
1
2 (RTT) and scheduling retransmission timeouts (RTO) in the BSD based implementations of TCP has been shown to a�ect both latency as well as throughput [6, 5, 14, 19]. The slow-start congestion control mechanism [16] has been found to be slow in lling the network pipe [21, 12, 1] and a�ects the performance of short transfers that typically nish during the initial slow-start. Throughout this paper, the term pipe size is intended to be synonymous with the product of the available bandwidth2 and the round-trip time observed when there is no queuing at the routers. In this paper, we propose enhancements to the TCP timer and slow-start mechanisms that adapt TCP for providing better performance during startup. Firstly, we propose a framework that decouples the timing algorithms in TCP from the event scheduling facilities provided by the operating system, viewing the latter as a service that TCP tries to adaptively use to its best possible advantage. Secondly, we show how this framework can be utilized by TCP to achieve a reduction in the long delays associated with a timeout. Thirdly, we show how the performance of the slow-start mechanism in TCP can be improved by using the event scheduling service to pace packets. Finally, we quantify the impact of estimating the slow-start threshold (ssthresh) [14] on the startup TCP performance in high bandwidth-delay networks. The remainder of this paper is organized as follows. The simulation environment used to obtain the results presnted in this paper is described in Section 2. In Section 3, we show simulation results that demonstrate performance problems that TCP su�ers in certain network enviroments. Section 4 presents a new framework for managing TCP timers and time measurement that allows TCP to make use of improved timing facilities available in many modern host environments. Section 4.2 presents our enhanced slowstart mechanism, which takes advantage of the time framework in order to pace packets, thus a�ording higher performance for short transfers over network paths with high bandwidth-delay products. A detailed simulation-based performance evaluations of the proposed mechanisms is given in Section 5. Related work is discussed in Section 6 and in Section 7 we summarize our conclusions.
2 Simulation Environment This section describes the simulation environment used in our study. All simulations were done using the x-sim network simulator [7], which is based on the x-kernel [15]. x-sim is an execution-driven network simulator, where the actions of network protocols are simulated by executing its actual protocol implementation code, rather than an abstract behavioral model of the protocol. x-sim supports multiple hosts, each running a full protocol stack, and several abstract link behaviours (point-to-point and ethernet links). The routers are modelled as network nodes that supports a particular queuing Available bandwidth indicates how fast a connection should transmit data to preserve network stability while bottleneck bandwidth gives an upper bound on how fast a connection can possibly transmit data [22]. 2
3 D1
S1 100Mb/s
100Mb/s
S2
D1
S1 D2
1.5Mbps R1
155Mb/s
R1
R2 30ms
10Mbps Ethernet R2
10Mbps Ethernet
S7
D7 S8
D8
Figure 1: High Speed WAN
S2
D2
Figure 2: Low Speed Network
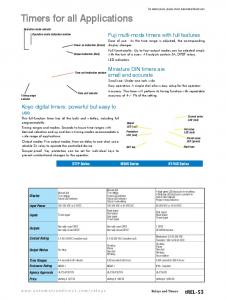
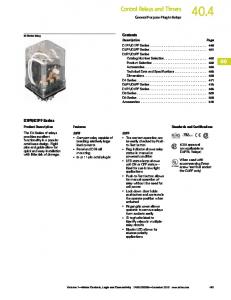
discipline (e.g. FCFS). Host and router computation is assumed to have zero overhead. The simulator clock has a granularity of 1�s. The version of TCP Lite used in our simulations corresponds to Lite.4 proposed in [5]. This version xes many bugs in the original 4.4BSD-Lite[26] distribution. TCP Lite is an extension of TCP Reno and provides support for long fat pipes (high bandwidth-delay paths) amongst other improvements [4]. The timeout estimation and congestion control algorithms used in TCP Lite are essentially the same as those in TCP Reno[16, 17, 23]. Figure 1 and Figure 2 show the network topologies we used for our simulations. The topology in Figure 1 was used to simulate a high speed WAN (wide area network) while the one in Figure 2 was used to simulate both a low speed WAN as well as a satellite network. In both topologies, nodes R1 and R2 are IP routers that are connected by the bottleneck link. The IP packet size used for simulating the low and high speed WANs was 1500 bytes while 512 bytes was used for simulations involving the satellite network. For the topology in Figure 1, eight senders (S1, S2, ... S8) use TCP to send data to eight destinations (D1, D2, ... D8) across the bottleneck link. The routers were con gured to have a bu�er size of 200 packets. The round-trip propagation delay is 60ms. The links connecting the end-hosts to the routers have a bandwidth of 100Mbps while the bottleneck link has a bandwidth of 155Mbps. This topology then provides a high bandwidth-delay path between R1 and R2 having a pipe size of 1.1MB. It resembles a real internet where hosts on several 100Mbps Ethernet LANs (local area networks) transfer data to destinations across a WAN consisting of an 155Mbps STS-3 link. In Figure 2 the bottleneck link that connects R1 and R2 has a bandwidth of 1.5Mbps. The two IP routers R1 and R2 are further connected to 10Mbps Ethernets. Senders (S1, S2) connected on the Ethernet attached to R1 use TCP to send data to desinations (D1, D2) that are connected on the Ethernet attached to R2. For simulating a low speed WAN, the bottleneck link in Figure 2 was con gured to use a round-trip propagation delay of 100ms and the bu�er sizes at the routers were set to 20 packets. This results in a low bandwidth-delay path of pipe size 200KB between R1 and R2. The setup is similar to other studies of TCP dynamics on low speed WANs [6, 5] and resembles an internet where 10Mbps Ethernet LANs are connected by a T1 link.
4 The simulations on a satellite network involve setting the round-trip propagation delay in Figure 2 to 580ms, while the router bu�er sizes were set to 70 packets. This topology is similar to the one used in [1] to emulate satellite networks and provides a high bandwidth delay path of size 116KB. The links used in this topology, however, do not simulate any bit errors. In the simulations with the high speed WAN and satellite topology, we use a TCP advertised window size of 512KB to accomodate the relatively large bandwidth-delay products in these simulated networks. This enables us to examine the e�ect of timer and congestion control algorithms on TCP performance without being limited by the receiver advertised window. For the low speed WAN, an advertised window of 64KB was used.
3 TCP timers and congestion control In this section, we present performance problems with the timer and congestion control mechanisms in TCP Lite that a�ect the startup dynamics. Many of these limitations have also been observed elsewhere in the literature [21, 12, 1, 6, 14]. As we will show, the impact of these problems is particularly signi cant in networks with large bandwidthdelay products, including high-bandwidth, long-haul networks and satellite networks. Simulation E�ective Avg Data Time (s) Throughput (%) Transferred 1 6.62 145.8 KB 5 19.81 2.2 MB 10 30.52 6.7 MB 20 56.36 24.8 MB 30 68.65 45.3 MB Figure 3: Time vs Throughput In this section, we'll use the high speed WAN topology in Figure 1 for studying the startup TCP dynamics over high bandwidth-delay paths. All senders transfer 100MB of data to the corresponding destinations and the simulation time was limited so as to terminate the transfers before they nish (as suggested in [7]). We de ne e�ective throughput as the ratio of the total amount of useful data that was transferred, to the maximum amount of useful data that could have been transferred over the bottleneck link for the time of the simulation. Figure 3 shows the e�ective throughput obtained by limiting the simulation time to several di�erent values. It also indicates the resulting average amount of data transferred by each sender in that time. The results indicate that the e�ective throughput of the TCP transfers increases with the increase in simulation time. The results can also be interpreted by thinking
5
KB
of the transfer sizes to be variable while the simulation time is unlimited. Interpreted this way, the e�ective throughput increases with the transfer size. For TCP transfers that take less than 1s of time to nish (i.e. the size is less than 145KB), the e�ective throughput is less than 7% while transfers that takes less than 10s to nish (less than 6.7MB in size), have an e�ective throughput of less than 30%. Only very large TCP transfers (of sizes greater than 45MB) attained an e�ective throughput of 70% and shall be able to e�ectively utilize the high-bandwidth network. Today, the vast majority of TCP tra�c over the Internet consists of HTTP transfers that have a mean size of less than 100KB [2]. Most of the TCP transfers on the Internet that use the ftp protocol are also less than 10MB. Thus, our results indicate a potentially severe underutilization of link capacity in networks with high bandwidth-delay products during common TCP transfers. 5090
600 540 480 420 360 300 240 180 120 60 0 2.0
4.0
6.0
8.0
10180
10.0
12.0
15270
14.0 16.0 Time in seconds
20360
18.0
25450
30540
20.0
22.0
35630
24.0
40720
26.0
45810
28.0
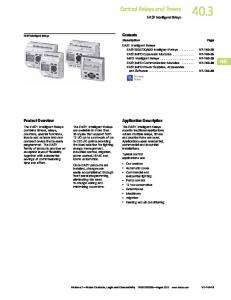
Figure 4: TCP Lite over Topology1 Figure 4 shows the trace of a typical TCP Lite transfer when the simulation time was limited to 30s (enough to transfer about 580MB of data across the bottleneck link). A description of the information presented in the trace is given in Appendix A. At t=0s, TCP enters the slow-start phase, where is doubles the size of the congestion window every round-trip time (RTT), starting at a size of one segment. This phase continues until t=1.2s, when multiple segment losses occur because the size of the congestions window has exceeded the capacity of the network. The losses result in a period of inactivity that extends to t=2.8s, when a retransmission timeout occurs. TCP reenters slow-start until t=3.4s, when the congestion window size reaches the slow-start threshold (ssthresh). At this point, TCP enters the congestion avoidance state, where the congestions window is increased by only 1 segment every RTT. This state continues until t=26.5s, when the congestion window has again grown too large, resulting in the loss of a single segment. This loss is detected by TCP's fast retransmit mechanism [23], the lost segment is retransmitted, the congestion window is halved, and TCP continues in the congestion avoidance state. In the rest of this section, we describe the main factors that limit TCP performance based on these observed simulation results.
30.0
6
3.1 Retransmission Timeout We rst focus on performance losses related to TCP's retransmission timeout mechanism. TCP's fast retransmit mechanism attempts to recover from packet losses without requiring a retransmission timeout. Fast retransmit is a heuristic that retransmits a segment upon receiving three duplicate ACKs for the segment that precedes the retransmitted packet. However, when faced with multiple segment losses, TCP has to generally rely on a retransmission timeout for recovery. For instance, the trace in Figure 4 indicates a retransmission timeout (shown by a large black circle at the top of the graph) at t=2.8s that resulted from multiple segment losses. The single segment loss at t=26.5s, on the other hand, is handled by the fast retransmit mechanism. Notice that prior to the retransmission timeout, the connection remained idle from t=1.2s to t=2.8s (indicated by the absence of Hash marks at the top of the graph as described in Appendix A). Hence, there is a delay of almost 1.6s between the timeout and the previous packet sent. Given that the round-trip delay is only 60ms, this timeout period is excessivley long. There are two reasons for this long timeout period. The BSD implementation of TCP uses a coarse-grained clock (500ms granularity), both for measuring the RTT and for scheduling timeouts. Since all scheduled timeout events are synchronized to the 500ms clock, the minimum possible timeout value is 2 ticks, resulting in an actual timeout period in the range 0.5{1s. Moreover, because of inaccuracies resulting from the measurement of the actual RTT using the 500ms clock, the actual minimal timeout value is normally 3{4 ticks, resulting in a timeout period in the range 1{2s. This issues will be further analysed in Section 4.1.
KB
3.2 Slow Start 640
600 540 480 420 360 300 240 180 120 60 0 0.2
0.4
0.6
0.8
1.0
1.2
1280
1.4
1.6
1.8 2.0 2.2 Time in seconds
2.4
2.6
2.8
3.0
3.2
3.4
3.6
3.8
4.0
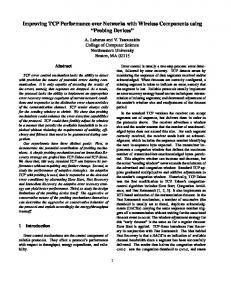
Figure 5: Slow-Start in TCP Lite over Topology1 Next, we consider the impact of TCP's slow-start on performance. Figure 5 shows an exploded view of the rst 4 seconds in the trace of Figure 4. The trace shows that the connection gets established after about 60ms3. After this, TCP enters the slow-start state with an initial congestion window of 1 segment. TCP is said to be in slow-start This is where the sender gets to know the receiver's advertised window and is indicated by the setting of the dark gray line in the trace to 512KB as mentioned in Section 2. 3
7 whenever the congestion window is less than the slow-start threshold (ssthresh). In slow-start, the congestion window is increased exponentially every RTT4 until either the congestion window becomes larger than ssthresh or lost segments are detected. Despite an exponential increase in the size of the congestion window, slow-start can take many round-trip times before lling up the network pipe in a network with large bandwidth-delay product. This results in ine�cient link utilization for short TCP transfers, especially those that nish while still in slow-start. The primary cause of the low e�ective throughput reported in Figure 3 for small simulation times is the slowstart phase. We will address the issue of performance limitations due to slow-start in Section 4.2.
3.3 Congestion Avoidance Finally, we consider performance loss due to TCP's congestion avoidance state. When the congestion window becomes greater than ssthresh, TCP enters the congestion avoidance state, where the congestion window is increased by 1 segment every RTT5 . Figure 4 shows that TCP enters the congestion avoidance state at 3.4s. The congestion window is increased linearly until a packet loss is detected (at 26.5s). Thus, it took about 23s to ll the network pipe (including the bu�ers at the bottleneck router). More importantly, after the timeout, it took more than 16s to increase the congestion window to a value of 145KB (this is the pipe size available to a sender if we assume that the bandwidth is distrubuted fairly amongst all 8 senders). During this time, TCP was underutilizing the available capacity in the network. Once the pipe is full, further increase in the congestion window lls up the router bu�ers until congestion occurs due to bu�er over ows. Other researchers [1] have also observed that the linear rate of growth of the congestion window can cause decreased performance in satellite networks that typically involve high bandwidth-delay paths. We do not address this problem in this paper, but in Appendix B we suggest some possible approaches that can be used. In the next section, we present our enhancements to TCP's timeout estimation and slow-start techniques that address the limitations described in this section.
4 TCP Timers: New Framework to Utilize OS Capabilities In this section, we propose a new framework that allows TCP to make the best possible use of the timer facilities available in the host operating system and architecture. The framework allows TCP to perform more accurate RTT measurements and to schedule 4 5
Delayed ACKs in TCP cause the window increase to be less than exponential [5]. Delayed ACKs cause the window increase to be less than 1 segment every RTT
8 ner-grained timeouts that are much closer to the RTT of the network by exploiting improved timing facilities available in modern computer systems. The BSD implementation of TCP, which still forms the basis for many commercial OS implementations, expects the operating system to provide it with two periodic \software interrupts". One of these interrupts invokes a designated TCP function every 200ms, the other invokes a separate TCP function every 500ms. These two interrupts consititute all of the timing services that TCP expects of the host operating system; all TCP timer mechanisms (round-trip time estimation and various TCP timeouts) are implemented by the TCP protocol module using these periodic interrupts. While this minimalistic timing service interface to the operating systems ensures portability across a wide range host hardware and software platforms, it also constrains the accuracy of TCP time management. Two technological changes have occured since the original BSD TCP implementation was developed that drive our proposed new framework for time management in TCP. First, network speed has increased by several orders of magnitude, thus increasing the impact of inaccuracies in timer management on TCP performance. Second, vastly improved timing and event handling facilities are available in modern host operating systems and platforms. Our new framework aims at enabling TCP to take advantage of the best timing facilities available in a given host OS and platform, while still retaining the ability to make due with the traditional BSD style coarse-grained timing facilities to ensure backward compatibility and portability across a wide range of host platforms. Our proposed framework has two salient features: 1. TCP expects OS to provide two di�erent timing-related services|one for measurement and one for event scheduling. 2. TCP is actively aware of the clock granularity of each of the services and adapts its behavior based on the available clock granularities. The OS service for time measurement consists of an operation currentTime(), which returns a 64-bit value, representing the current real time in nanoseconds. Since the values are used only to measure intervals, the time need not be synchronized with any standard time base. In addition, the TCP module can queury the resolution of the underlying timer. Note that although currentTime() returns the current time in nanoseconds, the actual resolution of the obtained values may be much coarser, for instance 500ms. A second OS service provides the TCP module with a facility to schedule events. This can either be in the form of a periodic software interrupt (as for BSD implementations), or as an explicit request by the TCP module for a sofware interrupt whichever is e�ciently supported by the OS. A designated function in the TCP module is invoked as a result of the software interrupt. This function is used by the TCP module to implement its various event timer facilities using appropriate data structure, such as timing
9 wheel [24] and calendar queues [8]. Again, the TCP module can query the granularity of this event service, and this granuarity determines the granularity of TCP's timers. Typically, the OS service for measuring time can provide a ner granularity than the service for event scheduling. This is because most modern architectures provide a ne-grained timer/counter with micro to nano-second granularity in hardware, whose current value can be read with little overhead [6]. Providing an event timer, on the other hand, involves a thread dispatch that is currently only e�ciently supported at a millisecond granularity as a ner granularity could cause signi cant interrupt overhead. The separation of the services for time measurement and event scheduling allows TCP implementations to take advantage of this fact. Current BSD implementations use the same coarse-grained (500 ms) clock for both time measurement as well as for scheduling events. Thus, time measurements are made at the same coarse granularity as event scheduling. In the following subsections, we show how the proposed timer framework can be utilized to reduce the ine�ciencies associated with retransmission timeouts and slow-start in TCP.
4.1 Retransmission Timeout: decoupling estimation and scheduling We have shown in Section 3.1 that the long delay associated with the ring of the retransmission timeout can cause decreased performance. In this section, we show how to achieve shorter retransmission timeouts and the associated throughput loss taking advantage of the timer framework proposed in the previous section. The RTO value calculation in the BSD implementations of TCP are described in [16]. The appropriate retransmission timer value rto is calculated based on an RTT estimator a and a mean deviation estimator d, according to the formula:
rto
a + 4d
The estimators are updated using a new RTT measurement m using the following formulas:
Err � m ? a a a + g0Err d d + g1 (jErrj? d) The chosen values for gain parameters are g0 = 18 and g1 = 41 , which allows integer
arithmetic using scaled versions of the above equations and using scaled estimators that are de ned as sa = 23 a and sd = 22d. The calculations can be implemented using integer arithmetic as follows:
Err � m ? (sa >> 3) sa
sa + Err
10
sd
sd + (jErrj? (sd >> 2)) rto (sa >> 3) + sd
(1) The BSD implementations of TCP use a coarse-grained clock (500ms granularity) for measuring RTT and scheduling timeouts. Two problems arise when the above calculations are performed on tick counts from a coarse-grained clock: 1. Due to the coarse-grained clock used, there can be a large variance in the measurement of RTT, resulting in a large value for sd. For small RTTs, the contribution of (sa >> 3) would be much smaller than the contribution due to sd, thus resulting in large estimates of RTO as compared to the average RTT (given by (sa >> 3)). 2. Brakmo and Peterson [5] have shown that due to limited precision of the C implementation, the mean deviation estimator does not decay even when repeated RTT measurements with the same value are made. This problem is signi cant only when sd is large compared to (sa >> 3) i.e. when the clock is coarse-grained. The work in [5] shows that for round-trip times of about 100ms, the estimated RTO can be as large as 5 ticks and almost never goes below 3 ticks. RTO values of 5 ticks and 3 ticks can cause an actual timeout delay of 2{2.5s and 1{1.5s, respectively6 . Brakmo and Peterson [5] also propose a x for the second problem described above by using larger scaling factors. The authors show that as a result, the estimated RTO frequently is 3 ticks while sometimes it does get as low as 2 ticks (the minimum possible value for RTO in BSD implementations of TCP). Overly conservative estimates for RTO can keep the connection idle for unnecessarily long periods of time. This results in ine�cient link utilization, which is particularly costly for high bandwidth networks. If the RTT is su�ciently smaller than the granularity of the coarse-grained clock, the estimated value of RTO should be the minimum possible (2 ticks). This would keep the timeout delay between 0.5{1s. We propose the following method for calculating RTO values, taking advantage of the timer framework proposed in the previous section. Let the clock frequency for measuring time be frtt and the clock frequency for scheduling events be fev . After measuring time in ticks corresponding to the frtt clock, Equation 1 is used to compute rto. This value is in ticks, corresponding to the frtt clock, and is expected to be closer to the real RTT because of the ner granularity of the clock used. The actual timeout rtoev value is computed using the following equation:
rtoev MAX (2; drto � fev =frtte + 1) (2) The term drto � fev =frtt e gives the number of ticks of the fev clock that are equivalent to rto ticks of the frtt clock. The increment by one accounts for the fact that packet
transmissions may not coincide with any clock tick in BSD implementations.
The 500ms clock in BSD implementations of TCP ticks regularly every 500ms rather than re-starting at the instant when packets are sent. Thus, an RTO of 5 ticks can result in a delay of anywhere from 2 to 2.5s. 6
11
RTTc
RTOO
RTOB
RTTf RTONf RTONc
(500ms) (500ms) (500ms) (1ms) 0 3 3 60 0 3 3 150 1 5 3 60 0 4 3 60 0 3 3 61 0 3 3 60 0 3 3 61 0 3 3 60 0 3 3 60 0 3 2 61 0 3 2 60 1 5 3 61
(1ms) 183 253 218 190 167 150 135 123 114 105 99 93
(500ms) 2 2 2 2 2 2 2 2 2 2 2 2
Figure 6: Sample RTO computation In short, the new framework decouples the clock granularity used for measuring RTT from that used for scheduling events. This e�ectively results in a ne-grained measurement of RTT and avoids an overly conservative estimation of RTO without a�ecting the clock granularity for actually scheduling timeouts. The 4.4BSD implementations of TCP also use the timestamp option [4] in the packet header to measure the round-trip time of a segment in addition to maintaining internal variables for timing a segment7. This timestamp is re ected back in acknowledgements sent by the receiver. It is to be noted that clock granularities ner than 1ms should not be used in the timestamp option in TCP [4] (the BSD implementations use a 500ms clock granularity). This value is the minimum suggested in RFC1323 [4] and is necessary for the detection of timestamps that are older than 24 days by the PAWS (protection against wrapped sequence numbers) mechanism in TCP8 . However, this does not imply that a ner granularity clock available in the OS cannot be used to its full advantage. The value provided by currentTime() can be scaled to 1ms granularity to be put in the timestamp option and upon reception of the acknowledgement, the ner internal estimation of RTT can be compared with that obtained using the timestamp. If they are within a millisecond, the internal estimation can be used; if not, the RTT measurement using the timestamp should be used in the timeout estimation equations (after scaling it to nanosecond granularity). Figure 6 shows the RTO computation with RTT measurements taken from a typical [4]
7
This avoids underestimations of RTT when an ACK is misinterpreted as acknowledging a retransmitted segment
8
As long as the timestamp doesn't have a ner granularity than 1ms, the PAWS test remains una�ected.
12 TCP sender in the simulation run presented in Section 3. RTTc gives the RTT measurement made by a 500ms clock. RTTf gives the RTT measurement made by a 1ms clock. RTOO gives the RTO estimate as computed by TCP Lite. RTOB gives the RTO estimate after applying the xes suggested by Brakmo and Peterson [5] to the timeout estimation algorithms in TCP Lite. RTONf gives the RTO estimate as computed using RTT measurements by the 1ms clock9 . RTONc gives the RTO estimate as computed by equation 2 by using frtt = 1000Hz and fev = 2Hz . The results show that the proposed framework computes the minimum estimate for RTO (given by RTONc) while the other estimation algorithms often compute values that are overly conservative. It is to be noted that even if a ne-grained clock is provided by the OS to schedule events, a lower bound of at least 200ms should be observed for the estimation of the timeout. This is because BSD TCP receivers can delay ACKs by 200ms that can cause unnecessary retransmissions if the timeout is estimated lower than this value. In all simulations reported in this paper with a ner event scheduling clock, we set this lower bound to (200ms + rtt) where rtt gives the average round-trip time and is obtained from sa mentioned earlier.
4.2 Slow-Start: Pacing Packets The results in Section 3.2 indicate that on networks with a high bandwidth-delay product, TCP's slow-start mechanism can take many round-trip times until it lls the network pipe. As a result, short transfers cannot take advantage of the network's capacity. We present a modi cation to TCP slow-start based on packet pacing that enables TCP to ll the network pipe more quickly, thus e�ciently utilizing the available bandwidth, even for short transfers. Packet pacing takes advantage of the new timer framework proposed in Section 4. In order to improve the e�ciency of slow-start, once could consider the following naive approach: 1. Measure the bandwidth-delay product and set the slow-start threshold (ssthresh) to this value. Techniques to measure the bandwidth-delay product have been shown in [14, 6, 18, 22] and Hoe [13] has already proposed setting the initial ssthresh value to the estimated bandwidth-delay product. 2. Set the congestion window to the value of ssthresh. This would immediately send out a bandwidth-delay product's worth of data, thus lling up the network pipe immediately. There are several problems with the above approach. The techniques used to measure the bandwidth-delay product can overestimate its value. These techniques usually implement a variant of the packet-pair algorithm [18] to estimate the bandwidth BSD implementations set the initial values of sa and sd so as to give a value of rto that is three times as large as the measured RTT. Thus RTONf has a large initial value. 9
13 and multiply it by the measured RTT to compute the bandwidth-delay product. The packet-pair algorithm estimates bandwidth by measuring the di�erence in the times of reception of the ACKs of two closely sent data segments. Certain network phenomena like ack clustering [27] and the absence of fair queuing in the network routers can give an in ated estimate of the bandwidth, if computed using the packet-pair algorithm. Furthermore, the measured RTT usually includes queuing delays that can also result in an elevated estimate of the bandwidth-delay product. Even if the bandwidth-delay product is measured accurately, sending an equivalent number of segments back-to-back (i.e., at the capacity of the network link adjacent to the sending host) can cause extreme congestion at the bottleneck router. TCP's slow-start, on the other hand, never sends more than 2{3 segments back to back (if the receiver uses delayed ACKs, then the sender sends 3 segments back to back). To avoid congestion, a practical scheme for speeding up TCP's slow-start for high bandwidth-delay networks must (1) conservatively estimate the bandwidth-delay product of the network to determine the appropriate congestion window, and (2) pace the transmission of the corresponding segments at a rate that does not exceed the capacity of the bottleneck. We propose such a scheme in the following subsections.
4.2.1 Estimating ssthresh We present a method that conservatively estimates the initial value of ssthresh, the slow-start threshold. This value will be used to determine a pacing threshold (pthresh) that will be used as the target congestion window size during the segment pacing. The ssthresh estimation involves the following steps: � The bandwidth, bw, is estimated based on the interarrival times of closely spaced acknowledgements such that the total acknowledged data used to estimate the bandwidth is at least 2 segments. The bandwidth-delay product is computed by taking the product of the bandwidth with the estimated RTT. An ssthresh estimation is then made by setting it to this value. � Instead of estimating the ssthresh only once, we estimate its value repeatedly at most once every RTT. The new ssthresh value at each estimation is set to the minimum of all estimations done so far. As soon as an estimation lies within 10% of the minimum of the estimations done so far, the resulting ssthresh value is considered to be nal and no more estimations are performed. Repeated estimations greatly decrease the probability of overestimating the bandwidth. The value of pthresh is then set to half the value of the estimated ssthresh. Setting pthresh to half the measured bandwidth-delay product compensates both for an elevated RTT estimate (due to any queuing delays) and any overestimations of the bandwidth. It can be shown that if bandwidth is estimated correctly, then transmitting pthresh's worth of data in the network would not even increase the queue occupancy at
14 the routers unless the queuing delay is larger than round-trip propagation delay of the network links. It is to be noted that both bandwidth estimation as well as RTT estimation use the time measurement abstraction in our proposed timer framework. To reduce the time for computing an estimate for the bandwidth-delay product, we use an initial startup congestion window given by: MIN (4 � MSS; MAX (2 � MSS; 4380bytes)) where MSS gives the maximum size of a TCP segment. Setting the initial congestion window to the above value has been proposed by Floyd et al [11] and is currently in the process of standardization by IETF. The above amounts to using an initial congestion window of 3 segments for an IP packet size of 1500 bytes and 4 segments for an IP packet size of 512 bytes.
4.2.2 Pacing Once the value of pthresh has been estimated, we use the event scheduling clock to schedule the transmission of as many segments as possible, subject to the constraint that the total transmitted data in one RTT remains less than the estimated pthresh value. The segments are paced in time dictated either by the estimated bandwidth, or by the minimum granularity provided by the OS's scheduling clock, i.e., a single tick of the event scheduling clock. Moreover, the amount of time over which pacing is done does not exceed one RTT. Thus, if p is the value of the estimated pthresh in segments, bw is the estimated value of the available bandwidth in segments/s d is the number of segments that have already been sent in the current RTT by the normal slow-start mechanism, then N TCP segments would be sent with an inter-transmission time T where N and T are given by: N MIN (p ? d; RTT � fev ) T MAX (1=fev ; 1=bw) Note that TCP takes both the granularity of the event scheduling clock and the pthresh value into account when determining the number of segments to send. It is also to be noted that this technique cannot su�er from bandwidth overestimation if (1=fev > 1=abw) where abw gives the actual available bandwidth. This implies that for the clocks with fev = 100Hz (or 10ms granularity) available in systems today, overestimating available bandwidths of more than 150KB/s (for a 1500 byte IP packet size) cannot cause network bursts. Moreover, unless the RTT estimate is hugely in ated due to queuing delays, our pacing technique will not transmit more than the capacity of the pipe. Transmitting paced TCP segments in this fashion strikes a balance between lling up the network pipe quickly and avoiding congestion due to tra�c bursts.
15
5 Performance Evaluation In this section, we evaluate the performance improvement a�orded by the proposed improvements to TCP in the previous sections. We rst present simulations that demonstrate the e�ectiveness of our proposed techniques in reducing the delay associated with retransmission timeout in both high as well as low bandwidth-delay networks. Then we show the performance improvements yielded by estimating ssthresh and pacing packets during the initial slow-start phase in TCP. In all simulations using our proposed timer framework, the granularity of the clock used for time measurement is 1ms (i.e. frtt is 1000Hz).
5.1 Timeout Delay Reduction 700
30
25 Data Transferred (MB)
Data Transferred (KB)
600 500 400 300 200
20
15
10
prop-timer orig-timer
100
prop-timer orig-timer
5 0
1
2 3 4 Simulation Time (in seconds)
5
Figure 7: Low Bandwidth-Delay
0
1
2 3 4 Simulation Time (in seconds)
5
Figure 8: High Bandwidth-Delay
To estimate the advantages a�orded by the proposed timer mechanism, we performed two experiments { one on the low bandwidth-delay network (obtained by setting the propagation delay to 100ms in Figure 2) and the second on the high bandwidth-delay network in Figure 1
5.1.1 E�ect on Low Bandwidth-Delay Network Sender S1 in Figure 2 was set up to send an in nite amount of data to D1 using TCP Lite. Once the transfer reached steady state behaviour (after 15s of simulation time), sender S2 was made to transfer data to D2. Due to the bursty slow-start mode in TCP Lite, Figure 7 shows the amount of data transferred across the bottleneck link in the next 5s after starting the transfer from S2 to D2. The curve entitled \prop-timer" shows the performance when all senders were using our proposed timer mechanism, while \orig-timer" corresponds to the use of the original timeout estimation algorithm in TCP Lite. Both senders use a 500ms clock for scheduling timeouts.
16 Our results indicate that the startup burstiness of sender S2 caused both S1 and S2 to undergo a timeout. The average timeout delay for \orig-timer" was nearly 2s. On the other hand, the timeout delay associated with \prop-timer" was always less than 1s for both senders. This indicates that our proposed scheme always estimates the timeout as 2 clock ticks (a value more than 2 would result in a delay that is more than 1s), which is the minimum in the BSD implementations of TCP. On the other hand, the original scheme estimated the timeout to be more than 2 ticks that lead to an unnecessarily large delay given an RTT of 100ms. A reduction of 1s in delay is equivalent to 10 round-trips in the topology being simulated. Our results show that the senders using our proposed timer scheme were able to transfer about 170KB more data during this period as compared to the original scheme that lead to an increase in e�ective throughput from 44% to 66%. We have also performed similar simulations with the technique suggested by Brakmo and Peterson in [5]. The faster decay resulted in an average delay of 1.5s (corresponding to 3 ticks) that provided an e�ective throughput of 55%.
5.1.2 E�ect on High Bandwidth-Delay Network The simulation involving the topology in Figure 1 was set up to have senders S1 through S7 transmit data to the corresponding destinations D1 through D7. After 50s of simulated time, sender S8 was started so as to send data to D8. This enabled the senders S1 through S7 to reach steady state behaviour. Our results indicate that due to the burstiness of the initial slow-start in TCP Lite, 6 out of the 7 senders experienced a timeout. Figure 8 shows the total amount of data transferred across the bottleneck link in the next 5s. The meaning of entitled curves \prop-timer" and \orig-timer" is similar to those for Figure 7. All senders use a clock granularity of 500ms for scheduling timeouts. Our results show that the average timeout delay for \orig-timer" was about 1.5s. On the other hand, the timeout delay associated with \prop-timer" was again always less than 1s for all senders and averaged at about 700ms. This leads to an average reduction of more than 500ms in the delay that is equivalent to 8 round-trips (for 60ms RTT). Our results show that the senders using our proposed timer scheme were able to transfer about 1.5MB more data during this period as compared to the original scheme. Similar simulations with the technique in [5] resulted in an average delay of about 950ms. Our results also indicate that less than 20MB of data were transmitted in the 5s following the startup of sender S8. This indicates a bandwidth utilization of only about 20% and is a direct result of the pipe drainage due to the timeout delay. The ensuing slow-start after a timeout is not fast enough to ll up the pipe in high bandwidth delay networks. We conclude that while the occurance of a retransmission timeout leads to a greater
17 degradation in e�ective throughput in high bandwidth-delay networks, a reduction in the delay associated with it provides higher percentage gains for for the same in low bandwidth-delay networks. However, reducing the delay is equally important in both for reducing the response time perceived by the user for short TCP transfers.
5.2 SSthresh Estimation and Pacing
100
100
80
80
Effective Throughput (%)
Effective Throughput (%)
We present simulations that show the e�ectiveness of predicting the initial ssthresh and pacing packets over high bandwidth-delay networks. We present results for both the low bottleneck speed network in Figure 2 as well as for the high speed network in Figure 1. The propagation delay for the topology in Figure 2 was set to 290ms. As mentioned in Section 2, this topology is similar to the one used in [1] for emulating satellite networks.
60
40
prop-Lite-10ms prop-Lite-500ms orig-Lite-500ms
20
60
40
prop-Lite-2ms prop-Lite-10ms prop-Lite-500ms orig-Lite-500ms
20
0
0 0
10
20 30 40 Simulation Time (in seconds)
Figure 9: Satellite Network
50
0
1
2 3 4 Simulation Time (in seconds)
5
Figure 10: High Speed WAN
5.2.1 Satellite Network Figure 9 shows the results when a standalone TCP transfer is made between hosts S1 and D1 in gure 2. The y-axis shows the e�ective throughput, while the x-axis depicts the simulation time for which the simulation was allowed to run. The curve denoted by \orig-Lite-500ms" corresponds to the simulation with the original timer and slow-start schemes in TCP Lite with the scheduling clock's granularity set to 500ms (i.e. fev is 2Hz). Similarly the curve \prop-Lite-10ms" denotes the simulation with TCP Lite that was enhanced with ssthresh estimation as well as the proposed timer framework; the granularity of the scheduling clock is 10ms (i.e. fev is 100Hz). For a fair comparison, all simulations used an initial congestion window as de ned in Section 4.2.1 (4 segments for an IP packet size of 512 bytes). Our results indicate that the original TCP Lite is able to achieve a maximum of only 18% of the e�ective throughput in the time shown. This is mainly due to multiple window decreases followed by an expensive timeout because of the losses resulting from unbounded initial window growth. After the timeout, Lite starts with a small congestion
18 window (due to multiple decreases before the timeout) and thus takes a long time in lling the pipe. A comparison of the curves \prop-Lite-500ms" and \orig-Lite-500ms" shows almost a 5-fold increase in performance for simulations that lasted longer than 20s. This was primarily due to the ssthresh estimation incorporated for \prop-Lite-500ms" (pacing is not e�ective due to the large value of clock granularity). With a 10ms scheduling clock, the sender for \prop-Lite-10ms" was able to achieve a 5-fold improvement over \prop-Lite-500ms" for simulations that last less than 5s.
5.2.2 High Speed WAN Figure 10 shows the performance for eight competing TCP transfers on the topology shown in Figure 1. The curves shown are labelled similarly as in Figure 9. Again, for a fair comparison, all simulations used an initial congestion window as de ned in Section 4.2.1 (3 segments for an IP packet size of 1500 bytes). Our results indicate that incorporating the ssthresh estimation in TCP Lite yields nearly a 10-fold increase in performance over orig-Lite for simulations times that are less than 5s. The larger initial window usage and ssthresh estimation resulted in the slow-start terminating after 0.7s. Our results indicate that in this period, pacing with a 10ms clock achieved a 20% increase in performance. Pacing with a 2ms clock resulted in an 85% increase in e�ective throughput over \prop-Lite-500ms". We also observe that pacing with a 10ms clock o�ers lesser improvement in this topology than for the one used for satellite network because of the relatively short round-trip time (60ms compared to 580ms in satellite topology).
6 Related Work Floyd[10] discusses the problem of invoking fast retransmit mechanism multiple times for the same window of data. Hoe [14] proposes two methods to improve TCP's congestion control algorithms. First, it attempts to set the slow-start threshold (ssthresh) to an appropriate value by measuring the bandwidth-delay product using a variant of the packet-pair technique [18]. Paxson[22] suggests a more robust bottleneck estimation technique called PBM that forms estimates using a range of packet bunch sizes. The second method in [13] recovers multiple packet losses in the same window without decreasing the window multiple times. Our method of estimating ssthresh is similar to the one described in [14] except that it repeatedly estimates ssthresh until a value that di�ers from the minimum by less than 10% is obtained. Fall and Floyd [9] investigate the e�ect of multiple packet losses on the congestion control algorithms of TCP Reno. They point out that the absence of selective acknowledgments imposes limits on TCP's performance. Their work also shows that TCP with
19 selective acknowledgments (SACK-TCP) can e�ectively recover from multiple packet losses. Paxson[22] shows that in the absence of the SACK TCP option [20], a signi cant number of lost packets in the Internet are recovered using the coarse-grained retransmission timeout. The same was con rmed by Balakrishnan et al [3]. Our proposed timer framework reduces the unnecessary long delays associated with a retransmission timeout when a coarse-grained clock is used for scheduling events. Brakmo et al[6] have also used the ne-grained system clock to detect lost packets early (while processing a received duplicate ACK) in TCP Vegas. Their method does not however a�ect the coarse-grained retransmission timeout in TCP. Allman et al[1] have shown the limiting e�ect of slow-start and congestion avoidance schemes in TCP in utilizing the bandwidth over satellite networks. Our proposed scheme for pacing packets in slow-start addresses their former observation. Visweswaraiah et al[25] suggest using rate-based pacing to improve the restart of idle connections. While their technique is applicable only to the restarting of data ow in TCP after an idle period, our suggested pacing technique improves performance in the intial startup period and is primarily aimed at improving the performance of short TCP transfers. To the best of our knowledge, using timer mechanisms to pace packets in TCP has not been comprehensively studied.
7 Conclusions In this section we present our conclusions. We summarize the main results presented in this paper as follows:
� The startup dynamics in BSD based implementations of TCP can su�er from severe
performance degradation, both in latency as well as throughput. The problem is specially severe on high bandwidth-delay networks owing to the large number of round-trips needed to ll up the pipe. � The main cause of performance degradation for short transfers (that nish before slow-start completes) is the large number of round-trips taken by slow-start to ll the pipe. � The primary cause of performance degradation for transfers that nish after slowstart is the draining of the pipe due to a retransmission timeout following the huge losses caused by an unchecked increase of congestion window in slow-start. The congestion avoidance phase that follows is very slow in occupying the available bandwidth in high bandwidth-delay networks. The overly conservative delay associated with a timeout in BSD implementations of TCP a�ects the user-perceived latency.
20
� We have proposed a timer framework that decouples the OS facilities for time mea-
surement and event scheduling. Decoupling these services in this fashion enables TCP to adaptively use them to its best possible advantage. � We have shown how TCP can use the suggested timer framework to reduce the overly conservative delays associated with a retransmission timeout. This reduces the user-perceived latency in both high as well as low bandwidth-delay networks. However, the percentage gain in e�ective throughput is larger for low bandwidthdelay networks because of the smaller time needed to ll the pipe. � We have proposed to improve the performance of the initial slow-start by pacing the packets using the event scheduling facility provided by the OS. This has the potential of yielding improved performance for short TCP transfers that mainly characterize the web tra�c today. � Finally we have shown the importance of estimating the initial ssthresh value for high bandwidth-delay paths.
References [1] M. Allman, C. Hayes, H. Kruse, and S. Ostermann. TCP Performance over Satellite Links. In Proceedings of 5th International Conference on Telecommunication Systems, Mar. 1997. [2] M. F. Arlitt and C. L. Williamson. Web Server Workload Characterization: The Search for Invariants. In Proceedings of the ACM SIGMETRICS '96 Conference, Philadelphia, PA, Apr. 1996. [3] H. Balakrishnan, S. Seshan, M. Stemm, and R. H. Katz. Analyzing Stability in Wide-Area Network Performance. In Proceedings of the ACM SIGMETRICS '97 Conference, 1997. [4] D. Borman, R. Braden, and V. Jacobson. RFC 1323: TCP extensions for high performance, May 1992. [5] L. Brakmo and L. Peterson. Performance Problems in 4.4BSD TCP. ACM Computer Communication Review, 25(5):69{86, Oct. 1995. [6] L. Brakmo and L. Peterson. TCP Vegas: End to End Congestion Avoidance on a Global Internet. IEEE Journal on Selected Areas in Communications, 13(8):1465{ 1480, Oct. 1995. [7] L. S. Brakmo and L. L. Peterson. Experiences with Network Simulation. In Proceedings of the ACM SIGMETRICS '96 Conference, 1996. [8] R. Brown. Calendar queues: A fast O(1) priority queue implementation for the simulation event set problem. Communications of the ACM, 31(10):1220{1227, Oct. 1988.
21 [9] K. Fall and S. Floyd. Simulation-based Comparisons of Tahoe, Reno, and SACK TCP. Computer Communication Review, 26(3), July 1996. [10] S. Floyd. TCP and Successive Fast Retransmits. Technical report, Lawrence Berkeley Laboratory, May 1995. ftp://ftp.ee.lbl.gov/papers/fastretrans.ps. [11] S. Floyd, M. Allman, and C. Partridge. Increasing TCP's Initial Window. IETF Internet Draft, July 1997. Available by anonymous ftp from ds.internic.net/internetdrafts/draft- oyd-incr-init-win-00.txt. [12] J. Heidemann, K. Obraczka, and J. Touch. Modeling the performance of HTTP over several transport protocols. To appear, IEEE/ACM Transactions on Networking 5(5), Oct. 1997. [13] J. C. Hoe. Start-up Dynamics of TCP's Congestion Control and Avoidance Schemes. Master's thesis, MIT, 1995. [14] J. C. Hoe. Improving the Start-up Behaviour of a Congestion Control Scheme for TCP. In Proceedings of the ACM SIGCOMM '96 Symposium, 1996. [15] N. C. Hutchinson and L. L. Peterson. The x-kernel: An Architecture for Implementing Network Protocols. IEEE Transactions on Software Engineering, 17(1):64{76, January 1991. [16] V. Jacobson. Congestion Avoidance and Control. In Proceedings of the ACM SIGCOMM '88 Symposium, pages 314{32, Aug. 1988. [17] V. Jacobson. Berkeley TCP evolution from 4.3-tahoe to 4.3-reno. In Proceedings of the Eighteenth Internet Engineering Task Force, Aug. 1990. [18] S. Keshav. A Control-Theoretic Approach to Flow Control. In Proceedings of the ACM SIGCOMM '91 Symposium, pages 3{15, Sept. 1991. [19] D. Lin and H. T. Kung. TCP Fast Recovery Strategies: Analysis and Improvements. In Proceedings of IEEE INFOCOM '98, Mar. 1998. [20] M. Mathis, J. Mahdavi, S. Floyd, and A. Romanow. RFC 2018: TCP selective acknowledgment options, Oct. 1996. [21] J. C. Mogul. The Case for Persistent-Connection HTTP. In Proceedings of the ACM SIGCOMM '95 Symposium, 1995. [22] V. Paxson. End-to-End Internet Packet Dynamics. In Proceedings of the ACM SIGCOMM '97 Symposium, 1997. [23] W. Stevens. TCP/IP Illustrated Volume 1 : The Protocols. Addison-Wesley, Reading, MA, 1994. [24] G. Varghese and A. Lauck. Hashed and hierarchical timing wheels: Data structures for the e�cient implementation of a timer facility. In Proceedings of the Eleventh ACM Symposium on Operating Systems Principles, pages 171{180, Nov. 1987.
22
Figure 11: General Elements
Figure 12: TCP Windows
[25] V. Visweswaraiah and J. Heidemann. Improving restart of idle TCP connections. Technical Report 97-661, University of Southern California, November 1997. [26] G. Wright and W. Stevens. TCP/IP Illustrated Volume 2 : The Implementation. Addison-Wesley, Reading, MA, 1995. [27] L. Zhang, S. Shenker, and D. D. Clark. Observations on the Dynamics of a Congestion Control Algorithm: The E�ects of Two-Way Tra�c. In Proceedings of the ACM SIGCOMM '91 Symposium, pages 133{148, 1991.
A Graph Description Figures 11 and 12 explain the trace graphs used in this paper10 . Figure 11 shows some general information shown in the graphs: (1) Hash marks on the x-axis indicate when an ACK was received. (2) Hash marks at the top of the graph indicate when a segment was sent. (3) The numbers on the top of the graph indicate when the nth kilobyte (KB) was sent. (4) Diamonds on top of the graph indicate when TCP checked whether a coarse-grained timeout should happen. (5) Black circles on top of the graph indicate that a coarse-grained timeout actually occurred. (6) Solid vertical lines running the whole height of the graph indicate when a segment that is retransmitted was actually sent. Figure 12 shows traces of the TCP windows: (1) The dashed line gives the slow-start threshold (ssthresh). (2) The dark gray line gives the send window (minimum of the sender's bu�er size and receiver's advertised window) and gives the upper limit on the amount of unacked data. (3) The light gray line gives the congestion window. (4) The thin-line gives the actual amount of unacked data. 10
[6, 5] give a more detailed description of the same
23
B Congestion Avoidance We suggest a possible approach to address the problem of slow congestion window increase in high bandwidth-delay networks. Jacobson [16] suggests increasing the congestion window additively and decreasing it multiplicatively for network stability. In most existing TCP implementations, the unit of congestion window increase (in bytes) depends on the segment size, which is usually determined by the MTU of the network to which the sender connects and can vary from 512 bytes to 9180 bytes. For a faster window increase in high bandwidth-delay networks, this additive unit of window increase can be decoupled from the TCP segment size and can be determined as a fraction of the available pipe size. As information about the available pipe size is not known apriori, extreme care is required so as not to a�ect the fairness and network stability. This approach can be possibly used with TCP Vegas[6] that can dynamically estimate the pipe size by keeping track of the increase in bu�er occupancy at the bottleneck routers.