TEACHERS’ ASSESSMENT AND STUDENTS’ SELF-ASSESSMENT ON THE STUDENTS’ SPREADSHEET KNOWLEDGE Mária Csernoch, Piroska Biró University of Debrecen, Faculty of Informatics (HUNGARY)
[email protected],
[email protected]
Abstract In the academic year of 2011/2012 a program was launched at the Faculty of Informatics of the University of Debrecen, Hungary to test the spreadsheet knowledge of the freshmen. This year and in the following 695 students were tested, altogether. In advance to the academic test a self-assessment test was completed by the students, where on a 0-5 Likert scale the students were asked to evaluate their spreadsheet. In the follow-up section of the program elementary and secondary school teachers of Informatics and Computer Sciences were given a similar questioner. The questioner contained the students’ test and additional questions in connection with the students’ performance and the importance of the task. The students’ results in the spreadsheet tasks reached 20% neither of the two years. The results of our research, however, clearly indicate that both the self-assessment values and the teachers’ evaluation values significantly overestimate the students’ performance. Comparing our results to previously tested self-assessment evaluations the students’ overestimation on selfassessment is not surprising, it is a well-established phenomenon. However, the overestimation of the students’ results by the teachers is rather alarming, since it means that the teachers of Informatics are not aware of their students’ knowledge. Keywords: spreadsheet, self-assessment, students’ and teachers’ performance.
1
INTRODUCTION
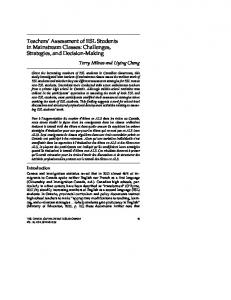
In the academic years of 2011/2012 and 2012/2013 the basic informatics knowledge of the freshmen of the Faculty of Informatics of the University of Debrecen was tested, 695 students altogether. The participants were of the three BSc (Software Engineering (SOE), System Engineering (SYE), Business Information Management (BI)), the one BA (Library and Information Sciences (LIS)), and the one MSc courses of the faculty (Teachers of Informatics (TI)), 354 students in the first year and 341 students in the second year. In the academic year of 2012/2013 the project was widened, and prior to the actual test a selfassessment test was carried out. In this test various categories of Informatics and Computer Sciences were listed and the participants were asked to mark their knowledge in the point sub-fields on a 6point Likert scale. Among the listed sub-fields spreadsheet was one. In the academic year of 2011/2012, following the test of the students of faculty, teachers of Informatics were tested. The test was sent to all the primary and secondary schools of Hungary, asking the teachers of Informatics to participate in the project. Finally, 134 teachers volunteered and their tests were evaluated in the project. The teachers’ questioner consisted of the original test of the students’, and two additional sections were attached to each question. In the first attachment the teachers were asked to guess the students’ performance, and give a percentage of how the students solved the problem. In the second attachment they were asked to mark on a 6-point Likert scale that how important the question is (1: not important at all, 5: very important).
Figure 1 Teachers’ opinion sheet on the results of the students and on the importance of the task
Proceedings of EDULEARN13 Conference 1st-3rd July 2013, Barcelona, Spain
0949
ISBN: 978-84-616-3822-2
Finally, the test was expanded with the students’ maturation exam results in Informatics, and the country-wide maturation exam results in Informatics. We have to note, however, that in the comparison of the students’ and country-wide results of the maturation exams the projects had to deal with the problem that students did not mark the year of their maturation exam ([7], [24]). Since there is no available data in which year the students pass their maturation exam in Informatics we decided on analyzing their age distribution. The frequency distribution of the age of the students shows that 70% of the students started their university studies at the age of 18 or 19. We have to note however, that the country wide results of the maturation exams in year 2011 and 2012 clearly show that there is no significant difference between the two years (Table 3). Consequently, these two pairs of data, the maturation exam results of the years of the tests can be used in our analyses.
2
METHODS
2.1
Selection of the tasks
Our project focuses on the spreadsheet knowledge of students. The choice fell upon this field of Informatics because in the last 30 years spreadsheet programs have become a major financial factor in the business world. This process happened unexpectedly and almost unnoticeably, since originally these programs were meant for household usage and nothing more ([5], [9], [10], [11], [12], [16], [18], [19], [20], [21], [22], [23]). This two folded usage of spreadsheet programs lead to serious consequences which we were not prepared and not able to deal with. Most of the users, regardless of financial consequences of their performance, believe that these pieces of software are toys, easy to use, all the problems can be solved by clicking in the wizards and the results will appear by magic in cells. However, previous studies proved that 95–60% of the spreadsheets contain mistakes and these mistakes result in financial miscalculations ([1], [2], [3], [4], [6], [17], [25], [26], [27]). These previously published results led us to the testing of the freshmen of Faculty of Informatics. We were interested in how our students perform in spreadsheet. The test was carried out in a wizard-free environment, on paper, to see how students would perform in a trial-and-errors-free situation, what their real knowledge is, how they are prepared after covering spreadsheet during their elementary and high school studies.
2.2
The tasks of the test
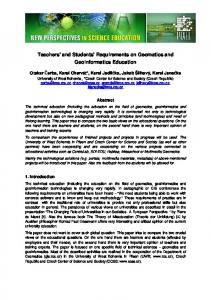
Among the spreadsheet tasks there was one theoretical question, description of functions and five exercises to solve (Figure 2 – Figure 4.) The exercises had to be solved in a simulated spreadsheet environment, where a slice of a sample table was presented (Figure 3) and questions (Figure 4), which should be answered, based on the data collected from the sample table and the instructions. In the theoretical question the built-in functions, HLOOKUP() and VLOOKUP(), and the two-level INDEX(MATCH()) function had to be compared. (We have to note that instead of one two-level function, those solutions would have been accepted where the functions separately, using substitute cells, were applied.) The two built-in functions have only restricted usage on spreadsheet data, while the two-level function has no limit on its usage. In tasks a) – d) the students were asked to write syntactically and semantically correct spreadsheet formulas. To solve task a) the spreadsheet knowledge tested in the theoretical question was needed. In task b) basic spreadsheet knowledge and some background information from Math and/or Geography were required. Tasks c) and d) required similar spreadsheet knowledge. To solve these problems the students had to be familiar with the built-in *IF?() functions, or the built-in database functions, or the single-result array formulas ([5], [6], [7]). Any of these solutions would be accepted. Task e) is a complete single-result array formula, which output was asked. The answer had to be performed in a natural language sentence.
Figure 2 The theoretical question of the spreadsheet test. The task was to give a description and a comparison of the listed functions
0950
Figure 3 The sample table of the exercises
Figure 4 The exercises of the test. Tasks a) – d) required syntactically and semantically correct formulas, while task e) is an array formula, which output was in question
3
THE AIMS OF THIS STUDY
The primary aim of the tests in September, at the beginning of the academic year was to collect information about the students’ spreadsheet knowledge. We wanted to see how they would chose functions, operators, and formulas based on the sample table and the given tasks, how they would be able to create syntactically and semantically correct formulas without any further help. The students’ results in the test were compared to their results of the maturation exams in Informatics. With this method we were able to compare the students’ computer-assisted performance with their real knowledge. By asking the students’ opinion on their knowledge of spreadsheet we wanted to see how students would evaluate their own knowledge after covering classes of Informatics in elementary and high school and gaining pieces of information through informal channels ([8], [13], [14], [15]). The teachers’ tests were meant to test their knowledge, and beyond that to see how teachers of Informatics are aware of their students’ knowledge. The importance of the tested knowledge was also part of the teachers’ questioner. We wanted to see how important the tasks were in the teachers’ opinion.
0951
4 4.1
RESULTS The spreadsheet knowledge of students and teachers
In the evaluation process not only the complete solutions were taken into accounts, but the partial solutions also. The results of the groups – students from 2011 and 2012, and teachers from 2011 – are presented in Table 1. Columns a) – e) contain the results of task a) – e), while the last column, description, represents the results of the theoretical question. Table 1 The students’ and the teachers’ results in the spreadsheet tasks. Not only were the syntactically correct answers evaluated, but those fractions also which were recognizable as correct. The results were then converted into percentages and their mean (M) and standard deviation (SD) were calculated a) year
N
M
b) SD
M
c) SD
M
d) SD
M
e)
description
SD
M
SD
M
SD
Students’ results 2011
354
11.17
24.33
20.63
27.66
22.56
33.85
7.12
25.24
26.20
31.54
3.75
9.57
2012
341
10.13
18.63
20.41
26.01
29.18
37.45
11.59
23.89
35.68
43.47
3.04
8.95
37.21
51.29
45.66
16.57
18.43
Teachers’ results 2011
134
53.18
42.64
59.49
31.64
70.51
39.99
36.71
Data in Table 1 clearly show that even evaluating the partially completed solutions the students’ results are between 10%–30% for the tasks where formulas were required (Figure 4, Table 1, columns a–d), about 36% for evaluating the given formula (Figure 4, Table 1, column e), and extremely low, only 3% for the theoretical question, the description of the functions (Figure 2, Table 1, last column). The teachers’ results show higher numbers, 37%–70.5%, 51%, and 16.5%, respectively, but still not satisfactory.
4.2
Teachers’ guess on the students’ results
In the teachers’ questioner an additional evaluation section was attached to the original task. The exercises were grouped into one group, and the teachers were asked to give percentage, the students’ assessed performance. In a similar way, a percentage was asked for the theoretical question. The teachers were also asked about the importance of the tasks. The answers had to be marked on a 6-point Likert scale (see Introduction). In connection with the importance of the tasks the same grouping of the task was used, to gain a point for the exercises and another for the theoretical question. Comparing the data in Table 1 and 2, it is clear that the teachers overestimated the students’ knowledge. Teachers think that the exercises are more important (4.45, Table 2, Teachers’ guesses on the importance of the task, exercises) than the theoretical question (4.25, Table 2, Teachers’ guesses on the importance of the task, description), but in their opinion students perform better in answering the theoretical question (41.75%, Table 2, Teachers’ guesses on the students’ results, exercises) than the exercises (39.9%, Table 2, Teachers’ guesses on the students’ results, description). The students’ result of the theoretical question was so vastly overestimated that it was even higher than the teachers’ results. The results clearly show that the teachers were not able to guess the students’ knowledge. To find explanation for the overestimation we checked the correlation between the points given for the importance of the tasks, the teachers’ guesses on the students’ performance, and the teachers’ results. In our statistical analysis the Pearson correlation coefficient was calculated. The teachers’ guesses regarding the students’ performance show significant correlation between the results of the practical and the theoretical tasks (r = 0,822, sig=0,000). Similarly, there is significant correlation between the importance of the theoretical and the practical tasks (r = 0,688, sig=0,000).
0952
Equality was examined with the paired t test. The result of the students’ performance was t = 1,740, sig = 0,084, df= 97, while that of the importance of the tasks was t = −1,784, sig = 0,077, df= 100. Our null hypothesis is that the average of the two examined variables was statistically equal. No significant connection was found in the examination of the further variables. On the one hand, we compared the teachers’ results with the teachers’ guesses concerning the students’ results: practical task: t = −5,372, sig = 0,000, df=81; theoretical question: t = −7,382, sig = 0,000, df=67. It was followed by the examination of the teachers’ results and the values evaluating the importance of the tasks, practical task: t = 6,228, sig = 0,000, df=82; theoretical question: t = −19,702, sig = 0,000, df=67. On the basis of the statistical analysis it is obvious that there is no connection between the teachers’ achievements and the evaluation of the students’ performance by the teachers. Similarly, there is no significant connection between the teachers’ results and the values of the evaluation of the importance of the tasks by the teachers. These results would be explained by the teachers’ unsatisfactory performance, which is especially critical on the description of the listed functions. Table 2 Teachers’ guesses on the students’ results and on the importance of the tasks N
M
SD
Std. error
Min.
Max.
1
100
1
6
0
100
1
6
Teachers’ guesses on the students’ results exercises
134
39.90
22.10
2.22
Teachers’ guesses on the importance of the task exercises
134
4.45
1.30
0.13
Teachers’ guesses on the students’ results description
134
41.75
23.24
2.32
Teachers’ guesses on the importance of the task description
4.3
134
4.25
1.22
0.12
Results of the maturation exams
The students’ test results were compared to their results in the maturation exam, to the average results of the country in the maturation exam, and to the average spreadsheet results of the country in the maturation exam (Table 1 and Table 3). The data clearly show that the students of Informatics of our faculty had higher results in the maturation exam of Informatics than the average of the country, which means that their performance in the test is better than the average. Table 3 The average of the maturation exam results of the country and of the students of the Faculty of Informatics Middle level Informatics
Upper level Spreadsheet
Informatics
Spreadsheet
The average result of the country 2011
54.5
40.9
55.1
71.7
2012
57.5
42.6
61.2
66.1
The average result of the students of Informatics (spreadsheet results are approximation) 2011
82.68
62.05
68.85
89.59
2012
82.00
60.75
69.60
75.17
0953
4.4
Students’ self-assessment
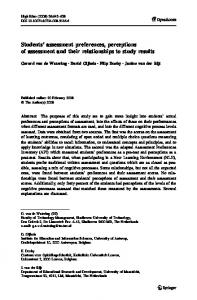
The students’ self-assessment values were converted into percentages to be able to calculate the difference between the self-assessment values and the test results. The average of the selfassessment values was 60%, which is much higher than the students’ results in the test (Table 1), but lower than their maturation exam results (Table 3).
Figure 5 Difference between the students’ self-assessment and the maturation exam results, and the self-assessment and the test result The frequencies of the differences – calculated from the students’ test results, their maturation exam results and their self-assessment values – are mapped in Figure 5It is clear from the frequency groups that in the students’ opinion their maturation results are much higher than their real knowledge. On the other hand, the frequency groups gained from the comparison of their self-assessment and their real knowledge show that their actual knowledge is much lower than their self-assessment: actual knowledge < self-assessment < maturation exam result After the comparison of test results the self-assessment values of those who scored below average and above average were compared. In year 2012 42% percent of the students scored above average. The average of their test result was 41.94% and the average of their self-assessment was 63.05%. The average of the test results of those who scored below average was 6.75% and their selfassessment 57.83%. Students doing poorly in the test predicted less accurately their knowledge. These results are in accordance with previously published results ([15]). However, the overestimation of spreadsheet knowledge is higher than it was predicted by previously published results from other sciences ([14]).
5
CONCLUSION
The spreadsheet knowledge of the students of the Faculty of Informatics of the University of Hungary, Debrecen was tested in 2011 and 2012. Two additional questioners and further exam results of the students were added to the original test. The students’ maturation exam results and their selfassessment values were analyzed and compared to their test results. In addition to the students test teachers of Informatics were asked to fill in the same test and guess the students’ results and the importance of the tasks. The results of the statistical analyses clearly show that the students predicted that their actual knowledge (60%) is lower than their maturation exam results (82% middle level, 69% upper level), but predicted their knowledge much higher than their actual knowledge (10.13% – 35.66% on the exercises and 3.04% on the description of functions). The performance of the teachers of Informatics was 54,22% in the practical tasks and 16,54% in the theoretical question. The achievement of the teachers of Informatics is thought to be extremely poor. Furthermore, a question arose whether the teachers are capable of estimating the students’ achievements with such teachers’ performance.
0954
In the teachers’ opinion the exercises are more important than the description of the functions, and they estimated that the students showed better performance in description tasks than in the practical ones. Therefore the teachers consider the description tasks important, but neither they nor the students can perform better in theoretical tasks than in the practical exercises. Being aware of these results it is not surprising that no significant connection was found between the teachers’ achievements and the students’ performance estimated by the teachers and the values of the importance of the tasks. The results of our statistical analyses would be alarming, since our teachers have no knowledge, based on which they would be able to evaluate their students’ knowledge. Consequently, the students are not able to evaluate their knowledge and these hiatus would lead to those spreadsheet documents which 95–60% contains errors.
ACKNOWLEDGEMENT The research on which this article was based was supported by OTKA (K-105262).
REFERENCES [1]
Angeli, C. (2013). Teaching spreadsheets: A TPCK perspective. In Kadijevich, Dj. M., Angeli, C., & Schulte, C. (Eds.). (2013). Improving Computer Science Education. New York and London: Routledge; p. 132-145.
[2]
Bransford, J.D., Brown, A.L. , Cocking, R.R., Ed. (2004). How People Learn: Brain, Mind, Experience, and School, Washington, D.C.: National Academy Press.
[3]
Ceruzzi, P. E. (2000). A History of Modern Computing, The MIT Press.
[4]
Cox, M. T. (2005). Metacognition in computation: A selected research review. Artificial Intelligence, 169 (2), 104–141.
[5]
Csernoch, M. (2012). Introducing Conditional Array Formulas in Spreadsheet Classes. EDULEARN12 Proceedings. Barcelona, Spain. 2-4 July, 2012. Publisher: IATED, 7270–7279.
[6]
Csernoch, M. & Balogh, L. (2010). Algoritmusok és táblázatkezelés – Tehetséggondozás a közoktatásban az informatika területén. Magyar Tehetségsegítő szervezetek szövetsége, Budapest.
[7]
Csernoch, M. & Biró, P. (2013). Button-up technikák hatékonyságának vizsgálata informatika szakos hallgatók táblázatkezelés-oktatásában. Szerk: Kozma Tamás és Perjés istván, Új kutatások a neveléstudományokban, ELTE Eötvös Kiadó, 2013, Accepted.
[8]
Csíkos, Cs. (2006). Metakogníció. A tudásra vonatkozó tudás pedagógiája. Műszaki Kiadó. Budapest.
[9]
Kadijevich, Dj. (2009). Simple spreadsheet modeling by first-year business undergraduate students: Difficulties in the transition from real world problem statement to mathematical model. In M. Blomhřj & S. Carreira (Eds.), Mathematical applications and modeling in the teaching and learning of mathematics: Proceedings the 11th International Congress on mathematical Education, Mexico, 241-248.
[10]
Kadijevich, Dj. (2013). Learning about spreadsheet. In Kadijevich, Dj. M., Angeli, C., & Schulte, C. (Eds.). (2013). Improving Computer Science Education. New York and London: Routledge; p. 19-33.
[11]
Kiss, G. (2009). The survey measuring the informatics skills of the entering Students at Budapest Tech, Bánki Donát Faculty of Mechanical and Safety Engineering / 7th IEEE International Symposium on Intelligent System and Informatics, Subotica, Serbia, 395-397.
[12]
Kiss, G. (2011). The survey measuring the informatics skills by genders of Hungarian grammar school students. 6th IEEE International Symposium on Applied Computational Intelligence and Informatics (SACI 2011), Timisoara.
[13]
Koriat, A., Levy-Sadot, R. (2000). Conscious and Unconscious Metacognition: A Rejoinder. Consiousness and Cognition. (9). 193–202.
0955
[14]
Krajc, M., Ortmann, A. (2008). Are the unskilled really that unaware? An alternative explanation. Journal of Economic Psychology, 29(5), 724–738.
[15]
Kruger, J., Dunning, D. (1999). Unskilled and unaware of it: How difficulties in recognizing one's own incompetence lead to inflated self-assessments. Journal of Personality and Social Psychology, 77, 1121-1134.
[16]
Panko, R. R. (2008). What We Know About Spreadsheet Errors. Journal of End User Computing's. Special issue on Scaling Up End User Development. (10)2, 15-21.
[17]
Peter Sestoft (2010). Spreadsheet technology. Version 0.12 of 2012-01-31. IT University Technical Report ITU-TR-2011-142. IT University of Copenhagen, December 2011.
[18]
Powell, S. G., Baker, K. R., Lawson, B. (2008). A critical review of the literature on spreadsheet errors. Decision Support Systems, 46(1), 128–138.
[19]
Powell, S. G., Baker, K. R., Lawson, B. (2009a). Errors in operational spreadsheets. Journal of Organizational and End-User Computing, 1(3), 4–36.
[20]
Powell, S. G., Baker, K. R., Lawson, B. (2009b). Impact of errors in operational spreadsheets. Decision Support Systems, 47(2), 126–132.
[21]
Tort, F. (2010). Teaching Spreadsheets: Curriculum Design Principles. In S. Thorne (Ed.), lProceedings of the EuSpRIG 2010 conference: Pratical steps to protect organisations from outof-control spreadsheets, p 99-110.
[22]
Tort, F., Blondel, F.-M., Bruillard É. (2008). Spreadsheet Knowledge and Skills of French Secondary School Students. R.T. Mittermeir and M.M. Sysło (Eds.): ISSEP 2008, LNCS 5090, 305–316, 2008. Springer-Verlag Berlin Heidelberg.
[23]
W1 (2013). The Anosognosic’s Dilemma: Something’s Wrong but You’ll Never Know What It Is (Part 1, forrás: http://opinionator.blogs.nytimes.com/2010/06/20/the-anosognosics-dilemma-1/ Retrieved April 8, 2013.
[24]
W2 (2012). Tantárgyankénti statisztika. https://www.ketszintu.hu/publicstat.php. Retrieved November 18, 2013, from .https://www.ketszintu.hu/publicstat.php?stat=_2010_1&reszletes=1&eta_id=52.
[25]
Wakeling, D. (2007). Spreadsheet functional programming. JFP 17(1), 131–143, 2007. Cambridge University Press.
[26]
Walkenbach, J. (2003). Excel2003 Formulas. John Wiley & Sons.
[27]
Walkenbach, J., Wilcox, C. (2003). Putting basic array formulas to work. http://office.microsoft.com/en-us/excel-help/putting-basic-array-formulas-to-workHA001087292.aspx?CTT=5&origin=HA001087290. Retrieved May 8, 2012.
[28]
Wilcox, C., Walkenbach, J. (2003). Introducing array formulas in Excel: http://office.microsoft.com/en-us/excel-help/introducing-array-formulas-in-excelHA001087290.aspx. Retrieved April 12, 2013.
0956