EDUCATIONFORUM INQUIRY LEARNING
Teaching and Assessing Knowledge Integration in Science Marcia C. Linn,1* Hee-Sun Lee,2 Robert Tinker,3 Freda Husic,1 Jennifer L. Chiu1
tudents grapple with multiple, conflicting, and often confusing ideas while they learn scientific concepts. Research has shown that instruction is both effective and durable when teachers use students’ ideas as a starting point and guide the learners as they articulate their repertoire of ideas, add new ideas including visualizations, sort out these ideas in a variety of contexts, make connections among ideas at multiple levels of analysis, develop ever more nuanced criteria for evaluating ideas, and regularly reformulate increasingly interconnected views about the phenomena (1, 2). We refer to this process as knowledge integration. Common testing procedures emphasize recall of scientific information over deep understanding of science reasoning (3), and as a result, teachers focus most of their time on “covering” the many required topics. This approach leaves teachers with little time to help students integrate their ideas (4) or engage in scientific inquiry as mandated by national standards (5, 6) and leaves students with isolated ideas, little understanding of science reasoning, and a perception that science is not relevant to everyday life (7). The Technology-Enhanced Learning in Science (TELS) Center has developed interactive lessons that improve inquiry learning by strengthening knowledge integration and taking advantage of visualization technologies in both instruction and assessment. TELS designs visualizations of scientific phenomena (8) and embeds them in instructional modules (see figure, above) to help students integrate their ideas (9, 10). The TELS Center created two modules each for the science courses most common in middle school (life, physical, and earth sciences) and high school (biology, chemistry, and physics). Topics selected were those from the
ment. We used this comparison sample of 4328 students to analyze the overall impact of TELS modules and the impact of TELS by science course and teacher.
S
1Graduate
School of Education, University of California, Berkeley, CA 94720, USA. 2Department of Education, Tufts University, Medford, MA 02155, USA. 3Concord Consortium, Concord, MA 01742, USA. *Author for correspondence. E-mail:
[email protected]
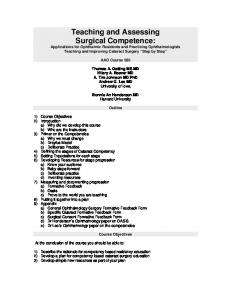
TELS Modules Designed by partnerships of discipline experts, learning researchers, classroom teachers, and technology specialists using A visualization example in the Chem- the Web-based Inquiry Science ical Reactions module. Students, Environment (WISE), TELS guided by the navigation bar on the left, explore conservation of mass, lim- modules guide students in iting reagents, and dynamic equilib- research-based knowledge interium. With this visualization, students gration practices using an onexamine the effects of heat and number of molecules on chemical reac- line map and embedded assesstions and explain their ideas in embedded notes shown on the left (21). ments (11, 12). TELS modules make science visible by represcience standards that teachers say are most chal- senting unseen phenomena such as molecular lenging. TELS designed assessments to measure reactions (13). They showcase the relevance knowledge integration about the module topics. of science with current scientific dilemmas such as choosing among treatment options for Participants and Design cancer, interpreting claims about global TELS studied two time-delayed cohorts of stu- warming, or selecting an energy-efficient car. dents. We recruited teachers in 16 schools One life science module connects the design across five states and assessed the performance of a cancer medication to a visualization of the of their students at the end of one school year stages of mitosis. A physics module allows after they studied the typical curriculum (3712 students to experiment with variables governTypical Cohort students) using TELS assess- ing deployment of airbags. Teachers can ments in six courses. The next year, we offered access student ideas online in real time and teachers at these schools one or two 5-day use them to tailor instruction. TELS modules to use instead of their previous The TELS high school chemical reactions treatment of comparable content. We tested the module uses an interactive visualization (see performance of new students in the same figure, above) to help students explore factors schools who had the opportunity to study TELS influencing greenhouse gases. The inquiry map (4520 TELS Cohort students) at the end of the guides students to articulate their ideas, test second school year, using a subset of the items their predictions, critique each other’s views, from the first year that aligned with TELS mod- and distinguish new and elicited ideas. Typical ules as well as new items that served as a base- chemistry students have difficulty connecting line for future modules. We used this assess- symbolic and visual representations of reacment sample of 8232 sixth- to twelfth-grade tions and often fail to account for conservation students to analyze item properties of multiple of mass and the effects of heat and temperature. choice and explanation items in both years of Static representations in textbooks lead some TELS assessments. Twenty-six of the 43 teach- chemistry students to report that molecules are ers participated in both Typical and TELS malleable or colored and to argue that moleCohort assessments and taught one or two cules stop moving after they react (14, 15). TELS modules in the subject area of the assess- The TELS chemical reactions module helps
www.sciencemag.org
SCIENCE
VOL 313
Published by AAAS
25 AUGUST 2006
Downloaded from www.sciencemag.org on August 15, 2012
Interactive visualizations combined with online inquiry and embedded assessments can deepen student understanding of complex ideas in science.
1049
EDUCATIONFORUM topic they had studied but also learned to construct arguments, critique explanations written by their 2 peers, and respond to feedback from their teachers. Just as students 1 gain some advantage from experience with multiple-choice items 0 Physical* Life*** Earth*** Physics Chemistry*** Biology ALL*** (20), so might students benefit Science content areas from experience constructing sciExplanation item performance of Typical and TELS Cohorts. TELS modules led entific explanations as encouraged to significant improvement in knowledge integration scores for physical science, in TELS modules. life science, earth science, and chemistry. *P < 0.05, **P < 0.01, and ***P < 0.001. TELS technologies enable stuKnowledge integration: 0 = no answer/off-task, 1 = no link, 2 = partial link, and dents to connect scientific visual3 = full link. The TELS cohort significantly outperformed the Typical Cohort on the explanation items, with an effect size (ES) = 0.32***, as well as within all middle izations to their understanding of school course levels (physical, ES = 0.16*; life, ES = 0.35***; earth, ES = 0.64***) complex scientific ideas. They help and within the high school chemistry course (ES = 0.81***). Students moderately guide students to make sense of improved on physics (ES = 0.09) and biology (ES = 0.11). visualizations rather than viewing TELS Assessments and Scoring them as amusing movies. These To measure inquiry skills as defined by the explanation items, TELS resulted in improve- connections can benefit students in their future science standards, TELS created assessments ment equal to more than a quarter of a standard courses, prepare students to deal with scientific composed of multiple-choice and explanation deviation (Typical mean = 1.52; TELS mean = dilemmas, and encourage learners to view items that asked students to connect ideas in 1.78, effect size = 0.32, P < 0.001). As computer-presented information more critically. arguments. TELS researchers created tests for expected, because the explanation items are References and Notes each of the six courses that include items from better able to discriminate levels of knowledge 1. M. C. Linn, E. A. Davis, P. Bell, Eds., Internet our research as well as items published by integration, they showed more sensitivity to Environments for Science Education (Lawrence Erlbaum national, international, and state assessments. instruction. We analyzed TELS, teacher, and Associates, Mahwah, NJ, 2004). We scored all of the multiple-choice items science-course effects and found significant 2. M. C. Linn, in Cambridge Handbook of the Learning Sciences, R. K. Sawyer, Ed. (Cambridge Univ. Press, New dichotomously. We used the TELS knowledge effects for TELS and teacher (16). ImproveYork, 2006), pp. 243–264. integration rubric to capture progressively ment was similar across science courses and 3. L. Stern, A. Ahlgren, J. Res. Sci. Teach. 39, 889 (2002). more sophisticated levels of reasoning on individual comparisons were significant for 4. N. B. Songer, Congressional Testimony; full text available online (edworkforce.house.gov/hearings/109th/21st/ explanation items (16). four of the six courses (see figure, above). mathscience051905/songer.htm). We analyzed the properties of all 201 items Teachers varied in their access to technol5. National Research Council, National Science Education administered to the assessment sample (16). ogy, experience with inquiry, prior knowledge Standards (NRC, Washington, DC, 1996). 6. S. H. Singer, M. L. Hilton, H. A. Schweingruber, Eds., We found that the items were highly corre- of their students, and experience with technolAmerica’s Lab Report (National Academic Press, lated and that 97.5% measured the same ogy, all of which could contribute to the teacher Washington, DC, 2005). dimension of learning. In addition, higher effect. We expect TELS effects to become more 7. M. C. Linn, S. Hsi, Computers, Teachers, Peers: Science scores in each explanation item were obtained consistent as teachers gain experience and we Learning Partners (Lawrence Erlbaum Associates, Mahwah, NJ, 2000). by students who were estimated to have higher use embedded assessments along with teacher 8. Q. Xie, R. Tinker, J. Chem. Edu. 83, 77 (2006). knowledge integration abilities. feedback to improve the modules. These find9. Y. Bhattacharjee, Science 310, 224 (2005). Overall, 98% of the 83 explanation items ings also underscore the importance of profes- 10. TELS Center (telscenter.org). scored with knowledge integration rubrics sional development. Teachers in TELS have 11. M. C. Linn et al., Edu. Tech. 46, 54 (2006). were highly capable of discriminating respon- asked for additional opportunities to learn the 12. J. D. Bransford et al., Eds., How People Learn (National Academy Press, Washington, DC, 1999). dents with high knowledge integration abilities pedagogy of knowledge integration. 13. The visualizations were created using Concord from those with low knowledge integration Consortium (molo.concord.org) solftware. 14. R. Ben-Zvi et al., J. Chem. Edu. 63, 64 (1986). abilities. Only 16% of the 118 multiple-choice Discussion 15. R. Ben-Zvi et al., Edu. Chem. 24, 117 (1987). items showed similar discrimination. Of When students engage in inquiry and learn to 16. Materials and methods are available on Science Online. multiple-choice items, 39% did not have integrate their ideas, they are prepared to apply 17. J. A. Shymansky et al., J. Res. Sci. Teach. 20, 387 (1983). acceptable discrimination indices (16). what they learn in science classes to contexts 18. D. F. Walker, J. Schaffarzik, Rev. Edu. Res. 44, 83 (1974). D. B. Clark, M. C. Linn, J. Learn. Sci. 12, 451 (2003). beyond the classroom. For schools to teach 19. 20. L. A. Shepard, Edu. Res. 29, 4 (2000). Student Performance inquiry and knowledge integration, both in- 21. The animated visualization is available online (http://telscenter.org/Videos/ChemModel.mov). The 26 teachers in the cohort comparison study struction and assessment need to change. Our spent between 2 and 10 days implementing the findings and other similar studies show that 22. Based on work supported by NSF under grants 0334199 and 0455877. Any opinions, findings, and conclusions or TELS modules. A few teachers had to shorten typical multiple-choice science assessments recommendations expressed in this material are those of their lessons due to school scheduling, but 31% are not sensitive to instruction designed to prothe authors and do not necessarily reflect the views of the NSF. We thank O. L. Liu for help with the psychometcompleted two modules. mote coherent (17, 18) or deep understanding ric analysis, anonymous reviewers for helpful comments, To determine the impact of TELS, we used of science topics (19). and the TELS partners and the TELS schools for their dedi50 items that were administered to both cohorts Assessments that require students to link cation to improving science learning. and aligned with the modules. Overall, for the and connect ideas clarify what we mean by multiple-choice items, TELS had no impact inquiry learning and have the potential of stim- Supporting Online Material www.sciencemag.org/cgi/content/full/313/5790/1049/DC1 (Typical mean = 55.0% correct; TELS mean = ulating lifelong scientific understanding. TELS 54.8% correct; effect size = 0.007). For the students not only gained understanding of the 10.1126/science.1131408
1050
3
Typical
25 AUGUST 2006
TELS
VOL 313
SCIENCE
Published by AAAS
www.sciencemag.org
Downloaded from www.sciencemag.org on August 15, 2012
Knowledge integration
students sort out these ideas using an interactive visualization with which students can gather evidence about limiting reagents and study the relationship between molecular behavior and temperature by modifying inputs such as temperature or proportions of reactants (16). TELS modules help students act like scientists, comparing viewpoints, generating criteria for selecting fruitful ideas, fitting ideas together in arguments, gathering evidence for their own views, and critiquing the arguments generated by their peers.