International Journal of Computer Science and Telecommunications [Volume 3, Issue 2, February 2012]
42
Classifying Program Visualization Tools to Facilitate Informed Choices: Teaching and Learning Computer Programming ISSN 2047-3338
Mutua Stephen1, Wabwoba Franklin1, Ogao Patrick2, Anselmo Peter1 and Abenga Elizabeth1 1
Masinde Muliro University of Science and Technology 2 Kenya Polytechnic University College {stephen.makau, fwabwoba, ogaopj}@gmail.com,
[email protected],
[email protected]
Abstract– Program Visualization (PV) is a technique that has been found useful in teaching computing programming. This has seen proliferation in development of PV tools with an aim of enhancing teaching/learning programming over the last two decades. However, the tools usage has remained minimal. Perhaps because it becomes challenging to ascertain the appropriate tool for the right task. This paper presents a classification of program visualization tools with the focus of aiding teachers and students in choosing the most appropriate tool for an interesting experience in the classroom. The paper is based on six various PV tools evaluated over a period of two consecutive academic years in a Kenyan public University. The classification augments the Price’s taxonomy of software visualization arm of PV by presenting four basic levels which are further subdivided into lower levels. Index Terms– Classification, Pedagogy, Program Visualization and Taxonomy
I.
INTRODUCTION
P
ROGRAMMING is a course/subject in Computer Science and related fields, and some Engineering disciplines. It plays a core role that is applicable in both academic and career developments. However, learning how to program is a challenging and complex process that requires support of proper educational tools [1]. Teaching and learning programming has over time proved to be a universal problem not only to the students but also to teachers. This is clearly evident on novices [2] learning the basics of programming, as well as teaching advanced programming concepts like algorithms and data structures. This may be attributed to its abstractness [3] and that the students lack concrete models in their everyday life to handle the concepts at hand [2]. Nevertheless, the pedagogical approaches used in teaching the programming courses may be a contributing factor towards the poor performance and understanding of this crucial course. Over the past three decades, several program visualization (PV) tools have been developed to aid in teaching introductory courses of programming. The trials of these tools in varied Universities and other institutions have posted positive results as various students have shown significant
Journal Homepage: www.ijcst.org
improvement of performance [4] [5]. For instance, [6] found that students who actively used the JEliot [7] PV tool improved their learning results compared to a control group that did not use it. The [8] showed that proper use of PV tools increases the attention and enhances interest of students to the concepts being taught. In their study, [9] assert that usage of VILLE tool, enhanced students’ learning regardless of their previous programming experience. In spite of all these positive postings, they have not attracted an extensive usage [10] as earlier anticipated despite the mass resources consumed by researchers and developers. It is however evident that teachers and students are not against their usage, but are facing the challenge of choosing the right tool for the right job, and the time required to study and integrate the tool within the syllabus appropriately. Perhaps a proper guideline can assist in choosing the right tool to use. In this bid, several taxonomies have been developed but none is comprehensive enough with a focus in pedagogy. The most commonly known being Price’s principled taxonomy of software visualization (SV) [11], it is relatively general and the focus is not pedagogic. Karavita’s taxonomy [12] of algorithm animation languages (AAL) is one such comprehensive classification but does encompass the PV tools. In this paper, we present taxonomy of PV tools with focus in pedagogy. The classification is developed on four categories of Interface, Pedagogy, Visualization and Metalanguage. The Interface category describes the visual representations used by the tool and how the user interacts with it. Pedagogy details the various desirable educational features that ought to be considered when choosing a tool; while Visualization which is closely related to interface is considered as independent as it is the core of any such tool. Ultimately the last category is a collection of other independent factors that go beyond the tool itself but are crucial. The rest of this paper is as follows; Section 2 entails some previous related works. Section 3 describes the tools evaluated in development of the classification. Section 4 presents that classification itself and finally, section 5 is the conclusion and recommendations.
Mutua Stephen et al. II.
RELATED WORK
Taxonomies have been used in different fields of natural and social sciences over years. Taxonomies provide common and generalized classifications which help in recognizing and solving problems. They have also led to intensive researches towards finding solution to certain problems. Brad [13] present the taxonomy of PV using code, algorithms and data, and their presentation as either being static or dynamic. This taxonomy is unclear and it appears to have been an early attempt to distinguish PV and visual programming (VP). There is also an overlap of Algorithm Visualization (AV) and PV tools an indication that these two had not been clearly separated by the date of its publication. Even though the focus is pedagogy, the taxonomy is not comprehensive enough to aid one in choosing from several tools aimed at teaching the same language. Price’s [11] forms one of the most thorough taxonomies in SV. It encompasses two broad fields of research in SV which are AV and PV. Its framework is the work done earlier by [13] and clarifies the concepts presented earlier. The taxonomy is built on top of six features of scope, content, form, method, interaction and effectiveness. Appreciating the concerted efforts of Price and others, we notice that the taxonomy needs specification and clarification with respect to the various fields of SV. The taxonomy presents an overlap of PV tools and VP languages. This is captured in the content category of the taxonomy which is further broken into code and data animation. The data sub-category also seems misplaced since it focuses on the visualization of data structures which do not form part of the PVs. Most of the tools evaluated are for AV and this maybe explains why the shallow end on PV. Naps and others [14] provide engagement taxonomy of learners with visualization tools. They use six different forms of student interaction with the tools and classify the effectiveness of each. The [21] extends this taxonomy to make it more comprehensive. Sensalire, Ogao and Telea [15] classify the desirable features of a visualization tool into four categories namely effectiveness, tasks supported, techniques used and availability. Their classification is however for use in corrective maintenance thus inappropriate for usage in pedagogy. Among the latest taxonomies in software visualization is the comprehensive taxonomy of algorithm animation languages [12]. Theirs is a well detailed taxonomy whose focus is educational objectives and also technical. It is based on the ITiCSE working group [16] which identifies six fundamental elements to visualization systems as objects that are the focus of visualization, graphical primitives (squares, circles, lines, etc.), transformations on graphical primitives (e.g., scaling, rotation), narration (text, graphics, audio), questions and feedback inserted in an animation system, and meta-data that describes the content of an animation. From these, they develop a taxonomy consisting three building blocks which include vocabulary which describes the amount of supported object types, positioning which describes the various means of positioning objects in the animation and style which measures the variety of styling options available
43
in the language. It however only focuses on AV tools and they are very categorical that PVs were not considered at all in their study. III.
PROGRAM VISUALIZATION TOOLS EVALUATED
The key criteria that was used in identifying the tools was their availability (freely available tools) which could be used in teaching object oriented programming using the JAVA and/or C++ language. A. JELIOT31 JELIOT3 was developed at the University of Joensuu to aid learning and teaching procedural and object oriented programming (OOP) [7]. This tool is limited only to Java programming language which is just one of the many OOP languages. Even so, it does not recognize certain standard Java keywords and functions and felt that this might be confusing to students who are weak hence making it difficult for them to switch to using an ideal Java Integrated Development Environment (IDE). For instance consider the following Java vs. JEliot’s statements; Java 1. System.out.println(“x”); 2. System.out.print(); JEliot 1. Output.println(“x”); 2. Output.print(); Both 1and 2 are statements that are used to print something on the computer screen. Standard Java uses the keyword System while JEliot3 contains an inbuilt class called Output which defines the standard output stream. Not bad of course. However, it is evident in statement 2 that this class is not as comprehensive as System is, and does not encompass all the output Java output functions. If written in JEliot3.7.2 as it is (Output.print()), it generates an error which is corrected as Output.print(‘’ ’’); implying that the print() and println() functions which are well defined and commonly used in Java are lacking. B. JEROO2 It was designed to help students in beginning programming courses learn the semantics of fundamental control structures, learn the basic notions of using objects to solve problems, and learn how to write methods that support a functional decomposition of the task [2]. The tool is designed in such a way that it provides a smooth changeover between JAVA, C++ and C#. However, this tool requires some deeper understanding for its efficient use. This is because it is developed metaphorically from the behavior of Jeroo which is a rare Kangaroo-like animal found in Pacific
1
http://cs.joensuu.fi/jeliot/downloads/jeliot372.php
2
http://www.nwmissouri.edu/~sanders/Jeroo/Jeroo.html
International Journal of Computer Science and Telecommunications [Volume 3, Issue 2, February 2012] Islands [2]. It thus limits its users to the people around the Pacific Islands who know the behavior of a Jeroo. C. BlueJ3 BlueJ [17] has received a wide acceptance also in teaching JAVA object-oriented features to novice students. It is developed to gradually introduce OO concepts. It uses the UML standard representation hence forming a very good tool to introduce OOP concepts like data abstraction and encapsulation, inheritance and polymorphism, message passing among others which are normally difficult for students to grasp. However, it does not contain the animations of the source code but generates sample JAVA code from the classes developed by the user which can as well be modified using the editor.
44
focused on introducing object oriented programming concepts using the syntax of Java, C++ and C#. Though an interesting environment, Alice is too basic to be used in a tertiary institution for teaching. This is because it does not provide a smooth transition to a real programming environment and thus may be a point of confusion. IV.
METHODOLOGY
VILLE [9] is a program visualization tool, used to create and edit programming examples and to observe events in the examples during their execution. Its intention is to support novice programmers’ learning process. It is a well featured tool that can visualize JAVA, Visual Basic, Python, C++ and Pseudo-code. Due to its multiple support of programming languages, it provides a parallel view of code in the languages chosen. This is a very strong feature since one can write a program in the language is well informed and the tool converts the same to another language of choice.
The study was conducted within a Kenyan public University in Western province of Kenya. It was undertaken in a span of eight months in which two classes were taught computer programming. Since the focus was an introductory programming course, it involved first and second year computer science and information technology (IT) students. In their first year of study, students were taught procedural programming and object oriented programming using C++; while in their second year the students were taught Java. An initial seminar was conducted to orient students to the various PV tools. The students were then provided with various tools and then given the liberty to choose one. Afterwards, they were issued with questionnaires which mainly sought to ascertain the factors they considered in the choice. In addition to this, five lecturers who teach computer programming in the University were interviewed and the results used to complement the results collected from the students; all which were used in formulating the classification considering the various existing ones.
E. JGRASP 5
V.
D. VILLE4
Developed by [18], JGRASP is more of a Java IDE (Integrated development Environment) but with visualization capabilities. Though Java based, it has the capability of visualizing other languages like C, C++ and Ada, all to which it can generate Control Structure Diagrams (CSDs) which are used to visualize a program source code and design. It also generates UML (Unified Modeling Language) diagrams and complexity profile graphs (CPG) for Java code as well as multiple views of source code, low-level objects, and highlevel visualizations. Its visualizations are static hence it is not very interactive. It also does not provide code highlighting and thus requires one to have some considerable knowledge of programming. It is thus probably not a very appropriate tool for novices. F. ALICE
6
This is a tool that was developed with the objective of making the first programming experience hilarious and attractive. This was done with the goal of attracting more girls into the computer science field. Developed by [19], Alice is 3
http://www.bluej.org/download/
4
http://ville.cs.utu.fi/
5
6
http://www.jgrasp.org/ http://www.alice.org/
CLASSIFICATION OF PROGRAM VISUALIZATION TOOLS
The proposed classification is build on top of four categories of Interface, pedagogy, Visualization and MetaLanguage. A. Interface In this classification, interface refers to the elements and objects displayed by the PV system to facilitate the user to interact with the tool. This term is borrowed from GruiaCatalin’s taxonomy [20], but with modification and regrouping to reflect the current situation of PV tools. This category contains two other sub-categories; 1) Visual Representations: These are the types of visual cues that have been utilized in the system to provide visualization. They may include any of the following or a combination; Primitive Representation: These can further be grouped into simple or composite objects, and worlds as described by [20]. Standardized Representation: This refers to those visual cues within a program that are universally acceptable. An example is the use of UML diagrams or flow charts to visualize the program.
Mutua Stephen et al.
45
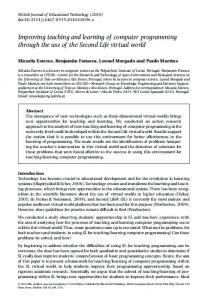
B. Pedagogy Program Visualization System
Interface
Pedagogy
This category comprises the various elements that are crucial for any teaching objective. It explains the factor(s) that should be considered when choosing any PV tool that is intended to be used in the classroom. The various subcategories defined under pedagogy include; MetaLanguage
Visualization
Fig. 1: Program Visualization Classification
Metaphorized Representation: If a PV tool uses this type of approach, it mimics the behavior of a certain animal, human processes or any character the designer wishes to utilize. For instance, the JEROO tool uses this representation by mimicking the Kangaroo like animal (Jeroo). 2) User Interaction: Since most of the PV tools are using the graphical user interface (GUI), it is by default that they are using some predefined controls and icons (images). Subcategories within this category are; Pre-defined: This is where the user has to follow a predefined sequence of steps within the PV system in order to achieve the visualization failure to which an error message is issued. This can be compared to extended engagement taxonomy (EET) [21] category of viewing where there is no interaction with the tool. Alice is one tool that mostly uses this approach. User-defined: Unlike in pre-defined, the program to be visualized is usually written by the user and has control over it. The system may include built-in examples, but the user has the discretion of not running any by developing his’/her’s. This can be compared to controlled view and modification levels of EET. Controlled viewing is where the student chooses what to visualize the speed of operation and can pause, replay and stop; while modification refers to the ability to modify the code before visualization Enhanced Interactivity: This is in event where the system provides further interaction modes with the user in addition to allowing definition by user. For instance, the system may generate some questions that require the user to respond to gauge his/her understanding.
1) Programming Paradigm: The focus here is the programming style that a tool supports. A programming paradigm is an elementary style of computer programming which can be compared to a methodology and defines semantics of the language. A PV tool thus is designed to visualize some language(s) which obey a certain paradigm. The paradigms to which the tool can belong to include but not limited to are; Procedural programming: The language makes use of the mathematical concepts of procedures or functions in which a problem is organized to be solved from these. Object Oriented programming: This is a current approach to computer programming which seeks to mimic the real world environment. The focus is the use of objects containing both actions and data. These objects communicate by passing messages. Logic Programming: This is an approach which uses mathematical relations and logical inferences; where various logical statements are stored in a database and used for decision making. An evaluation and simple survey showed that most PV tools are being developed to visualize OOP and very few to visualize logic programming.
Pedagogy
Paradigm
Procedural
Platform
Scope
Language Support
Programming Constructs
Language Compatibility
OOP Concepts
MultiLanguage Support
Logic
Table 1: Tools’ Evaluation on Programming constructs & Platform OOP
Programming Paradigm
Platform
Tool
OOP
Specific
ALICE BLUEJ
× ×
×
JELIOT3
×
×
JEROO
×
×
JGRASP
×
×
VILLE
×
Procedural
×
Logic
Cross
×
Fig. 2: Pedagogy Category
2) Platform: In this classification, the platform refers to the operating system within which the tool can run. A tool can be platform specific or cross-platform. If platform specific, this becomes a key factor for any learner or teacher to consider. For instance, if a tool is developed to run in the Windows platform and the platform intended to be used in the classroom is Linux; the tool will definitely not suit the objective however good it may be. Most tools are cross
International Journal of Computer Science and Telecommunications [Volume 3, Issue 2, February 2012] platform in which various formats of the same tool are developed to be run in various operating systems. For instance a version for JEliot3 can be downloaded for Linux systems, Windows and Apple systems. Generally, a good tool should support multiple platforms. 3) Scope: This is a feature that occurs in most taxonomies discussed. It however changes with the focus of the classification. In this classification, it refers to the comprehensibility of the PV tool in covering the language it visualizes. It encompasses such features as; Interface
46
Multi lingual Support: This subcategory of language support describes whether a PV tool is developed to visualize only a single language or a multiple of them. Most tools support only a single language, but there are some which support more than one and therefore the user can write a program in one language, and the tool converts the code into its equivalent in another language. This a feature that is not only good for novices, but also to advanced learners who wish to learn another language. The evaluation of the tools against the categories of scope and language-support are shown in Table 2. The results sow that most tools are fully compatible with the languages they support but do not support multiple programming languages.
Table 2: Tools’ Evaluation with respect to scope and language-support Visual Representation
User-Interaction
Primitive
Pre-defined
Standardize
User-defined
Metaphoriz
Enhanced Interactivity
Fig. 3: Interface Category
Programming Constructs: Borrowed from [12] it refers to the tool’s support of the programming buildng blocks. These include support of the basic programming elements like declarations, expressions, assignments and data types; and control constructs support. The control constructs are looping structures, decision making structures and recursion. OOP Concepts: The focus in this feature is the tools support for object oriented features. This will affect the systems designed to visualize OOP languages. A good tool is expected to support all the feaures of inheritance, polymorphism and encapsulation in a manner that can be easily understood. The scope category is dynamic and it can be extended to cover other pedagogical features that may be deemed necessary to meet the objectives of the course. 4) Language Support: This sub-category describes the systems ability to support the specific programming language(s) the tool visualizes. A tool that has been developed to aid one in learning computer programming should reflect the proper syntax of the programming language. It should be able to provide a scenario similar to the one required when partaking the real programming exercise. Language Compatibility: How well a visualization system is compatible with programming languages syntax? This is critical since it facilitates the ease at which a learner can switch from a PV tool to a real programming environment. If certain features are not in line with the real language, then this may be a point of confusion to students mostly novices. The developers of any tool should thus strive to ensure total compatibility and if not so inform their users that thei tool offers partial language support and possibly detail what.
Tool
Scope OOP Concepts
Programming Constructs
ALICE BLUEJ JELIOT3 JEROO JGRASP JIVE VILLE
ALL ALL ALL ALL ALL ALL ALL
ALL ALL ALL ALL ALL ALL ALL
Language-Support Language MultiCompatibility Lingual Partial Full × × × ×
×
×
×
C. Visualization Visualization refers to the manner in which the system presents the visual and audio cues. This category is divided into three sub-categories as illustrated in Fig. 4. Visualization
Dynamic
Static
Multimedia
Fig. 4: Visualization Category
1) Dynamic: This sub-category refers to the ability of a system to offer animated visualization. The animations may be controlled or uncontrolled where once the user executes a program code, it continues to completion without the option to stop. 2) Static: In this level, the system does not offer any animation and the visual cues are fixed on the screen with no movements. 3) Multimedia: In this sub-category, the system may not offer access to the code and includes such things like audio (voice) or video and probably some textual information that gives some explanations. D. Meta-Language In this classification, this describes all other elements that are beyond the PV system itself. It however may be
Mutua Stephen et al. controllable by the system developers. This has the subcategories; 1) Availability: How can the tool be acquired by the intended users? A tool can be made obtainable to users either as open source software, freeware or as proprietary software. 2) Installation: This concerns how the PV system will be installed in a computer for usage and its requirements. This is vital especially for novice users who may be in the process of learning various concepts of computing. For instance during the study we demonstrated the Ville tool to novice students and several of them came asking for the same which we gladly offered to them. However, after sometime, they came arguing that the installation files were not functional. Why? Most of the students had not learned Java and could not understand the issue of the JDK (Java Development kit) desired by the tools to run effectively. It is thus crucial for developers to find a means in which all the desired files can be packaged together with system for ease of installation. 3) Extensibility: As the novices continue using the tool and the skill slowly sets in, they become critical of the current features offered by the tool and desire to widen or customize them. Extensibility is thus such a vital feature that any PV tool that is intended for pedagogy should bear. This can be made possible by ensuring that the tool is open source hence the tool’s source code is available. 4) Integration: In this classification, integration refers to the ability of a tool to interwork or support features of another PV system. A good system for pedagogy should be able to incorporate or be incorporated in another PV system or IDE, either as an imported file or as a plug-in. VI.
CONCLUSION
Programming is an important subject in computing and engineering fields. To ensure proper realization of the pedagogical objectives, PV tools are inevitable. This classification is hereby proposed with the hope that teachers and students will find it useful in aiding them to choose the right tool for learning/teaching. The classification is available for extension and more categories and sub-categories can be included to promote the usage of these vital tools. We therefore recommend the usage of this classification by both learners and instructors alike. We further recommend the development of a number of PV tools to visualize logic programming. REFERENCES [1] Bednarick, R., Moreno, A., Myller, N., & E, Sutinen (2005), Smart Program Visualization Technologies: Planning a Next Step, Proceedings of the Fifth IEEE International Conference on Advanced Learning Technologies (ICALT’05) [2] Dean, S & Dorn, B. (2003), Using JEROO to Introduce ObjectOriented Programming, 33rd ASEE/IEEE Frontiers in Education Conference, November 5-8, 2003 [3] Lahtinen, S. P, Sutinen, E. & J. Tarhio (1998), Automated Animation of Algorithms with Eliot, Journal of Visual Languages and Computing, 9(3): pp.337–349 [4] Kouznetsova S, (2007), Using Bluej and Blackjack to Teach Object-oriented Design Concepts In CS, Journal of Consortium for Computing Sciences in Colleges, April 2007 (pp. 49 -55)
47
[5] Kasurinen, J., Mika, P. & Uolevi, N. (2008), A Study of Visualization in Introductory Programming, PPIG, Lancaster 2008. [6] Bassat Levy, R., Ben-Ari, M., & Uronen, P. A. (2003), The Jeliot 2000 program animation system, Computing Ed. 40,Vol. 1, pp. 15–21 [7] Moreno, A, Myller N, & Sutinen, E. (2004), Visualizing Programs with Jeliot, ACM AVI '04, May 25-28, 2004 [8] Ebel, G. & Ben-Ari, M. (2006), “Affective effects of program visualization”, In Proceedings of the 2nd International Computing Education Research Workshop (ICER’06)., pp. 1-5 [9] Rajala, T., L. Mikko-Jussi, K. Erkki, Salakoski, P. (2007), VILLE – A Language-Independent Program Visualization Tool, Seventh Baltic Sea Conference on Computing Education Research, Koli National Park, Finland, Vol. 88 November 1518, 2007 [10] Bassat, L. & Mordechai, B. (2007), “We Work So Hard and They Don’t Use It: Acceptance of Software Tools by Teachers”, ITiCSE’07, June 23–27, 2007, Dundee, Scotland, United Kingdom Copyright 2007 [11] Price, B.A., Baecker, R.M., & Small, I.S (1998), A Principled Taxonomy of Software Visualization, Journal of Visual Languages and Computing 4(3), pp. 211-266 [12] Karavirta, V.’ Ari Korhonen, Lauri Malmi and Thomas Naps (2010), A comprehensive taxonomy of algorithm animation languages, Journal of Visual Languages & Computing Volume 21, Issue 1, February 2010, Pages 1-22 [13] Myers, B., Taxonomies of Visual Programming and Program Visualization, In Journal of Visual Languages and Computing, Vol. 1, No. 1, S. 97-123, 1990 [14] Naps, T. L., Rossling, B, G., Almstrum, V., Dann, W., Fleischer, R., Hundhausen, C., Korhonen, A., Malmi, L., Mcnally, M., Rodger, S., & Vel´A Zquez-Iturbide, J. ´A. (2002), Exploring the role of visualization and engagement in computer science education., In ITiCSE on Innovation and Technology in Computer Science Education (ITiCSE’02), Working Groups Report pp. 131–152 [15] Sensalire, M., Ogao, P., & Telea, A. (2008), Classifying Desirable Features of Software Visualization Tools for Corrective Maintenance,. SOFTVIS 2008, September 16–17, 2008 [16] Naps, T. L., JHAVE: Supporting Algorithm Visualization, Computer Graphics and Applications, IEEE 25(5) (2005,) pp. 49–55 [17] Kolling, M., & Rosenberg, J. (1996), An Object-Oriented Program Development Environment for the First Programming Course, SIGSE Bulletin 28 (1), pp. 83-87, 1996 [18] Cross II J., H. & Hendrix D., T., (2007), JGrasp: An Integrated Development Environment with Visualizations for Teaching Java in CS1, CS2, And Beyond, Journal of Consortium for Computing Sciences in Colleges October 2007 [19] Kelleher, C. and R. Pausch. Lessons Learned from Designing a Programming System to Support Middle School Girls Creating Animated Stories, 2006 IEEE Symposium on Visual Languages and Human-Centric Computing. [20] Gruia-catalin, R. C & Cox, C. K., A Taxonomy of Program Visualization Systems, IEEE 1993, pp. 11-24 [21] Myler, N., Bednarik, R., Sutinen, E. and B, Mordechai (2009), Extending the Engagement Taxonomy: Software Visualization and Collaborative Learning, ACM Transactions on Computing Education, Vol. 9, No. 1, Article 7, March 2009 [22] Robins A, Rountree, J. & Rountree, N. (2003), Learning and teaching programming: A review and Discussion, Journal of Computer Science Education, Vol. 13-No. 2, pp. 137–172, 2003
International Journal of Computer Science and Telecommunications [Volume 3, Issue 2, February 2012]
Program Visualization System
Interface
Visual Representation
Pedagogy
Visualization
Programming Paradigm Dynamic
Primitive Simple
Procedural
World Standardized
OOP
Extensibility
Integration Multimedia Availability
Platform
Audio Video
Specific
Textual
Metaphorized
Installation
Static
Logic
Composite
Meta-Language
Open-source Proprietary Freeware
Cross User-Interaction
Pre-defined Tutorial Example User-defined Control Modification Enhanced Interactivity Responding
Scope Programming Constructs
Basics Control Structures OOP Concepts Inheritance Polymorphism Encapsulation Language
Language Compatibility
Multi-Lingual
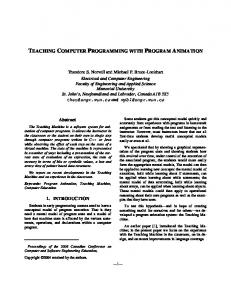
Fig. 5: Comprehensive Taxonomy of Program Visualization Systems for Pedagogy
48