Session ENT 102-006
Teaching the Significance of Data Correlation in Semiconductor Testing Rainer J. Fink, Yong-Kyu Jung, Ben Zoghi Department of Engineering Technology and Industrial Distribution Texas A&M University College Station, TX 77843-3367
[email protected],
[email protected],
[email protected] Abstract Texas A&M University offers a two-course sequence in mixed-signal semiconductor testing. Although most educational institutions offer courses in the utilization of electronic devices, very few have the state-of-the-art facilities to investigate the real life device performance. The Semiconductor Test Initiative was created as a natural interconnect between our digital and analog course sequences. Significant support from Texas Instruments, Freescale, Teradyne, as well as National Instruments allowed the creation of a state-of-the-art semiconductor testing facility to support research and academics. In a real-life scenario, data acquired from a single testing source is suspect until verified using a second trustworthy testing resource. This concept is investigated using two device families: Digital-to-Analog Converters as well as Analog-toDigital Converters in a course entitled Advanced Mixed-Signal Test and Measurement. Using resources in the Texas Instruments Mixed-Signal Test Laboratory at Texas A&M University, results obtained using National Instruments LabVIEW and DAQ hardware are compared to data obtained using a state-of-the-art Teradyne A567 automated semiconductor tester. Deviations in results obtained using each test resource are investigated. “Damaged” devices are interspersed within a 100-chip set to assure coverage in the student generated test solution as well as demonstrate statistical concepts. Introduction Definition: Correlation – ability to get the same answer using different pieces of hardware or software. Students at Texas A&M University are uniquely suited to explore the effects of high tech semiconductor testing methodologies and correlation issues between state-of-the-art bench-top test equipment and industrial automated test platforms. Currently the Electronics Engineering Technology Program at Texas A&M University offers two courses in Mixed-Signal semiconductor testing as well as one course in Digital Circuit testing. This paper explores the academic implementation of semiconductor testing as performed in our Advanced Mixed-Signal Testing course on Digital-to-Analog Converters (DACs).
"Proceedings of The 2006 IJME - INTERTECH Conference."
In a real-life scenario, data acquired from a single testing source is suspect until verified using a second trustworthy testing resource, a concept known as correlation. The use of both LabVIEW powered bench top instruments with DAQ hardware and a Teradyne A567 automated test instrument allows the test-engineering student to collect data and correlate between test platforms. By utilizing a DAC0808 as a test chip, it was possible to correlate the data between a Teradyne A567 tester and a National Instruments test system with LabVIEW 7.1 and a PCI6025E Data Acquisition Card. Several test related issues were explored: limitation of equipment capability, speed of equipment, loading issues, and circuit board designs that resulted in correlation failures. In testing the DAC0808, statistical variations in results of absolute error, gain error, offset error, Differential Nonlinearity (DNL), and Integral Nonlinearity (INL) were determined using all codes testing as well as major carrier testing. Deviations in results obtained using each test resource were investigated. “Damaged” devices were interspersed within a 100chip set to assure coverage in the student generated test solution as well as to demonstrate chip failure concepts. Rationale – Test Engineering With corporations experiencing a tremendous need for highly qualified test engineers, opportunities abound for academic programs to collaborate with industrial partners. These interactions not only benefit industry by exposing future employees and/or customers to their technology, but can also have major impacts on the relevancy of the curriculum in an academic program. The Electronics Engineering Technology faculty at Texas A&M University is collaborating with several major companies (Texas Instruments Inc., Freescale Inc., National Instruments Inc., IBM Inc. and Teradyne Inc.) to address a strong industrial concern at the lack of entry-level engineers who are prepared to do semiconductor testing. Concepts such as the real life performance of devices are not addressed in a traditional Electrical Engineering curriculum in favor of the more predictable ideal performance, which can be easily modeled. Thus, students graduating are unaware that performance variations exist and must be quantified and performance must be assured before devices can be sold to the customer. It is the objective of the Advanced MixedSignal Test and Measurement course that students be made aware of these variations and have an appropriate knowledge toolset to identify and quantify the affects on system performance. Data Converter Correlation Issues As a major family of mixed-signal devices, data converters were a logical choice for devices to be tested in our Advanced Mixed-Signal Test class. Although this paper focuses on Digital-toanalog Converters (DACs), both Analog-to-digital Converters (ADCs) as well as DACs are tested and evaluated in the course. Functionally, data converters translate analog signals into digital code sequences (ADCs) or digital codes into analog waveforms (DACs). Although these devices are fairly similar, their transfer characteristics require them to be treated very differently when testing. An ADC converts a range of analog input voltages into a digital code (a many to one mapping) whereas a DAC translates a single digital code into a specific analog voltage (a one to one mapping). Since this mapping mismatch causes a significantly different test methodology, this paper will focus only on the DAC testing portion of the Advanced Mixed-
"Proceedings of The 2006 IJME - INTERTECH Conference."
Signal Test class. Table 1 explains the performance parameters that were evaluated as well as the test limits, which were imposed to designate a passing chip. Table 1 – Description of common Digital-to-analog Converter Specifications tested on both test platforms. Test Name Absolute Error
Gain Error
Parameter Description Test Limit Maximum deviation in LSBs from the ideal step +/- 1 LSB size. An absolute error curve is calculated by subtracting the ideal DAC output curve from the actual measured DAC curve. The values in the absolute error curve can be normalized to LSBs by dividing each voltage by the ideal LSB size. Deviation in percent of the Least Squares +/- .3% regression line obtained from all data in the transfer curve to the ideal gain value provided by the data sheet.
GE(%) = 100* ( (Actual Gain / Ideal Gain) – 1) Offset Error The DACs offset is defined as the voltage at +/- 2 mV which the best-fit line crosses the y-axis. The DACs offset error is equal to its offset minus the ideal voltage at this point in the DAC transfer curve. Differential Nonlinearity Differential non-linearity is a figure of merit that +/- ½ LSB (DNL) describes the uniformity of the LSB step sizes between DAC codes. DNL is calculated by computing the discrete first derivative of the DACs transfer curve, then normalizing the derivative curve to one LSB, and finally subtracting one LSB from the normalized derivative curve. Integral Nonlinearity (INL) The integral non-linearity (INL) curve is a +/- ½ LSB comparison between the actual DAC curve and the best-fit line obtained from all data in the transfer curve. The INL curve can be calculated by subtracting the best-fit DAC line from the actual DAC curve and dividing the results by the average LSB step size.
Two major methods of testing exist in industry today – characterization and production testing. Characterization testing (usually using LabVIEW and bench equipment) can take a significant amount of test time per chip and is performed on a small number of chips to determine the limits
"Proceedings of The 2006 IJME - INTERTECH Conference."
of the chip before mass production and testing begin. The goal of characterization testing is to find the weaknesses and most likely failure modes of a chip. Production testing (usually using automated test equipment such as our Teradyne A567) is performed on a very large number of chips and is extremely time sensitive. Very limited subsets of the characterization tests are performed to verify performance on all chips sent from a manufacturer. This creates a problem of bench to tester correlation and is the first main focus of the DAC testing in our course. In order to completely test a DAC, all digital input combinations must be applied to the input and the resulting analog output must be measured. This method of testing is termed “all codes” testing and is very time consuming. For instance, an 8-bit DAC would require 256 digital input combinations as well as 256 analog output voltage measurements. Another, less time consuming method of testing DACs, is known as “major carrier” testing and involves only the testing of the voltage contributions of each major bit change. For instance one major carrier could be a digital bit shift from 00000000 to 00000001 which could result in a 10mV analog output – similarly a major carrier shift from 00000000 to 00010000 could result in a 200mV analog output. This test concept would be repeated for all major carrier transitions (in this case 8 plus one DC offset test) and a composite model would be generated to predict the value of all intermediate digital codes. For instance if we desired a value for a shift from 00000000 to 00010001 then we would predict the analog output voltage to be 205mV. Obviously this reduces the number of tests from 256 to 9 and reduces the final test cost significantly. This test time reduction methodology is used in industry regularly as long as the results of each method correlate (are the same within a very small limit). The change from all codes to major carrier testing creates a problem of test method to test method correlation and is the second main focus of the DAC testing in our course. Software/Hardware As a result of donations from Texas Instruments Inc. and Teradyne Inc. the named Texas Instruments Mixed-Signal Test Laboratory was created. The lab was totally remodeled with new furniture and ten benches completely outfitted with modern test equipment to accommodate a maximum of twenty students. The renovated lab can be seen in Figure 1. As summarized in Table 2, each of the benches has a mixed-signal oscilloscope, a multimeter, an arbitrary waveform generator, and a programmable power supply.
"Proceedings of The 2006 IJME - INTERTECH Conference."
Figure 1 - The new analog laboratory. The students not only have access to state-of-the-art test and measurement equipment, but they can also make measurements and collect data under computer control. All of the new equipment was purchased specifically to be compatible with an IEEE-488 bus (GPIB) so that it could be networked to a host computer on the bench. Each station has been equipped with PCI-based data acquisition and virtual instrumentation capability through the generosity of National Instruments Inc. PCI data acquisition cards are installed in each of the bench computers and give students the ability to source and capture both analog and digital signals. The use of National Instruments LabVIEW 7.1 virtual instrumentation environment in conjunction with the GPIB-interfaced equipment gives students the flexibility to automate repetitive experiments and to process their data in real time. Table 2 - Summary of the equipment and software installed in the new laboratory • • • 10 Individual Workstations
Shared HighEnd Equipment
• •
• • •
Mixed-Signal 100MHz Oscilloscope (54645D, Agilent) Triple Output Power Supply (E3631A, Agilent) 15 MHz Arbitrary Waveform Generator (33120A, Agilent) Digital Multimeter (34401A, Agilent) 3.2GHz Pentium 4 Computer - LabVIEW 7.1 (National Instruments) - OrCAD Pspice 9.1 (Cadence) - MS Office (Microsoft) - DAQ Board (PCI 6025, National Instruments) - GPIB Interface (Agilent)
Spectrum Analyzer (8592L, Agilent) Network Analyzer (8712, Agilent) LCR Meter (Agilent)
"Proceedings of The 2006 IJME - INTERTECH Conference."
Figure 2 – The new State of the Art Bench equipment station. Students obtain individual measurements using professional quality equipment. As seen in Figure 2, a shared high-end workstation with a network analyzer, a spectrum analyzer, and an LCR meter is available for student use. Having this workstation allows students to get a hands-on feel for concepts that are typically difficult to grasp in lecture. For example, the circuits courses use the network analyzer to investigate and compare the differences in the frequency response of real versus ideal passive components. The centerpiece of the Texas Instruments Mixed-Signal Test Laboratory is the Teradyne A567 Advanced Mixed-Signal Automated Tester (Figure 3). The A567 was donated to Texas A&M University through joint support from Texas Instruments Inc. and Teradyne Inc. in an effort to improve the industrial level equipment available to Texas A&M University to educate our students. The correlation exercises on DACs as well as ADCs are performed on this state of the art industrial automated test hardware. The Teradyne tester uses a form of the C programming language known as Image to operate test instruments.
"Proceedings of The 2006 IJME - INTERTECH Conference."
Figure 3 –The Teradyne Advanced Mixed Signal Tester. This instrument allows the students to program an automated sequence of tests to be performed by the tester. Components to be tested include voltage regulators to advanced mixed-signal chips such as DACs and ADCs. Laboratory Experiments and Results analysis The two laboratory projects (ADC testing and DAC testing) were designed to each require seven weeks of effort (sequentially) for a team of two to three students. The goal of discovering correlation challenges was described and the expectations for performance were presented in the first class meeting. In the DAC testing project, the expectation was set that each team would perform “all codes” as well as “major carrier” testing using both the LabVIEW based equipment as well as the Teradyne A567. No initial guidance was supplied in choosing the order in which testing was performed. Each team was supplied with a chipset of 100 DAC0808 (8-bit current output Digital-to-analog Converter produced by National Semiconductor) chips to test. Interspersed in each chipset were 10 to 20 (blind labeled) chips that had been internally altered through radiation treatment to provide failing devices. The expected results of the project were four different programs (2 - LabVIEW and 2 - Image) as well as tested values from each test method and platform for the test parameters mentioned in Table 1. Each team was to pick one chip to use to verify the “correct” answer with the instructor as well as a test device to measure the noise contribution of each test platform. Results from each team and method differed and an example is shown in Table 3.
"Proceedings of The 2006 IJME - INTERTECH Conference."
Table 3 - Results from one team using a single chip showing correlation between LabVIEW, Teradyne, all codes, major carrier testing as well as the instructor solution Team 1
Absolute Error Instructor Solution 0.8321LSB Teradyne all Codes 0.8481 LSB Teradyne Major Carrier 0.5541 LSB LabVIEW All Codes 0.7991LSB LabVIEW Major 0.4550 LSB Carrier
Gain Error -0.2631% -0.2613% -0.1359% -0.2596% -0.0921%
Offset Error -1.4110mV -1.4143mV -1.8750mV -1.3839mV -1.995mV
DNL
INL
0.3672LSB 0.3476LSB 0.4897LSB 0.2986LSB 0.5203LSB
0.2101LSB 0.2104LSB 0.3425LSB 0.1937LSB 0.4421LSB
An analysis by all student groups of the data generated by their project resulted in the conclusion that “all codes” testing was the more accurate test method for this particular chip. In the example data presented in Table 3, major carrier testing even produced one false fail result (in bold – test limit +/- ½ LSB) using the LabVIEW test platform. The benefit to understanding real life correlation issues is truly emphasized in the transition from LabVIEW testing to Teradyne testing. Timing challenges are significant, especially in a high-speed test platform such as the A567. Settling time was found to be one of the major correlation challenges to students when comparing results and maintaining good correlation between platforms. If data values were acquired before voltages were sufficiently settled, incorrect and in most cases fairly unpredictable answers were collected. In LabVIEW, the program execution times were found to be sufficiently long such that settling time was not an issue. In addition, the conclusion was reached that the device interface board (required by the Teradyne, generated in ExpressPCB and professionally produced) that was used on the Teradyne test platform resulted in significantly more accurate answers as compared to the protoboard (hand wired) version. It is a noteworthy observation that groups that started with the hand wired protoboard (which allows easy modification and redesign when an error is made) were much faster in the completion of the overall project as compared to groups that began with a professional layout approach. It was found that the hand wired circuit boards had more noise issues that were identifiable and addressable, which lead to better understanding of chip sensitivities and when subsequently incorporated, a better PCB layout. Issues such as changes in device interface board layout and protoboard wiring caused significant changes in the amount of noise on all analog signals – thus better repeatability was found on circuit boards that were professionally manufactured after a protoboard layout was created versus circuit boards that were manufactured without the protoboard designs. The least accurate of all designs was the protoboard design with no identifiable difference between groups that created PCBs before or after their protoboard layout. Table 4 summarizes the order of accuracy results found in all groups.
"Proceedings of The 2006 IJME - INTERTECH Conference."
Table 4 – sequential listing of accuracy results obtained from all group, indicating that protoboard designs assisted in creating PCB layouts, which resulted in more accurate test results. Accuracy 1 2 3 4a 4b
Test method and platform Teradyne All codes testing – professional PCB after LabVIEW testing was complete using hand wired protoboard Teradyne All codes testing – professional PCB LabVIEW All Codes testing Teradyne Major Carrier testing – professional PCB With or without LabVIEW testing was complete using hand wired protoboard LabVIEW Major Carrier testing
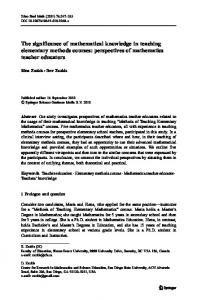
In addition to testing 100 chips as a sample set, students were required to evaluate the statistical distribution of the noise associated with the test platform. This was accomplished using a single chip and repeating the same test 100 times to show the noise distribution of the test platform. As an example, the statistical variation of a data set of 110 gain error tests using the Teradyne A567 is shown in Figure 4. This requirement was very valuable in localizing noise issues when the student teams were using the hand wired boards. Noise distributions were not found to be significantly useful when using professionally manufactured boards since no changes could be made without redesigning the board and having it remanufactured. Finally, as was mentioned in the introduction, each chip set that was provided to the students contained between ten and twenty “damaged” devices. These devices were “left over” from Gamma radiation hardness testing performed over the past year as part of a research effort. Due to the research data acquired in the past, all damaged devices were pre-characterized (so we knew what results the students should acquire) and labeled with a scratch pen. All other “nondamaged” chips that were provided to the students were marked in a similar way, so the students were unable to identify which chips were the damaged devices. In all but one case, the student teams were able to identify the damaged devices and using the Teradyne PCB test platform, obtain acceptable correlation with my research results. Summary The Electronics Engineering Technology program at Texas A&M University is using its collaborations with industry to continually enhance the curriculum by adding new real life topics and experiments. By updating laboratories and adding sophisticated concepts, the Electronics Engineering Technology program is preparing students who are well-suited for today's job market. The development of the Texas Instruments Mixed-Signal Test Laboratory allows instruction of high tech automated testing using the most current instruments available today. The Mixed-Signal Test emphasis allows real world, high tech problems to be solved during the student’s university education. Therefore, students will be very well suited as entry level test and product engineers.
"Proceedings of The 2006 IJME - INTERTECH Conference."
Figure 4 – Gain error statistical histogram showing 110 repetitive tests to determine noise contribution of the test platform. Acknowledgements The author would like to thank Texas Instruments Inc. and Teradyne Inc. for their support in the creation of the new lab facilities. He would also like to thank National Instruments Inc. for their generous hardware and software donations.
Biographies DR. RAINER FINK is an Associate Professor of Electronics Engineering Technology at Texas A&M University and is currently the Director of the TI Mixed-Signal Test Laboratory. Dr. Fink created the mixed-signal semiconductor testing initiative with extensive industrial support. His research includes mixed-signal testing, radiation hardness testing, and biomedical electronics. YONG-KYU JUNG is an Assistant Professor at Texas A&M University. He received his Ph.D. from Georgia Institute of Technology in 2001 respectively. He was a senior research engineer at LG Electronics ltd. and vice president of VLSI technology at VP Technologies Inc. His research interest is DSP/embedded computing system design and automation for wireless communication.
"Proceedings of The 2006 IJME - INTERTECH Conference."
B. BEN ZOGHI earned a Ph.D. in Biomedical Engineering from Texas A&M University and has been with Engineering Technology and Industrial Distribution since 1987. He has served as the Industrial Distribution Program Coordinator, Executive Director of Thomas and Joan Read Center and Associate Department Head for Research. His research activities include RFID/Sensor Convergence and leadership development.
"Proceedings of The 2006 IJME - INTERTECH Conference."