IEEE TRANSACTIONS ON HUMAN-MACHINE SYSTEMS, VOL. 44, NO. 1, FEBRUARY 2014
139
Technical Correspondence Identifying Successful Motor Task Completion via Motion-Based Performance Metrics Marcia K. O’Malley, Senior Member, IEEE, Sagar N. Purkayastha, Nicole Howie, and Michael D. Byrne Abstract—Objective assessment of skill is important in understanding the human performance of precision motor control tasks; however, outcome-based performance measures are most commonly used to provide feedback after the task is completed. In this paper, we propose the use of motion-based performance metrics in order to determine successful task completion strategies for a complex and unconstrained dynamic task. We developed a novel motor control task in a virtual environment and identified two motion-based metrics (mean absolute jerk and average frequency) that correlate with the successful performance of the task measured as a function of completion time and acquired targets. Our methodologies provide insight into the movement strategies used during successful trials of the motor control task, and could be used to provide specific feedback and coaching aimed at altering the task completion strategy and boosting the participants’ performance. Index Terms—Accelerometers, human–computer interaction, motion analysis.
I. INTRODUCTION There is a growing trend to objectively assess motor skills based on motion data across several domains, most prominently in the domain of robotic surgery. Specifically, Kumar et al. explored the use of automated recording systems to acquire instrument motion/telemetry and video for a set of basic surgical skills, and developed statistical models to discriminate between practicing expert surgeons and trainees [1]. Their measures focused on management of the master workspace as well as instrument and camera control. These were computed from data extracted from the robotic system (e.g., time stamps, instrument Cartesian positions, orientations, velocities, and gripper positions for the instrument manipulators and the endoscopic camera). In a related study, Judkins et al. computed time to task completion, distance traveled, speed, and curvature in order to distinguish expert and novice surgeons [2]. These analyses of detailed motion characteristics contrast the outcome-based performance metrics such as task completion time and counts of instrument collisions used in face, content, and construct validity investigations for surgical trainer systems [3], [4]. As
Manuscript received February 4, 2013; revised May 22, 2013 and September 15, 2013; accepted October 18, 2013. Date of publication November 26, 2013; date of current version January 16, 2014. This work was supported in part by the National Science Foundation under Grant IIS-0812569. This paper was recommended by Associate Editor R. A. Hess. M. K. O’Malley is with the Department of Mechanical Engineering and the Department of Computer Science, Rice University, Houston, TX 77005 USA (e-mail:
[email protected]). S. N. Purkayastha was with the Department of Mechanical Engineering Rice University, Houston, TX 77005 USA (e-mail:
[email protected]). N. Howie is with the Department of Psychology, Rice University, Houston, TX 77005 USA (e-mail:
[email protected]). M. D. Byrne is with the Department of Psychology and the Department of Computer Science, Rice University, Houston TX 77005 USA (e-mail:
[email protected]). Color versions of one or more of the figures in this paper are available online at http://ieeexplore.ieee.org. Digital Object Identifier 10.1109/THMS.2013.2290129
stated by Jog et al., while these metrics may indeed capture the user’s skill with a surgical trainer, they fail to offer insight into individual task performance or detailed performance comparisons between users or sessions. Nor do they provide any feedback to the trainee [5]. More generally speaking, access to more detailed data about the human’s control over the task and the task outcomes offers the possibility to identify correlations between the movement strategies used in task completion, and the outcome or performance measures of the task (e.g., completion time or success rate). In our prior work [6], we identified motion-based performance metrics that imply successful strategies for a virtual reality target-hitting task. We analyzed performance data obtained to uncover several skills that were required for successful task completion. We then proposed expertise-based performance measures for these task skills and analyzed the correlations between measures of trajectory error and input frequency, and the stated task objective of hitting as many targets as possible in the allotted time. After demonstrating that movement strategies correlate with successful performance of the target-hitting task in terms of outcome measures, we were motivated to carry out these analyses for another and more complicated motor control task. We recognized that the virtual target-hitting task was relatively simple (could be mastered in a few sessions) and had a clear set of movement strategies that could be identified to lead to successful completion of the task [6]. Additionally, the task was significantly constrained, in that success was measured on a single aspect (target hits). In this paper, we developed a novel rhythmic motor control task in a virtual environment that is significantly more difficult to master than our prior task [7], uses a high fidelity physics engine for rendering that task, and is unconstrained in that multiple movement strategies could result in successful completion of the task. We sought to determine if motionbased performance metrics could be identified for such a complex and unconstrained task, using techniques similar to those in our prior work [6]. Rhythmic tasks have been extensively studied in the field of motor control [8]–[10], due in part to the fact that mathematical tools and motion based performance measures that capture task execution dynamics (e.g., frequency-based measures) are well matched to these rhythmic tasks. Other researchers interested in skill acquisition and performance strategies have adopted the use of instrumented interfaces to virtual environment tasks, even when these tasks do not necessarily mimic high level complex tasks that humans may train extensively to master [11], [12]. Such an approach is attractive due primarily to the consistency of task representation in the virtual environment and the customizable nature of such systems. II. METHODS A. Subjects Subjects were 23 Rice University students (14 female) aged 17–33 (parental consent was obtained for the one 17-year old subject). Subjects were recruited from flyers posted around campus and received $20 compensation. In addition, subjects were eligible for a bonus gift card if their final score was the highest. B. Stimuli and Materials The Neverball video game, an open-source game initially developed for Linux (but which we ran in Windows), was used for this study. In the game, a ball is controlled by gravity using a gaming controller to tilt the
2168-2291 © 2013 IEEE. Personal use is permitted, but republication/redistribution requires IEEE permission. See http://www.ieee.org/publications standards/publications/rights/index.html for more information.
140
IEEE TRANSACTIONS ON HUMAN-MACHINE SYSTEMS, VOL. 44, NO. 1, FEBRUARY 2014
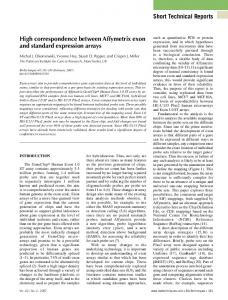
Fig. 3. Goal was unlocked after a certain number of coins were collected within the stipulated time limit. Fig. 1. (a) The Neverball game allows design of environments that are manipulated by various computer input devices. We designed the half-pipe level with a rolling ball, controlled by tilting the half-pipe using the Nintendo Wiimote. (b) The Nintendo Wiimote records accelerations of the user’s hand movements. Movements along the indicated x-axis correspond to side-to-side motions of the half-pipe. Movements along the indicated z-axis correspond to orientation changes lengthwise along the half-pipe.
Fig. 2. Half-pipe level with three rows of coins arranged along the sides of the half-pipe. The coins had different denominations: the row closest to the center was 1, center row was 5, and row closest to the edge of the half-pipe was 10.
playing field. For this study, we created a level for the Neverball game [the “half pipe” level, shown in Fig. 1(a)] that required the subject to employ a wide range of motions to be able to complete the level successfully. The half-pipe level featured virtual coins arranged in three rows along the sides of the half-pipe as shown in Fig. 2. Coins, with colors representing their respective point value (yellow 1, red 5, and blue 10), were collected by controlling the ball to roll over them. A minimum number of coins had to be collected within a stipulated time limit to unlock the goal (shown in Fig. 3). The ball was steered toward coins, away from obstacles, and toward the goal by tilting a Wiimote gaming controller. The accelerations recorded from the Wiimote were mapped to the rotations of the playing field, which in turn were used to control the movement of the ball in the half-pipe. The recorded acceleration values were multiplied by a small gain before being converted to angles corresponding to the rotation of the halfpipe. In other words, a second-order controller was used to control the movement of the ball in the half-pipe by rotating the half-pipe based on the recorded acceleration values. In order to successfully complete the level, the ball had to enter the unlocked goal before the end of allotted time. Subjects were encouraged to collect the most coins in the least amount of time. In order to transfer data from the gaming controllers to the Neverball game software, we used GlovePIE, a free (but not open source)
API developed to translate various device inputs into other computer inputs. GlovePIE offers both a GUI interface and a scripting language for translation, and allowed simultaneous recording of data from the Wiimote and control of the Neverball game since the Wiimote commands were translated to a virtual joystick task. Specifically, raw data from the Wiimote controller were translated into an (x, y) coordinate in a virtual 2-D joystick controller space, and those coordinates served as the input to the game platform. The Neverball video game was played on a 15- inch LCD screen set to a resolution of 1024 by 768 pixels. The computer was a 1.83-GHz Macintosh Mini running the Windows XP operating system. A Cirago Bluetooth dongle was used to connect the Nintendo Wiimote to the computer. In order to use the Wiimote as a regular joystick on a Windows operating system, we first used the GlovePIE program (http://glovepie.org/glovepie.php), which allows input from controllers to emulate input devices, such as a keyboard or mouse. In this case, the directional pad and buttons on the Wiimote controller were mapped to a virtual joystick. Another program, PPJoy, a virtual joystick driver (http://ppjoy.bossstation.dnsalias.org), was necessary to allow for the virtual joystick created by GlovePIE to be recognized as a joystick on Windows. During game play, motion data, consisting of accelerometer data sampled at 40 Hz, were recorded to a file for every level across each experimental session. C. Design The design was a 2 × 15 within-subjects design. The first factor, with two levels, was session. Subjects came in to the experiment for two separate sessions, spaced 24 h apart. Each session consisted of 15 trials, which was the other independent variable. Subjects actually played multiple levels of the Neverball game, but we will present analysis of performance for only one level, the “half-pipe” level described earlier. There were three outcome-based dependent variables: time taken on each level, the number of coins collected on the level, and whether or not the level was successful. In order for a subject to succeed on a level, a threshold number of coins needed to be collected which unlocked a goal region. Subjects had to move their ball into that goal region before the level timed out. Raw motion sensor data from the Wiimote controller were also collected for each trial. D. Procedure In each session, participants were seated in front of a computer and read instructions on how to play the Neverball video game and use the Nintendo Wiimote. While subjects played the game, the experimenter recorded performance metrics and used a keyboard to direct the computer to start and stop motion data collection. After completing
IEEE TRANSACTIONS ON HUMAN-MACHINE SYSTEMS, VOL. 44, NO. 1, FEBRUARY 2014
Fig. 4. Mean time spent on level (less time reflects better performance) as a function of overall trial number. The best-fit regression line explains 58% of the variation in the means. Error bars represent 95% confidence intervals.
141
Fig. 6. Proportion of successful trials as a function of overall trial number. The best-fit regression line explains 79% of the variance in means. Error bars represent 95% confidence intervals.
session was F (1, 22) = 40.57, MSE = 0.33, p < .001, ηp 2 = .65 and the main effect of trial was F (14, 308) = 3.14, p < .001, ηp 2 = .12. Effects of both session and trial were statistically reliable on all three variables, and there were no reliable interactions between session and trial, suggesting that the learning rate was constant across sessions. In order to better understand this learning, we closely examined the raw motion data collected via the Wiimote controller. The raw acceleration signals recorded from the Wiimote had to be processed before they could be used for any analysis. The Wiimote’s ADXL 330 accelerometer chip produces uniform white Gaussian noise at all frequencies. Therefore, in postprocessing, the sampled data from the accelerometers of the controllers were filtered with a sixth-order Butterworth filter with a cutoff frequency of 3 Hz, which was greater than twice the inherent frequency of the recorded motion. A Butterworth filter was chosen because of its maximally flat pass band. The filter order was chosen to ensure a sharp transition band and so that the filter gain was 1 for the entire pass band. The data were filtered both in the forward and the backward directions to compensate for phase lag. Fig. 5. Mean number of coins collected (higher numbers are better) as a function of overall trial number. The best-fit regression line explains 86% of the variance in the means. Error bars represent 95% confidence intervals.
the second session of game play, subjects filled out a survey and were debriefed. III. RESULTS We first explored whether subjects improved in their performance of the task at all with practice. Did they actually learn at all? There was clear evidence of learning on all three summary performance metrics. Fig. 4 presents data on time (lower scores are better), Fig. 5 on coins collected (higher scores are better), and Fig. 6 on success rate. For time (see Fig. 4), the main effect of session was F (1, 24) = 11.66, MSE = 1022, p = .002, ηp 2 = .33 and the main effect of trial was F (14, 336) = 2.15, MSE = 904, p = .01, ηp 2 = .08. For coins (see Fig. 5), the main effect of session was F (1, 22) = 39.29, MSE = 955, p < .001, ηp 2 = .64 and the main effect of trial was F (14, 308) = 4.11, MSE = 281, p < .001, ηp 2 = .16. For successes (see Fig. 6), the main effect of
A. Measures Explored The metrics that we explored can be broadly classified as motionbased and outcome-based. The motion-based metrics explored included the acceleration traces recorded by the x- and z-axis accelerometers of the Wiimote, kurtosis, average accelerations, average excitation frequency per trial, mean jerk per trial, and mean absolute jerk (MAJ) per trial. The outcome-based metrics that we explored included completion time for each trial, number of coins collected in each trial, and points scored in each trial. The metrics were selected and explored based on knowledge of the task design, task requirements, and observation of the acceleration traces of successful versus unsuccessful trials. As the underlying motion dynamics of the half-pipe level were similar to the target-hitting task carried out in our prior work [6], it was hypothesized that the shape and the arrangement of the coins in the half-pipe would require rhythmic motion of the wrist during game play. Thus, MAJ and average frequency (AF) could have an underlying effect on the task performance as was reported for a similarly rhythmic target hitting task [6]. We were limited in choosing our motion-based metrics because the acceleration data recorded from the Wiimote could not be
142
IEEE TRANSACTIONS ON HUMAN-MACHINE SYSTEMS, VOL. 44, NO. 1, FEBRUARY 2014
integrated to get velocity or position due to large integration drifts. Furthermore, the acceleration traces indicated that the underlying dynamics of the hand motion were better represented by the data recorded by the x-accelerometer of the Wiimote. The x-direction, which corresponds to the transverse direction in the half-pipe, had significantly higher AF values since the coins in the half-pipe were arranged along the sides. Therefore, a movement along the transverse direction in the half-pipe or the x-direction of the Wiimote’s local coordinate system was required to get to the coins. As a result, the dynamics of the hand motion were better represented by data recorded by the x-accelerometer of the Wiimote, and the accelerations recorded by the z-accelerometer were excluded from further analyses. Correlations were carried out among the different metrics; first, for pairs of outcome and motion-based performance measures, as we had done previously [6]. However, these pairings did not produce any useful results; therefore, we explored correlations between pairs of motionbased metrics. We observed that high correlations existed only between AF and MAJ. Therefore, deeper analyses of only these measures were carried forward. Mean Absolute Jerk: The MAJ for a single trial was computed by taking the average of the absolute value of the differentiated acceleration signal recorded from the x-accelerometer of the Wiimote for one trial. MAJ is a measure of the abruptness in the change in hand motions. Average Frequency (AF): First, the power spectrum based on the acceleration data recorded from the x-accelerometer of the Wiimote was computed. The AF was then calculated by taking the average of frequencies less than 0.8 Hz having a power above 0.001 g2 /Hz. The limits of 0.001 g2 /Hz and 0.8 Hz were determined by visual inspection of the power spectral density versus frequency plots for all successful trials across all subjects. Finally, an average was evaluated based on the frequencies representing actual human motion data for a trial. The AF is a measure of the frequency at which the participant changes the orientation of the half-pipe environment, causing the ball to roll from side to side. Higher frequencies result in higher velocities of the ball moving from edge to edge of the half-pipe. It should be further emphasized that success was defined by the completion of the trial within the stipulated time, while failure was denoted by either failing to complete the trial in the allotted time, or causing the virtual ball to fall out of the half-pipe. Failures attributable to fall outs were directly related to the subjects’ inability to control the rotation of the half-pipe appropriately, resulting in the ball falling out of the half-pipe. In contrast, failures due to time outs were not necessarily due to lack of proper motor control, and motion-based metrics were not sufficient to identify differences between successful trials and failures due to time outs. Therefore, timed out trials were omitted from further analysis of the motion-based metrics because of similarities in the underlying dynamics of the successfully completed trials and the timed out trials. B. Motion-Based Analysis Fig. 7 shows the linear regression fit between MAJ and AF of the successful trials of all the subjects, with failed trials also indicated. We interpret the linear regression as indication that successful trials are the result of appropriate momentum control. By “momentum control,” we mean that slower movements enable smoother control of the rolling ball—it is easier to reverse the direction of the ball to collect more coins, while avoiding falling out of the half-pipe level, since slow and smooth adjustments to the half-pipe orientation result in slower changes to the ball’s movements. In contrast, if the participant is changing the orientation of the Wiimote more quickly (and in turn, quickly adjusting the orientation of the half-pipe), then the rolling ball has
Fig. 7. Distribution of successful and failed trials relative to the linear regression based on successful trials of all subjects (R 2 = 0.73).
Fig. 8. Distribution of successful and failed trials relative to the linear regression based on successful trials of 18 subjects (R 2 = 0.75).
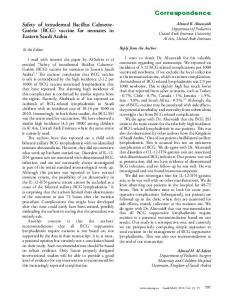
more momentum, and jerkier movements are needed to quickly cause direction changes of the ball. Without such jerky movements, the ball will fall out of the half-pipe before the user has had time to intervene. As the velocity of the ball increases, it has more momentum, and higher forces (rate of change of momentum) are required to impart control over the ball. These higher forces are observed as movements with higher jerk. Since friction is not part of the Neverball physics engine, the velocity (or frequency)–jerk relationship for successful performance is linear. Although Fig. 7 indicates a high correlation between MAJ and AF for successful trials, a closer look at the distribution of successes and failures reveals that some failures lie on the regression line. This unexpected occurrence of failures on the regression line indicated the need for further analysis. We proceeded to narrow our analysis to “successful” subjects, defined as those who were successful at least twice as often as they failed in the task, based on the hypothesis that such subjects would demonstrate some consistency in their task execution strategy since they could reliably succeed in the task. Considering only these “successful” subjects results in a marginally greater R2 value of 0.75 (see Fig. 8). However, there still were failures on the regression line that indicated that linear regression alone was not enough to predict success in the task. We hypothesized that different strategies might exist based on heuristic observation of the metrics. Therefore, following the linear regression analysis, a logistic regression analysis was carried out to better predict success for this task. Logistic regression is a maximum-likelihood regression analysis used when the dependent variable is binary, allowing for both categorical and continuous predictor variables. Fig. 9 shows the results of the linear and logistic regressions between MAJ and AF that were carried out based on the data of the 18 subjects whose success percentage was greater than 33% (successful trials outnumbering failed trials two to one). As can be seen in the figure, the entire space is divided into three “zones” separated by the two dark gray logistic regression lines. Each zone indicates a strategy used by a group of subjects resulting in success. For a given subject, failure to keep the MAJ and AF values within a strategy zone marked by the respective logistic regression line(s) typically resulted in an unsuccessful trial. It seems that the task had more than one viable strategy, and success was a
IEEE TRANSACTIONS ON HUMAN-MACHINE SYSTEMS, VOL. 44, NO. 1, FEBRUARY 2014
Fig. 9. Logistic regression line separating the successful trials of subjects who used strategy 1, 2, and 3, and the linear regression line showing the high correlation between the MAJ and AF data between the various subjects.
TABLE I PERCENTAGES OF SUCCESS AND FAILURE PREDICTED CORRECTLY BY THIS TECHNIQUE FOR STRATEGIES 1, 2, AND 3, BASED ON REPRESENTATIVE DATA FROM 18 SUBJECTS
function of optimizing the task parameters (MAJ and AF) based on the strategy that a subject was comfortable using. The physical meaning of the various strategies is simply that subjects demonstrate a preferred operating domain for the task. Some people prefer to be in a lower frequency bound or a higher frequency bound. However, the task does have absolute bounds. If subjects are too slow, they will time out. At the high end of the frequency range, subjects are hitting the bandwidth limit of human motor control. The percentage of successes and failures predicted by the combination of linear and logistic regression is presented in Table I. The prediction accuracy was computed by analyzing the percent of successful trials that fell within the 95% simultaneous prediction intervals on either side of the linear regression fit in Figs 9 and 10. For failures, if the failure data point fell both outside of the band marked by the gray lines in Fig. 9 and the respective strategy zones marked by the logistic regression lines, then it was considered to be a successful prediction. For successes, if the data point fell within the 95% simultaneous prediction band indicated by the gray lines in Fig. 10 and within the respective strategy zones marked by the logistic regression lines, it was considered to be a successful prediction. To further test the robustness of the prediction technique used in this paper, half of the successful trials of the 18 subjects were used to fit a linear regression line between MAJ and AF and the residuals of the data points computed from the line. This was followed by calculating the residuals of the remaining half of the data based on the regression line from the first half. This technique of training and prediction based on random splits was carried out 20 times. The mean R2 values for these 20 splits were 0.744 ± 0.029 for training and 0.736 ± 0.033
143
Fig. 10. Distribution of unsuccessful trials relative to the results of the linear and logistic regressions.
for prediction. This suggests that the procedure is robust and does not depend on a few particularly good or particularly deviant data points. The means and the standard deviations of the training and prediction along with results in Table I demonstrate that the techniques used to predict success or failure based on the motion data using the methods mentioned previously were moderately robust. Strategy 1 failures and Strategy 2 and 3 successes are well predicted with this method. Strategy 1 successes outside of Region 1 all lie in the Strategy 2 region, within the linear regression band. It could be that subjects adopting Strategy 1 gain confidence, and shift toward the Strategy 2 region, yet for the bulk of their trials they lie in the Strategy 1 zone and are thus classified. About half of the Strategy 2 failures fall inside the linear regression and inside the Strategy 2 region. Further, most of the Strategy 3 failures fall within the linear regression and within the Strategy 3 region. We hypothesize that as the speed of the ball increases (because of the increased excitation frequency of the half-pipe orientation), the system becomes more sensitive to small errors in movement. In these trials, the participant is exhibiting behavior within the Strategy 2 or 3 success regions for most of the trial; however, they likely make one small mistake and fall out (failure), even though their approach was consistent and appropriate for the bulk of the trial. From a feedback perspective, we would probably want to drive them into the Strategy 2 region, where it is most robust to complete the task and not fall out. It is clear from these initial results that we need to provide instruction of how to be careful at the edges of the half-pipe. IV. DISCUSSION A primary objective when using virtual environments for manual control task training is to demonstrate transfer of what is learned in the simulation environment to the equivalent or targeted real world task. However, a number of studies have shown that such transfer often does not take place. Sutherland et al., for example, reviewed 30 studies utilizing simulation for surgical training. In all 30 studies, the simulatorbased training did not outperform traditional training schemes, and in fact virtual reality-based training protocols only outperformed control groups who received no training at all [13]. Similarly, for a simple pick and place assembly task with a cognitive component, Adams et al. found no significant learning benefit from training in a virtual environment [14]. More recent studies have investigated face, content,
144
IEEE TRANSACTIONS ON HUMAN-MACHINE SYSTEMS, VOL. 44, NO. 1, FEBRUARY 2014
and construct validity for surgical training systems [3], [4]. Common in all of these studies is the use of task outcome-based metrics to assess performance. When we train people to do complex motor tasks, what feedback do we want to provide to them? Outcome-based performance measures are limited in that they are able to only indicate success versus failure, and by their very nature, they are not available to provide as feedback to the operator until the task is completed. Motion-based performance metrics offer a perspective on the strategies and approaches used to complete the task, and when those strategies are unsuccessful, specific feedback and coaching aimed at altering the task completion strategy could be provided to the subject. Consider learning to do some motor task with a well-defined “success” versus “failure” outcome metric, such as shooting a free throw in basketball. A trainee can shoot repeatedly and easily determine for each shot whether the shot was successful, but it may be very difficult for the trainee, and even a coach, to determine why different shots resulted in success or failure. Collection of high-density motion information, if the relevant metrics can be correlated successfully with task outcomes, offers the opportunity to provide more detailed feedback that may speed the learning process. A quantitative and motion-based approach to performance assessment in manual control tasks is gaining traction, especially in the domain of robotic surgery and the corresponding simulation environments that are used to train surgeons in the use of the robotic technology. Specifically, access to better data (both in quantity and detail) about the human’s control over the task, and the task outcomes, offers the possibility of identifying motion-based performance metrics that offer greater insight into task performance strategies, the ability to compare in a detailed manner the performance of subjects, and a mechanism to objectively track changes in performance as a result of training (i.e., learning curves). Task-specific training in virtual environments has been shown to be beneficial in a number of respects. In one study, surgeons with prior video game experience, regardless of the nature of the game content, performed better at laparoscopic skills [15]. Rosser et al. further analyzed whether demonstrated skill in a set of three carefully selected video games correlated with surgical skill, and found that performance in the game Super Monkey Ball 2, a commercially available game similar in mechanics to Neverball, was highly correlated with laparoscopic skill and suturing ability. This correlation is attributed to the skills required for successful execution of the game tasks, such as fine motor control, visual attention processing, spatial distribution, reaction time, eye–hand coordination, targeting, nondominant hand emphasis, and two-dimensional depth perception compensation [15]. More specifically, there is support that virtual reality simulators for domain-specific training are beneficial, particularly if a user is engaged in a skill-learning strategy [16]. There is also evidence that video games can improve perceptual and motor functions in older adults on general measures of manual dexterity and reaction time [17], which are desirable skills for surgeons. We are not suggesting that we have achieved a domain-general method to link raw motion data and outcome measures. However, this is a potentially useful long-term goal. Before attempting to extract domain-general principles, it is important to understand such relationships in multiple domains. We have so far examined this in the previously mentioned target-hitting task and now with this Neverball task. These two domains share some similar features but also showed some important differences; in particular, the relevant motion metrics were not the same across domains. Once more domains have been explored; it will be possible to attempt to extract more general principles that can hopefully be applied across multiple domains.
Further, the ability to compute such relevant performance metrics from data gathered during task completion offers the possibility to provide specific and directed feedback to the subject on the movement strategies, they are employing to complete the task. Such a goal will be the focus of future work with the Neverball half-pipe task. We aim to evaluate the benefit of providing specific performance feedback that highlights task completion strategies in the motion space, and evaluate the effect of providing such directed feedback on learning and retention of the task.
V. CONCLUSION Human–computer interfaces increasingly contain sensors providing access to an array of motion data types documenting the human’s control over the computerized task. Accordingly, the virtual environments used to render motor control tasks offer multiple means to assess task performance based on outcomes such as task completion time, or a score based on quality of task execution. In this paper, we explore the possibility to identify motion-based performance metrics that offer insight into task performance strategies, and the ability to compare in a detailed manner the performance of subjects. We identified MAJ and AF as two motion-based performance metrics that correlate with outcome-based performance metrics for a complex and unconstrained motor control task in a virtual environment. Our methodologies provide insight into the movement strategies used during successful trials of the motor control task. Further, the ability to compute such relevant performance metrics from data gathered during task completion offers the possibility to provide specific and directed feedback to the subject on the movement strategies they are employing to complete the task. Our future work will focus on evaluation of the benefit of providing specific performance feedback that highlights task completion strategies in the motion space, and the effect of providing such directed feedback on learning and retention of the task.
REFERENCES [1] R. Kumar, J. Amod, A. Malpani, B. Vagvolgyi, D. Yuh, H. Nguyen, G. Hager, and C. C. G. Chen, “Assessing system operation skills in robotic surgery trainees,” Int. J. Med. Rob. Comput. Assist. Surg., vol. 8, pp. 118– 124, 2012. [2] T. N. Judkins, D. Oleynikov, and N. Stergiou, “Objective evaluation of expert and novice performance during robotic surgical training tasks,” Surgical Endoscopy, vol. 23, no. 3, pp. 590–597, 2009. [3] T. S. Lendvay, P. Casale, R. Sweet, and C. Peters, “Initial validation of a virtual-reality robotic simulator,” J. Robot. Surg., vol. 2, no. 3, pp. 145– 149, 2008. [4] P. A. Kenney, M. F. Wszolek, J. J. Gould, J. A. Libertino, and A. Moinzadeh, “Face, content, and construct validity of dv-trainer, a novel virtual reality simulator for robotic surgery,” Urology, vol. 73, no. 6, pp. 1288–1292, 2009. [5] A. Jog, B. Itkowitz, M. Liu, S. DiMaio, G. Hager, M. Curet, and R. Kumar, “Towards integrating task information in skills assessment for dexterous tasks in surgery and simulation,” in Proc. IEEE Int. Conf. Robot. Autom., 2011, pp. 5273–5278. [6] J. C. Huegel, O. Celik, A. Israr, and M. K. O’Malley, “Expertise-based performance measures in a virtual training environment,” Presence, vol. 18, no. 6, pp. 449–467, 2009. [7] N. Howie, S. N. Purkayastha, M. D. Byrne, and M. K. O’Malley, “Motor skill acquisition in a virtual gaming environment,” in Proc. 55th Annu. Meeting Human Factors Ergonom. Soc., 2011, pp. 2148–2152. [8] S. Schaal, A. Ijspeert, and A. Billard, “Computational approaches to motor learning by imitation,” Phil. Trans. Roy. Soc. Lond. B, vol. 358, no. 1431, pp. 537–547, 2003. [9] S. Schaal, D. Sternad, and C. G. Atkeson, “One-handed juggling: A dynamical approach to a rhythmic movement task,” J. Motor Behavior, vol. 28, no. 2, pp. 165–183, 1996.
IEEE TRANSACTIONS ON HUMAN-MACHINE SYSTEMS, VOL. 44, NO. 1, FEBRUARY 2014
[10] D. Sternad, M. Duarte, H. Katsumata, and S. Schaal, “Dynamics of a bouncing ball in human performance,” J. Exp. Psychol. Hum. Percept Perform., vol. 27, no. 5, pp. 1163–84, 2001. [11] F. Huang, R. B. Gillespie, and A. Kuo, “Haptic feedback and human performance in a dynamic task,” in Proc. 10th Symp. Haptic Interfaces Virtual Environ. Teleoperator Syst., 2002, pp. 24–31. [12] C. J. Hasson, T. Shen, and D. Sternad, “Energy margins in dynamic object manipulation,” J. Neurophysiol., vol. 108, no. 5, pp. 1349–1365, 2012. [13] L. M. Sutherland, P. F. Middleton, A. Anthony, J. Hamdorf, P. Cregan, D. Scott, and G. J. Maddern, “Surgical simulation: A systematic review,” Ann. Surg., vol. 243, no. 3, pp. 291–300, 2006.
145
[14] R. J. Adams, D. Klowden, and B. Hannaford, “Virtual training for a manual assembly task,” Haptics-e J., vol. 2, no. 2, pp. 1–7, 2001. [15] J. C. Rosser, Jr, P. J. Lynch, L. Cuddihy, D. A. Gentile, J. Klonsky, and R. Merrell, “The impact of video games on training surgeons in the 21st century,” Arch. Surg., vol. 142, no. 2, pp. 181–186, 2007. [16] Y. A. Fery and S. Ponserre, “Enhancing the control of force in putting by video game training,” Ergonomics, vol. 44, pp. 1025–1037, 2001. [17] C. S. Green and D. Bavelier, “Exercising your brain: A review of human brain plasticity and training-induced learning,” Psychology Aging, vol. 23, pp. 692–701, 2008.