©2015 Scienceweb Publishing Journal of Agricultural and Crop Research Vol. 3(8), pp. 130-140, December 2015 ISSN: 2384-731X Research Paper
Technical efficiency differentials between rice production methods: the case of Conventional and System of Rice Intensification in West Kano Irrigation Scheme, Kenya Mwatete G. K. K.1 • Kipkoech A. K.2* • Kipkorir E. C.3 • Sumukwo J.1 1
2
Department of Applied Environmental Social Sciences, University of Eldoret, P.O. Box 1125, Eldoret, Kenya. Department of Agricultural Economics and Rural Development, University of Eldoret, P.O. Box 1125, Eldoret, Kenya. 3 Department of Civil and Structural Engineering, University of Eldoret, P.O. Box 1125, Eldoret, Kenya. *Corresponding author. E-mail:
[email protected].
Accepted 28th September, 2015.
Abstract. The study was conducted at West Kano rice scheme in Western Kenya, involving field survey of a sample of 123 households and field experiments to compare Conventional with System of Rice Intensification (SRI) production methods. Statistical Programme for Social Scientists (SPSS) version 17.0 was used to describe relationships between rice production and different socio-economic variables while STATA version 12 was used to compare the technical efficiencies between two rice production systems. Results of the study showed that most (89%) of the households in the study area depended on rice production for consumption and income. The SRI system saved about 64% of water compared with the conventional paddy system. Conventional method used 95% chemicals (inorganic fertilizers) compared to SRI method (5%). The SRI farmers are relatively more technical efficiency (83%) than farmers using the Conventional method (75%). Farmers improved efficiency using SRI system arise from the wide crop spacing of 25 cm × 25 cm and use of younger seedlings (8 to 12 days). In conclusion, adoption of SRI is critical to the achievement of efficiency in rice production in West Kano. Benefits of SRI system is enhanced through its reduced use of inorganic fertilizers thus saving the environment and the cost of input incurred by household in producing rice. Keywords: Technical efficiency, rice, production, households.
INTRODUCTION Globally rice is one of the most important food crops in the fight against hunger. Unlike maize and wheat that are consumed as human and livestock feed, rice remains the most favoured grain for human consumption (Ogundele and Okoruwa, 2006). Development of rice presents an opportunity to reduce the number of gravely food insecure people that stands at 816 million, by half, by 2015 (GOK, 2008). In Kenya, rice is the third most important staple food crop after maize and wheat, where 95% of the crop is grown under irrigation in paddy schemes of continuous flooding (GOK, 2005). With limited resources of land and capital among the smallholder rice farmers, there is need for a better
production method that improves rice efficiency and productivity. In spite of the great potential that exists for rice production in Kenya, domestic demand continues to outstrip supply. Because of the changing eating habits in Kenya, the annual rice consumption is increasing at a rate of 12% as compared to 4% for wheat and 1% maize (GOK, 2008). In the rice production areas of Kenya, over 93% of all the primarily depend on rice production as the main source of income (Kipkorir, 2012a). Rice in Western Kenya is mostly grown under the conventional method of continuous flooding that is creating increasing demand for more water and inorganic fertilizers. The continuous
J. Agric. Crop Res. / Mwatete et al.
paddy rice production has led to reduction in land productivity and per/hectare water availability and increasing demand for inorganic fertilizers to maintain productivity leading to the increase in the cost of inputs negatively affecting the livelihoods of the farmers (Kipkorir, 2012b). Still, the scarcity of water resources due to climate change and the high electricity costs for pumping water have presented hurdles to sustainable rice cultivation in western Kenya irrigation schemes. The challenge has become a rallying call by scientists and policy makers to develop interventions that would ensure reduction in demand for inputs (including water, energy, fertilizers, pesticides, land and labour) while maintaining optimal rice yields. The System of Rice Intensification (SRI) methods provide an opportunity for farmers to increase the efficiency and rice production. The SRI method has the potential to increase the yield, reduce demand for water and improve the livelihoods of the farmers (Kipkorir, 2012b). SRI concepts and practices continued to evolve as they were being adapted to rain-fed conditions and with transplanting being superseded by direct-seeding sometimes (Norman, 2013). Interestingly, in Madagascar, rice yields under SRI reported has been up to 10 tons per hectare, without adding any mineral fertilizers compared to about 5.5 to 7.0 tons/ha reported in the study area, under similar rice production conditions (Laulanie, 2011). Under the SRI system, seedlings can be raised in a way that they could be transplanted along with the seedbed soil without disturbing the root system 8 to 12 days after sowing thereby tapping the maximum tillering potential (Norman, 2013) compared to the conventional method, where a wider spacing is recommended to create better microenvironment for higher number of tillers. While conventional methods required continuous watering of the rice plants, SRI method saves on water since only alternate wetting and drying of 14 days after transplanting to end of vegetative stage and flooding similar to conventional for the remaining part of the season is required (Mati, 2010) to create an aerobic condition at the root zone. In order to ensure increase of rice production and market competitiveness, improvement of productivity of rice production resources by removing production inefficiency is important (Kim et al., 2012). The overall objective of this study was to establish the differentials in technical efficiency between Conventional and SRI rice production methods at West Kano irrigation scheme of western Kenya. MATERIALS AND METHODS Conceptual framework Production theory provides the relationship between the factors of production and the output of goods and
131
services (Clayton, 1995). Production is economic process of converting inputs into outputs (Koutsoyiannis, 2008) per given period of time. The production of an economic good or service requires a combination of factors: land, labour, water, capital inputs, entrepreneurship and incomes to purchase the inputs; and all combinations affect both output and the cost of production (Clayton, 1995). Rice production also requires a range of productive resources. The amount of rice produced by an household (i) using a set of resources (Xis) determines th the efficiency of the i household. The efficiency of a rice producing household is a function of the socio-economic characteristics of the household. Technical efficiency was measured by mode of truncated normal distribution (that is, Ui), assuming it to be a function of socioeconomic factors as shown in Equation 1 (Ogundele and Okoruwa, 2006): (1) Where Ui is the technical inefficiency effect, X1i is education of the farmer, X2i is age of farmer, X3i is years of farming experience (rice only), X4i is household size and β0 to β4 are parameters to be estimated. Estimation and analysis of technical efficiency Stochastic Frontier Analysis (SFA) approach was used to estimate and analyze the technical efficiency of the two methods of rice production. Measuring of the level of technical efficiency is done by the distance a particular rice production method is from the production frontier (Kipkoech et al., 2008; Donkoh et al., 2013). For a rice production method to be referred to as technically efficient, it has to produce at the production frontier level (Kibirige, 2008). TE is measured as the distance from observed input combination and the best combination point (technically efficient). It takes a value between 0 (0%) and 1 (100%) in which case a value of 1 (100%) implies that a farm is fully efficient. With an output-increasing orientation, TE is obtained by comparing the observed output with that which could be produced by a fully efficient method, given the same bundle of inputs. In measuring the technical efficiency, the study compared the technical efficiency of Conventional rice production method as applied by the rice farmers in the scheme, differentiating it (the efficiency) with those of the two rice production methods (Conventional and SRI) as applied by the study in the field trial plots. In this study, the Cobb-Douglas stochastic frontier model estimated is defined by Equation 2: lnYit = δ0 + δ1lnR1it + δ2lnR2it + δ3lnR3it + δ4lnR4it + δ5lnR5it + δ6lnR6it + δ7lnR7it + δ8lnR8it + δ9lnR9it + e (2) th
th
Where subscripts i and t refer to the i farmers and t
132
J. Agric. Crop Res. / Mwatete et al.
observations, respectively, while Y is grand revenue of rice (KShs), R1 is cultivated land area for rice (own and leased) (acre), R2 is sum of family labour (for puddling, nursery preparation, transplanting, weeding, birds scaring, harvesting, drying and bagging) (person days), R3 is sum of hired labour (labour for puddling, nursery preparation, transplanting, weeding, birds scaring, harvesting, drying and bagging) (person days), R4 is quantity of seeds planted (kg), R5 is quantity of fertilizer used (organic and inorganic) (kg), R6 is quantity of pesticides and herbicides used (litres), R7 is mechanical costs (land ploughing, harrowing, rotavation, levelling) (KShs), R8 is water costs for maintenance and operations (KShs), R9 is age of farmers (years), e is the error term, ln is the natural logarithm (that is, to base e) and δ0 to δ9 are parameters to be estimated. Stochastic Frontier Analysis approach Stochastic Frontier Analysis (SFA) approach measures production efficiency, considering stochastic noise in data, with respect to correlation between observed output and corresponding output potential (Oren and Alemdar, 2005; Hossain et al., 2012). The alternative method of Data Envelopment Analysis (DEA) approach was not favoured because it does not account for random variation in the data; it ignores statistical errors and it does not state on how to improve efficiency (Ngui-Muchai and Muniu, 2012; Jorda et al., 2012). Comparative studies reveal that efficiency scores estimated using DEA and SFA were different, and those yielded by SFA were more credible than those yielded by DEA. Donkoh et al. (2013) found out that the best approach to be used in estimating and analyzing the TE of rice farmers is SFA. Apart from yielding credible estimates, SFA allows determination of marginal effects of independent variables on technical efficiency of a technology through determination of the variance parameter (Ngui-Muchai and Muniu, 2012). Besides that, the input and output prices were known, hence, the SFA was adopted for the current study. Sampling techniques This study involved both experimental and comparative research designs. Primary data was collected between years 2012 to 2013 through administration of questionnaires, interviews, focused group discussions, document analysis, observation, photography, field experiments/trials (that looked at inputs, spacing of seedlings, rice varieties, water regimes, fertilizer rates and rice yields per rice production method). The official population size in West Kano was 782 households 17 rice blocks (GOK, 2012). West-Kano rice irrigation scheme was chosen due to a predetermined study that was going on, funded by the National Commission of Science, Technology and Innovation (NACOSTI). Following
Sumukwo et al. (2013), the sample size was arrived at, based on the formulae given in Equation 3: (3) Where n is sample size, N is population size, V is coefficient of variation (30%) and e is standard error (2.5% of target population). The computed sample size, n, was 123 households. Data was collected on respondent’s socio-economic characteristics, rice production costs, rice yields, technology of rice production used, rice varieties used, experience of rice farming, exposure to trainings on rice production and constraints of Conventional and SRI systems. During the 2012 short rains growing season two rice varieties, IR2793 and basmati 370, were cultivated. The s o i l o f t h e field site considered was p r i m a r i l y clay. The scheme receives a mean annual precipitation of 1100 mm, reference evapotranspiration of 2200 mm per annum, mean diurnal temperature of 23°C, and a relative humidity of 68 to 70% (Kipkorir, 2012b).
Field experiments/trials Description of experimental factors The experimental factors considered were two irrigation water regimes, t h e two rice varieties and two different spatial crop patterns. Irrigation water regimes: Two irrigation water regimes were tested in the rice field trails as follows: (a) Conventional paddy rice system, where water layer of 5 cm was maintained in the field and drained 2 weeks before harvesting. In total 11 irrigation events were applied after accounting for the rainfall events; and (b) Intermittent water application of water up to a depth of 2 cm at irrigation intervals ranging from five to seven days referenced to when hair sized cracks were observed on the plots (S2). With this water regime a total of nine irrigation events were applied after accounting for the rainfall events. The intermittent irrigation regime was only applied two weeks from transplanting till tillering process was complete at flag leaf stage of growth and thereafter a constant water layer of 2 cm was maintained in the field till the final field drainage which was done two weeks before harvesting. The applied 2 water to a total of two blocks (total area A = 1419.3 m
J. Agric. Crop Res. / Mwatete et al.
133
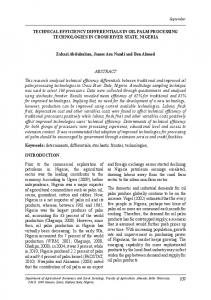
Figure 1. Experimental field layout in West Kano irrigation site.
2
for conventional and A = 1584.8 m for SRI) and each divided into four plots, under a given water regime was measured by determining the time in seconds required to fill a 20-L bucket by water flowing through a 75 mm in diameter plastic pipe installed in a feeder canal to supply irrigation water.
Treatment variables and factor combinations: The field trials tested four treatment combinations under the two distinct irrigation regimes. The main variables included the following: i) two rice varieties namely IR 2793 and basmati 370; ii) two different spatial crop patterns for Conventional and SRI method. For Conventional, two spacing levels at 15 cm × 10 cm (C1) and 20 cm × 20 cm (C2) were considered, while the SRI method were spaced at 25 cm × 25 cm (S1) and 35 cm × 35 cm (S2). The fertilizer level used for SRI fields was a mixture of
organic fertilizer (cattle manure) at the rate of 5 tons/acre plus inorganic nitrogen at the rate of 4.41 kg N/acre. The organic manure was applied before transplanting. The N application was split twice. The fertilizer level for Conventional rice method was only in the form of inorganic nitrogen at the rate of 4.41 kg N/acre also split twice. Therefore, the experiment comprised of eight experimental plots: Four plots under Conventional (C1, C2, C3 and C4) and four plots under SRI (S1, S2, S3 and S4), as shown in the field layout in Figure 1. Weeding was done twice for Conventional plots by manually pulling the weeds while it was done three times for SRI plots using hand weeding machine. The maximum root depth of the crop was measured after the mid season as 0.15 m. For all the plots, water application was stopped two weeks before harvesting. The crop was cut and harvested in the field 105 days after transplanting (DAT) (Conventional) and 110 DAT (SRI) for basmati 370 variety and 120 DAT (conventional) and 130 DAT (SRI) for IR 2793 variety.
134
J. Agric. Crop Res. / Mwatete et al.
Yield for a plot in each treatment was determined from mean weight of field grain rice harvested from five quadrants and dried to 12.5% moisture content. Yields of the two rice varieties tested were collected for analysis.
Experimental field layout: The four experimental plots for Conventional rice method had each a net area in the range 298.2 to 2 399.3 m while the four plots under SRI had each a 2 net area in the range 305.0 to 521.5 m . In each plot during harvest, five quadrants were randomly selected and sample crop was harvested to compute grain yield and yield components. The fields for the two different irrigation water regimes were divided by 2.0 m wide permanent bund running south – north with very minimal uncontrolled water flows between the two adjacent blocks. The individual plots within each block were separated by 0.5 m wide bunds of 5 cm in height that either served as an irrigation or drain canal (Figure 1).
Data analyses The study compared the technical efficiency of Conventional rice production method as applied by the rice farmers in the scheme, differentiating the efficiencies between the two rice production methods (Conventional and SRI) using data from the field trial plots. Statistical Programme for Social Scientists (SPSS) version 17.0 was used to determine relationships between different variables and STATA (12) computer software in assessing the technical efficiencies. RESULTS AND DISCUSSION Analysis of major socioeconomic characteristics of households The female headed households constituted 57% of the sample while the male represented 43%. Considering that most of the farm operations in rice cultivation (land clearing, tilling, weeding and harvesting) were labor intensive, households utilized most of the available household labor. The average household size was 5 to 14 persons for 84% of the households, which was adequate for farm operations making the cost of hired labor to be insignificant. The respondents’ age groups range from productive ages (44%) of 20 to 40 years. Table 1 summarizes the descriptive statistics of the main socioeconomic characteristics of the households. Majority (85%) of the respondents had formal education and among these 42% had primary education. The fact that about 43% of the respondents had secondary educa-
tion and above, means that it was possible for the farmers to adopt better efficient rice technologies since education is an important instrument in new skill acquisition and technology transfer. Most (88%) of the respondents indicated that their main source of income was farming. Thus, increasing efficiency of rice production would lead to a higher probability of poverty reduction in the area. Factors affecting the level of technical efficiency among rice farmers Table 2 shows the linear regression results of TE scores against explanatory variables as generated through STATA 12 computer programme. All four variables (rice production method, hired labour costs, rice variety and fertilizer) in Table 2 (P < 0.05) were significant in influencing the TE levels in rice production. This therefore led to the rejection of the null hypothesis that the four variables do not determine TE of rice production. Two (rice production method and hired labour costs) of the four variables were found to be positively related (positive signs) and significantly affecting technical efficiency (Table 3), which was in agreement with the estimation of stochastic frontier function in Table 4. All the eight mentioned factors were found to be determining the TE of rice production, except level of formal education (P > 0.05) and experience of farmer (P > 0.05) in rice production (Table 3). This was attributed to the fact that rice production in the area used only labor intensive traditional methods. The introduced SRI technology that would require additional skills in management of household resources was still in the process of being adopted in the areas during the time of research and was only tested by farmers. Most interesting was the high F-value (39.90) for rice production method and F-value 12.63 for fertilizers, which indicate that rice production method and fertilizer application significantly affects TE of rice production. Rice production method (P < 0.05) had a positive and significant effect on TE, which was in agreement with the earlier observation that SRI method had a positive effect on increased productivity, spacing of 25 cm × 25 cm being the optimal on rice production, beyond which producing achieve diminishing returns to factors of production (Figure 3). Other factors that significantly affected TE were the age of farmer (P < 0.05) and hired labour costs (P < 0.05). The coefficient of age variable was negative and significant, meaning that as farmers’ age up, there was a tendency that productivity will continue to fall. This could be attributed to the fact that the total labor (man-days per season) per household head decreased with increasing age. Rice variety did not significantly affect TE, meaning that cost of production did not change significantly irrespective of rice variety used.
J. Agric. Crop Res. / Mwatete et al.
135
Table 1. Descriptive statistics of socioeconomic characteristics of the households.
Variable Gender
Description Female Male
Percent 57 43
Household size
5 – 9 persons 10 – 14 persons 15 – 19 persons 20 – 29
54 30 16 8
Age ( years)
30 – 35 36 – 40 41 – 49 Over 50 years
17 19 37 19
Major source of income
Fishing Trading Farming
1 11 88
Education
No. formal schooling Primary school Secondary school Technical/college
15 42 31 12
Income per annum (KShs.)
30,000 – 59,000 60,000 – 119,000 120,000 and above
7 11 82
Irrigation land allocated by National Irrigation Board
2 acres 4 acres
47 53
Rented Irrigated land from others
0 acres 2 acres
89 11
Source: Survey data, 2012.
Effects of rice technologies on farming efficiency SRI and Conventional methods of rice production also influences efficiency of irrigation water use and ultimately costs. Out of 11 comparable irrigation events, Conventional method used a total of 706 mm depth of water, while SRI used 253 mm depth of water, indicating that SRI system saved about 64% of water compared with the Conventional rice production method. Further, SRI method had seed savings of up to 75% compared to Conventional method. Hence, the findings imply that the farmers who adopted the SRI system stand a better chance of increasing their production and hence their income from rice farming. Conventional method used 94.8% chemicals (inorganic fertilizers), compared to SRI method that utilized 5.2% only, hence using less chemicals by 89.7% (Figure 2).
This was because SRI uses 5,000 kg of compost (organic manure) per acre instead of the inorganic fertilizers for planting and topdressing. Though the grand cost (input) was high for SRI method (at KShs. 91,360 for an acre) compared to KShs. 79,980 for Conventional method of rice production, the profit for SRI method surpasses that of Conventional by a margin of KShs. 46,895 per acre. The comparative performance of the rice technologies was illustrated in the Figure 3. The figure shows that the profit (total revenue from the sales of rice) was higher for the SRI method than the Conventional rice production method. Even for the Conventional method, the spacing of 20 cm × 20 cm of rice was better than that of 15 cm × 10 cm. The best spacing, however, that provides the highest revenue was that of SRI 25 cm × 25 cm. This gives an average income of about KShs. 188,343 per growing season compared
136
J. Agric. Crop Res. / Mwatete et al.
Table 2. Production function, showing determinants of technical efficiency levels in rice production (experimental data).
Variable Rice production method Constant
Coefficient 0.29 4.21
Std. Error 0.07 0.24
t-value 3.94 17.35
P-value 0.00 0.00
Hired labour costs Constant
3.70 -8.15
0.72 2.61
5.11 -3.13
Rice variety Constant
-0.51 6.78
0.10 0.31
-0.51 6.76 40
0.10 0.31
a
Fertilizer Constant No. of observation a
F-value
Adjusted R
15.53
0.27
0.00 0.00
26.09
0.39
-5.19 21.77
0.00 0.00
26.95
0.40
-5.11 21.58
0.00 0.00
26.09
0.39
2
Fertilizer cost varies significantly with the grand cost. Source: Survey data, 2012.
Table 3. Production function, showing determinants of technical Efficiency levels in rice production (household data).
Variable
Coefficient
Std. Error
t-value
P-value
F-value
Adjusted R
Rice production method Constant
3.43 1.69
0.54 0.54
-6.32 31.50
0.00 0.00
39.90
0.24
Hired labour costs Constant
1.63 -4.20
0.36 1.32
39.56 7.35
0.00 0.00
2.10
0.00
Rice variety Constant
-1.93 1.53
1.09 0.06
-1.76 27.67
0.00 0.00
3.11
0.02
Fertilizer Constant
-3.40 6.19
0.96 1.33
-3.55 4.66
0.00 0.00
12.63
0.09
Household size
0.51
0.77
0.67
0.01
Constant
1.45
0.06
22.65
0.00
0.44
0.00
Age of farmer Constant
-2.08 1.82
0.71 0.13
-2.91 14.33
0.00 0.00
8.49
0.06
Level of education Constant
1.00 1.59
0.81 0.11
-1.24 15.11
0.22 0.00
1.53
0.00
Experience of farmer Constant
-1.05 1.89
0.64 0.26
-1.65 7.37
0.10 0.00
2.72
0.01
Number of observation
2
123
Source: Survey data, 2012.
with the best of Conventional which was about KShs. 130,068 per growing season. Hence, for optimal rice yield and revenue generation, the rice production method to use was SRI with spacing of 25 cm × 25 cm. The analysis
clearly indicates that Conventional 20 cm × 20 cm gives profit margin of KShs. 50,088, SRI 25 cm × 25 cm was KShs. 96,983 while profit through practicing SRI 35 cm × 35 cm drops to KShs. 72,186.
J. Agric. Crop Res. / Mwatete et al.
137
Table 4. Estimates of the Stochastic frontier production function of factors influencing rice production revenues.
Variable b Cost of irrigation water Cost of hired labour Grand cost Rice varieties Cons /lnsig2v /lnsig2u Sigma_v Sigma_u Sigma2 lambda
Coef. 0.62 3.72 -21.58 -0.51 -2.07 -9.21 -15.52 0.01 0.00 0.00 0.04
Std. error 0.75 0.38 0.90 0.05 0.62 0.23 90.89 0.00 0.02 0.00 0.02
Z 0.82 9.68 -7.25 -9.76 -3.34 -39.75 -0.17
P>[z] 0.41 0.00 0.00 0.00 0.00 0.00 0.86
[95% Conf. Interval] -0.85 2.09 2.97 4.48 -3.20 -1.35 -0.62 -0.41 -3.28 -0.86 -9.66 -8.75 -193.65 162.62 0.01 0.01 0.00 0.02 0.00 0.00 0.00 0.08
b
The per ha cost of irrigation water varies significantly with the method of producing rice. Likelihood-ratio test of sigma_u = 0: chibar 2 = 0.00 Prob>chibar2 = 1.000. Source: Survey data, 2012.
Figure 2. Chemical application for rice production methods per acre.
Technical efficiency differentials in rice production methods Estimation of Stochastic production frontier The frontier (rice production method with optimal rice yields) of the various rice production methods was determined as to be SRI 25 cm × 25 cm as shown in Figure 3. The dependent variable of the estimated model was the grand revenue of rice out of SRI method of 25 cm × 25 cm spacing. This was the rice production method
that produced the highest rice yield from the experimental field trial plots as shown in Figure 3. The independent variables were rice production method, irrigation costs, hired labour costs, grand costs (fertilizer and seeds costs) and rice varieties (Table 4). For the stochastic frontier function, the results revealed that the marginal effects on technical efficiency were all positive except for rice varieties. Cost of irrigation water was a proxy for the rice method, because it changes based on different rice method, though not significantly. The cost of irrigation water did not influence the total cost
138
J. Agric. Crop Res. / Mwatete et al.
Figure 3. Marginal revenue changes for rice production methods.
Table 5. Frequency distribution of technical efficiency for rice production methods in percentages (experimental data).
Ranges of efficiency t) = 0.0010
(Table 5). The household data showed that 45.1% of farmers using Conventional methods to produce rice operated at levels below the average 60% range of efficiency. The t-test of technical efficiency for conventional and SRI methods The STATA 12 computer programme was used to test and compare efficiency levels of rice production methods, Conventional and SRI methods (Table 7). The t-test was done between the profit margins of the optimal rice production method, SRI 25 cm × 25 cm and of the lowest yielding rice production method practiced by 80% of rice farmers in the scheme, Conventional 15 cm × 10 cm. The results in Table 7 showed that SRI method had a relatively higher level of mean technical efficiency (83.02%) than the Conventional method (74.64%), which was a significant difference (8.38%) between the two methods of rice production. Adopting SRI therefore would enable farmers to improve their TE and hence rice output. These results indicated that SRI method was more efficient than Conventional method in rice production, which was in agreement with observations made above. This indicated that there was big opportunity (25.36%) to increase technical efficiency for the farmers practicing the conventional method of rice production to increase the production capacity in West Kano irrigation scheme. CONCLUSIONS AND RECOMMENDATIONS The study revealed that the major socioeconomic
characteristics among households in West Kano irrigation scheme were age of farmer, level of education, rice farming experience and household size. The females constituted 57% of the sample while the male represented 43% of the total households and also 56% of the rice farmers in West Kano scheme were beyond the productive age of 20 to 40 years. Considering that most of the farm operations in the rice cultivation, such as land clearing, tilling, weeding and harvesting, require a lot of strength and energy, the majority of the rice farmers, who were of female gender and mostly beyond the productive age, they may have to hire young and energetic people to do the work, hence incur more labour costs. However, with 84% of the households comprising size of between 5 to 14 persons, it was recommended that as the rice farmers engage their family labour, it should be done in a manner that would not lead to low uptake of formal education among the young ones. Majority (85%) of the respondents had formal education and among these 42% had primary education. Education was an important instrument in new skill acquisition and technology transfer. The fact that about 43% of the respondents had secondary education and above means that it was possible for the farmers to adopt better efficient rice technologies. Most (88%) of the respondents indicated that their major source of income was farming, meaning that if the efficiency of rice production was improved, there would be high probability of poverty reduction. In testing the determinants of technical efficiency in rice production, rice production method had a significant effect on efficiency. This means that the adoption of SRI was critical to the achievement of efficiency in rice production in West Kano. Hired labour costs (P < 0.05) were found to be positively and significantly affecting TE
140
J. Agric. Crop Res. / Mwatete et al.
which means that there was diminished returns of hired labour. Therefore, there was need to introduce mechanized system that could improve effectiveness of labour inputs. Since the respondents indicated that diseases and pests, inadequate irrigation water and low prices of rice produced were the major problems facing rice farmers, these deterrents to productivity should be addressed by improving rice marketing strategies and better access to disease and pests control inputs. Inasmuch as most (89%) of the households in the study area were farmers who depended on rice production for consumption and commercial purposes, results revealed that the rice farmers were not technically efficient in applying the Conventional rice production method. The results also showed that SRI method had a relatively higher level of mean technical efficiency (83%) than the Conventional method (75%). These results indicated that SRI method was more efficient than Conventional method in rice production. In order to ensure increase of rice production and to be equipped with market competitiveness, it was important to improve productivity by removing inefficiency of rice production. Improved technical efficiency of the rice in Western Kenya was important, considering its contribution to the improved food security, increased smallholder rice farmers’ income and poverty alleviation, contribution to employment creation in Western region, reduction of the national rice import bill and optimization of the scarce water use. For faster adoption of SRI method, rice farmers need training on SRI through Farmers Field Schools and exposure tours. There was also need of identifying SRI-method interested farmers so as to organize a joint-effort leveling of their farm lands.
ACKNOWLEDGEMENTS National Commission of Science, Technology and Innovation (NACOSTI) is acknowledged for the financial and material support through its “3 Competitive Science, rd Technology and Innovative Grant” (Ref: NCST/5/003/3 STI CALL/188) towards successful completion of this study. Gratitude also goes to the National Irrigation Board (NIB), rice farmers in West Kano irrigation scheme for their cooperation and provision of invaluable information and to the local research assistants for their support in data collection.
Government of Kenya, GOK (2008). National Rice Development Strategy (2008 – 2018). Ministry of Agriculture. Government of Kenya, GOK (2012). West Kano irrigation scheme office records, National Irrigation Board. Hossain MK, Kamil AA, Baten MA, Mustafa A (2012). Stochastic Frontier Approach and Data Envelopment Analysis to Total Factor Productivity and Efficiency measurement of Bangladeshi Rice. PLoS ONE 7(10):e46081. Doi: 10.1371/journal.pone.0046081. Jorda P, Cascajo R, Monzon A (2012). Analysis of the technical efficiency of urban bus services in Spain based on SBM models. International Scholarly Research Network. ISRN Civil Engineering. Volume 2012, Article ID 984758. Kibirige D (2008). Analysis of the impact of the agricultural productivity enhancement program on the technical and allocative efficiency of maize farmers in Misindi District. A thesis on Master of Science in Agricultural and applied economics of Makerere University, Kampala. Kim DH, Seo JN, Kim HS, Lee K (2012). Estimation of productivity growth, technical progress, and efficiency changes in the Korean offshore fisheries. Fish Sci. 78:743-751. Kipkoech AK, Mithöfer D, Yabann WK, Maritim HK, Schulthess F (2008). Assessing yield and efficiency implications of relying on parasitoids for control of cereal stem borers: The case of small-scale maize farmers in Kenya. J. Crop Protect. 27:1318-1326. Kipkorir EC (2012a). Rice productivity, water and sanitation baseline survey report: Western Kenya rice irrigation schemes. Funded by the National Council of Science and Technology (NCST) through the “3 Competitive Science, Technology and Innovative Grant” (Ref: NCST/5/003/3rd STI CALL/188) for the project period 01 January 2011 to 01 January 2014. Kipkorir EC (2012b). Adapting System of Rice Intensification in West Kenya Irrigation Schemes. Funded by the National Council of Science and Technology (NCST) through the “3 Competitive Science, Technology and Innovative Grant” (Ref: NCST/5/003/3rd STI CALL/188) for the project period 01 January 2011 to 01 January 2014. Koutsoyiannis A (2008). Modern Microeconomics: second edition. Published by Palgrave Macmillan. Laulanie HD (2011). Intensive rice farming in Madagascar. Technical notes. Tropicultura 29(3)183-187. Mati BM (2010). System of rice intensification (SRI): Growing more rice with less water. Practical Notes for SRI Farmers. Jomo Kenyatta University of Agriculture and Technology and SRI Resource Centre, Mwea, Kenya. Ngui-Muchai DM, Muniu JM (2012). Firm efficiency differences and distribution in the Kenyan manufacturing sector. Afr. Dev. Rev. 24(1):52-66. Norman U (2013). Non GMO- Development of the System of Rice Intensification (SRI) in Madagascar. International J. Agric. sustain. 1:38-50. Ogundele O, Okoruwa VO (2006). Technical efficiency differentials in rice production technologies in Nigeria. Afr. Econ. Res. Consort. Res. Paper Nairobi. p. 154. Oren MN, Alemdar T (2005). Technical efficiency analysis of Tobacco farming in Southeastern Anatolia. Sumukwo J, Adano Wario R, Kiptui Mark, Cheserek Grace J, Kipkoech AK (2013). Valuation of natural insurance demand for nontimber forest products in South Nandi, Kenya. J. Emerg. Trends in Econ. Manage. Sci. 4(1):89-97.
REFERENCES Clayton GE (1995). Economics principles and practices. Pb. Glencoe Division of Macmillan/ McGraw-Hill School Publishing Company. Donkoh SA, Ayambila S, Abdulai S (2013). Technical efficiency of rice production at the Tono irrigation scheme in Northern Ghana. Am. J. Exp. Agric. 3(1):25-42. Government of Kenya, GOK (2005). Grain production in Kenya. Export Processing Zones Authority.
http://www.sciencewebpublishing.net/jacr