Published December 4, 2014
Technical note: Evolution of exit velocity in suckling Brahman calves1 N. C. Burdick,*2 B. Agado,† J. C. White,† K. J. Matheney,† D. A. Neuendorff,† D. G. Riley,* R. C. Vann,‡ T. H. Welsh Jr.,*§ and R. D. Randel†3 *Texas AgriLife Research and Department of Animal Science, Texas A&M University, College Station 77843; †Texas AgriLife Research, Overton 75684; ‡Brown Loam Branch Experiment Station, Mississippi State University, Raymond 39154; and §Department of Veterinary Integrative Biosciences, Texas A&M University, College Station 77843
ABSTRACT: The purpose of this study was to assess changes in exit velocity (EV) of Brahman calves from 21 d of age (DOA) to 56 d postweaning (231.30 ± 1.23 DOA). Spring-born calves (n = 308) from 2006 to 2008 were sired by 18 bulls. Exit velocity (m/s) was determined as the rate of speed of a calf traversing 1.83 m after being released from a working chute. Temperament score was determined as the average of EV and pen score 28 d before and at weaning (2006: 173 ± 2 DOA; 2007: 174 ± 2 DOA; 2008: 163 ± 2 DOA). Pen score was determined by separating calves into groups of 3 to 5 animals and scoring their reactivity to a human observer on a scale of 1 (calm, docile, approachable) to 5 (aggressive, volatile, crazy). The number of calves that switched temperament group was determined by ranking calves based on their EV at 21 to 24 DOA, 90 DOA, weaning, and at 56 d postweaning. The GLIMMIX procedure of SAS was used to analyze EV with DOA, birth year and sex as fixed effects, and sire and calf nested within sire included as random effects. Temperament classification (calm, intermediate, temperamental) was modeled as a fixed effect, and the linear regression of traits on DOA investigated. Spear-
man rank order correlations were determined between EV at 21 to 24 DOA, 90 DOA, weaning, and 56 d postweaning and correlations decreased as the number of days between EV measurements increased. Differences in EV were observed between the 2006 (2.23 ± 0.057 m/s) compared with the 2007 (1.90 ± 0.059 m/s) and 2008 (1.83 ± 0.057 m/s) calves (P < 0.001), but the 2007 and the 2008 calves did not differ (P = 0.75). The random effect of sire approached significance (P = 0.07) and accounted for some of the variation observed. Exit velocity increased as days of age increased (P < 0.001). Exit velocity of temperamental calves increased at a faster rate with age (P < 0.001; estimate of slope = 0.005 ± 0.0004 m/s daily) compared with intermediate (slope = 0.003 ± 0.0005 m/s daily; P < 0.001) and calm calves (slope = 0.0007 ± 0.0005 m/s daily; P < 0.001). Exit velocity is a useful and viable indicator of temperament classification. Results suggest that temperamental calves increase their EV at a faster rate and may be identified before weaning, which may enhance the ability of producers to select against temperamental animals.
Key words: Brahman calf, exit velocity, temperament ©2011 American Society of Animal Science. All rights reserved.
J. Anim. Sci. 2011. 89:233–236 doi:10.2527/jas.2010-2973
INTRODUCTION Temperament is described as the reactivity of cattle to humans and to novel environments (Fordyce et al., 1988). The increased cost associated with the potential for more excitable or temperamental cattle to injure themselves, workers, and facilities, in addition to the negative effects of temperament on growth, immunity, and carcass characteristics, motivates selection against more temperamental cattle (Voisinet et al., 1997; Fell et al., 1999; King et al., 2006; Cooke et al., 2009). Temperament is most often measured at weaning, and therefore most of the published literature has focused on the effects of temperament during the early
1
The authors acknowledge the technical support of A. Lewis (Texas AgriLife Research, Overton) and J. Lyons (Texas AgriLife Research and Department of Animal Science, Texas A&M University, College Station). This study was supported in part by Texas AgriLife Research Beef Competitiveness Improvement Program; USDA-NRI-CSREES Grant #2005-01671; USDA SG 2006-3456417002; and USDA/CSREES Hispanic Serving Institution Grant Award #2005-38422-15945. 2 Current address: USDA-ARS Livestock Issues Research Unit, Lubbock, TX 79403. 3 Corresponding author:
[email protected] Received March 9, 2010. Accepted September 9, 2010.
233
234
Burdick et al.
preweaning and postweaning period. Burdick et al. (2009) demonstrated that exit velocity (EV) can be measured at an earlier age (21 to 24 d of age), yet EV measurements made that early predicted temperament at weaning in less than 60% of the calves. Therefore, to elucidate the changes in EV in suckling calves, this study was designed to investigate the evolution of EV in calves from 21 d of age (DOA) through 56 d postweaning (i.e., 231.30 ± 1.23 DOA).
MATERIALS AND METHODS All procedures were approved by the Institutional Animal Care and Use Committee of Texas A&M University.
Animals This study utilized 308 Brahman calves sired by 18 bulls, born in 2006 (60 male and 56 female), 2007 (54 male and 55 female), and 2008 (45 male and 38 female). Four bulls were used in more than 1 yr. Calves were weaned at average ages of 173 ± 2, 174 ± 2, and 163 ± 2 DOA for 2006, 2007, and 2008, respectively.
EV Exit velocity was measured as an indicator of temperament as described by Curley et al. (2006). Briefly, the rate of speed of a calf traversing a distance of 1.83 m after its exit from a working chute was determined using 2 infrared sensors (FarmTek Inc., North Wylie, TX) and was done by calculating velocity [velocity = distance (m)/time (s)]. Exit velocity data are presented as meters per second. Exit velocity was measured between 21 to 24 DOA and at 28-d intervals through 56 d postweaning (n = 8 to 10 records per calf; Burrow et al., 1988; Curley et al., 2006). All EV measurements were carried out in a facility in which the calves were isolated temporarily from the sight of but not out of hearing range of their dams. To determine retrospectively if EV change over time was different relative to temperament classification (calm, intermediate, temperamental), calves were ranked from least to greatest (best to worst temperament) based on a direct average of values for EV and pen score (Hammond et al., 1996; temperament score; Burdick et al., 2010) measured 28 d before and at weaning. Ranking based on temperament score was performed within each year. Pen score (Hammond et al., 1996) is a subjective measurement in which cattle are separated into small groups of 3 to 5 animals and their reactivity to a human observer scored on a scale of 1 (calm, docile, and approachable) to 5 (aggressive, volatile, and crazy). Based on temperament score, the calves were grouped into temperament classifications. Calm calves were those 1 SD less than the mean for temperament score (n = 76; 1.21 ± 0.02), temperamental calves were those 1 SD greater than the mean for
temperament score (n = 76; 2.88 ± 0.04), and intermediate calves were all remaining calves (within mean ± 1 SD; n = 156; 1.96 ± 0.03). Within each year, calves were ranked by EV at specific data collection times: 21 to 24 DOA, approximately 90 DOA (89.9 ± 0.5 DOA), weaning (175 ± 1 DOA), and 56 d postweaning (231.30 ± 1.23 DOA). Calves were assigned to 1 of 3 temperament classifications based upon EV at each specific data collection time: calm calves were those 1 SD less than the mean for EV (0.34 ± 0.02 m/s, n = 44; 0.94 ± 0.07 m/s, n = 42; 0.87 ± 0.04 m/s, n = 57; 0.92 ± 0.05 m/s, n = 50 for 21 to 24 DOA, 90 DOA, weaning, and 56 d postweaning, respectively), temperamental calves were those 1 SD greater than the mean for EV (2.66 ± 0.07 m/s, n = 56; 3.71 ± 0.10 m/s, n = 44; 3.74 ± 0.07 m/s, n = 58; 3.80 ± 0.08 m/s, n = 49 for 21 to 24 DOA, 90 DOA, weaning, and 56 d postweaning, respectively), and intermediate calves were all others (within mean EV ± 1 SD; 1.15 ± 0.03 m/s, n = 208; 1.93 ± 0.05 m/s, n = 221; 2.05 ± 0.05 m/s, n = 193; 2.12 ± 0.05 m/s, n = 209 for 21 to 24 DOA, 90 DOA, weaning, and 56 d postweaning, respectively).
Statistical Analysis The GLIMMIX procedure (SAS Inst. Inc., Cary, NC) was used to analyze EV, with DOA (as a linear covariate), birth year, and sex included as fixed effects and sire and calf nested within sire included as random effects. An additional analysis was conducted using the GLIMMIX procedure with the same effects to evaluate differences due to temperament classification measured 28 d before and at weaning. Temperament classification was modeled as a fixed effect (3 levels: calm, intermediate, and temperamental), and the linear regression of traits on DOA was investigated across levels and within each temperament classification. Least squares means were calculated for the variables birth year and sex. Spearman rank correlations were determined between EV measured at 21 to 24 DOA, 90 DOA, weaning, and at 56 d postweaning using the CORR procedure of SAS. Proportions of calves in each temperament classification at each age were compared with χ2 expectation using the FREQ procedure of SAS.
RESULTS AND DISCUSSION Exit velocity, or flight speed, is emerging as the most objective measurement of temperament in cattle (Fell et al., 1999; Curley et al., 2006; Müller and von Keyserlingk, 2006). The current study was designed to study the evolution of EV in calves from 21 DOA through 56 d postweaning. We report herein that EV can be used to identify temperamental animals before weaning and is a useful and viable indicator of postweaning temperament classification. The distribution of calves in temperament classifications did not differ from χ2 expectation (P > 0.05) at
Evolution of exit velocity
235
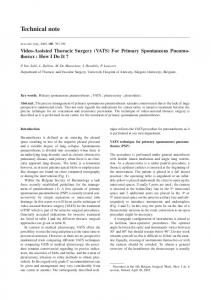
Figure 1. Change in exit velocity (EV) over days of age (DOA) by temperament group in Brahman calves. Exit velocity, the rate of speed of a calf traversing a distance of 1.83 m after its exit from a working chute, was determined using 2 infrared sensors (FarmTek Inc., North Wylie, TX) and was done by calculating velocity [velocity = distance (m)/time (s)]. Exit velocity data are presented as meters per second. Exit velocity was measured between 21 to 24 d after birth and at 28-d intervals through 56 d postweaning. Calves were grouped into temperament groups based on temperament score (average of EV and pen score) measured 28 d before weaning. Calm: n = 76, slope estimate = 0.0007 ± 0.0005 (solid line); intermediate: n = 156, slope estimate = 0.003 ± 0.0005 (intermittent line), and temperamental: n = 76, m = 0.005 ± 0.0004 (dashed line; temperament group P < 0.001). Average EV at 21 to 24 DOA, at approximately 90 DOA (89.9 ± 0.5 DOA), at weaning (175 ± 1 DOA), and at 56 d postweaning (231.30 ± 1.23 DOA) are represented by triangles (calm), circles (intermediate), and squares (temperamental).
any time point. Approximately 15.7% were expected to be in the calm group (determined by dividing total observations classified as calm by the total number of observations), 67.5% were expected to be in the intermediate group, and 16.8% were expected to be in the temperamental group. Spearman rank order correlations were also determined between EV at 21 to 24 DOA, 90 DOA, weaning, and 56 d postweaning. Spearman rank correlation values decreased (P < 0.001) as the number of days between EV measurements increased. Average of EV across all dates differed across years, with the 2006 calves having a greater average EV (2.23 ± 0.06 m/s; P < 0.001) compared with calves in 2007 (1.90 ± 0.06 m/s) and 2008 (1.83 ± 0.06). There was no difference in EV between calves in 2007 and 2008 (P = 0.75). There was no difference in EV between bulls and heifers (P = 0.18; 1.91 ± 0.08 m/s and 2.02 ± 0.09 m/s, respectively). A study with Braford, Simmental × Red Angus, Red Brangus, Simbrah, and Tarentaise × Angus breeds reported that heifers had a greater temperament score than steers (Voisinet et al., 1997). Burdick et al. (2009) did not find an effect of sex on EV either at 21 to 24 DOA or at weaning in Brahman calves. In the current study, random effects of sire (P = 0.07) and calf within sire (P < 0.001) explained substantial variation in EV, thus suggesting additive genetic variation for EV in this population.
Exit velocity increased as DOA increased (slope estimate = 0.0029 ± 0.0002; P < 0.001). These data are in agreement with our earlier work (Burdick et al., 2009), which demonstrated that EV at weaning was greater than at 21 to 24 DOA. The current study is apparently one of the first to document and assess temporal changes in EV in suckling beef calves. The variable “temperament group” was analyzed to determine differences in EV based on temperament at weaning. Analysis revealed that the EV of temperamental calves increased at a faster rate (P < 0.001; Figure 1; slope estimate = 0.005 ± 0.0004 m/s each day) compared with intermediate (slope estimate = 0.003 ± 0.0005 m/s each day; P < 0.001) and calm calves (slope estimate = 0.00007 ± 0.0005 m/s each day; P < 0.001). Therefore, not only did temperamental calves have a greater EV at 21 to 24 DOA, but their EV also increased at a faster rate than did the EV of calm and intermediate calves. The use of EV to determine temperament of cattle is simple to implement and is safe for both cattle and workers (Burrow, 1997; Müller and von Keyserlingk, 2006). Exit velocity can be determined without restricting animal movement, in contrast to other methods including chute score and determination of eye white percentage (Grandin, 1993; Core et al., 2009).
236
Burdick et al.
In conclusion, EV increases over time in suckling Brahman calves and was not affected by sex of calf. Calf sire may account for some variability in EV. Exit velocity of temperamental calves increased at a faster rate compared with the EV of calm and intermediate calves. Results of the current study suggest that temperament may be identified before weaning using EV, which may enhance the ability of producers to select against temperamental animals.
LITERATURE CITED Burdick, N. C., J. P. Banta, D. A. Neuendorff, J. C. White, R. C. Vann, J. C. Laurenz, T. H. Welsh Jr., and R. D. Randel. 2009. Interrelationships among growth, endocrine, immune, and temperament variables in neonatal Brahman calves. J. Anim. Sci. 87:3202–3210. Burdick, N. C., J. A. Carroll, L. E. Hulbert, J. W. Dailey, S. T. Willard, R. C. Vann, T. H. Welsh Jr., and R. D. Randel. 2010. Relationships between temperament and transportation with rectal temperature and serum concentrations of cortisol and epinephrine in bulls. Livest. Sci. 129:166–172. Burrow, H. M. 1997. Measurements of temperament and their relationships with performance traits of beef cattle. Anim. Breeding Abstr. 65:477–495. Burrow, H. M., G. W. Seifert, and N. J. Corbet. 1988. A new technique for measuring temperament in cattle. Proc. Aust. Soc. Anim. Prod. 17:154–157. Cooke, R. F., J. D. Arthington, D. B. Araugo, and G. C. Lamb. 2009. Effects of acclimation to human interaction on performance, temperament, physiological responses, and pregnancy rates of Brahman-crossbred cows. J. Anim. Sci. 87:4125–4132.
Core, S., T. Widowski, G. Mason, and S. Miller. 2009. Eye white percentage as a predictor of temperament in beef cattle. J. Anim. Sci. 87:2168–2174. Curley, K. O. Jr., J. C. Pascal, T. H. Welsh Jr., and R. D. Randel. 2006. Technical note: Exit velocity as a measurement of cattle temperament is repeatable and associated with serum concentration of cortisol in Brahman bills. J. Anim. Sci. 84:3100– 3103. Fell, L. R., I. G. Colditz, K. H. Walker, and D. L. Watson. 1999. Associations between temperament, performance and immune function in cattle entering a commercial feedlot. Aust. J. Exp. Agric. 39:795–802. Fordyce, G., R. M. Dodt, and J. R. Wythes. 1988. Cattle temperaments in extensive beef herds in northern Queensland. 1. Factors affecting temperament. Aust. J. Exp. Agric. 28:683–687. Grandin, T. 1993. Behavioral agitation during handling of cattle is persistent over time. Appl. Anim. Behav. Sci. 36:1–9. Hammond, A. C., T. A. Olson, C. C. Chase Jr., E. J. Bowers, R. D. Randel, C. N. Murphy, D. W. Vogt, and A. Tweolde. 1996. Heat tolerance in two tropically adapted Bos taurus breeds, Senepol and Romosinuano, compared with Brahman, Angus, and Hereford cattle in Florida. J. Anim. Sci. 74:295–303. King, D. A., C. E. Schuehle Pfeiffer, R. D. Randel, T. H. Welsh Jr., R. A. Oliphint, B. E. Baird, K. O. Curley Jr., R. C. Vann, D. S. Hale, and J. W. Savell. 2006. Influence of animal temperament and stress responsiveness on the carcass quality and beef tenderness of feedlot cattle. Meat Sci. 74:546–556. Müller, R., and M. A. G. von Keyserlingk. 2006. Consistency of flight speed and its correlation to productivity and to personality in Bos taurus beef cattle. Appl. Anim. Behav. Sci. 99:193–204. Voisinet, B. D., T. Grandin, J. D. Tatum, S. F. O’Connor, and J. J. Struthers. 1997. Feedlot cattle with calm temperaments have higher average daily gains than cattle with excitable temperaments. J. Anim. Sci. 75:892–896.