Data Recording and Usage Interaction Analysis in Asynchronous Discussions: The D.I.A.S. System Tharrenos BRATITSIS & Angelique DIMITRACOPOULOU LTEE Laboratory ,University of the Aegean, Democratias 1 str, 85100 Rhodes, Greece
[email protected];
[email protected]; www.rhodes.aegean.gr/LTEE Abstract. This paper describes the development and the implementation of a new Asynchronous Discussion Forum Software, called DIAS. While evaluating several corresponding software, we came to the conclusion that they seem to be inadequate to support the use of this activity (asynchronous discussion) as a substantial part of the learning process. Most actual forums, that incorporate interaction analysis functions, support mainly administrators, or teachers, while offer only basic awareness functions to the learners. The DIAS system is mainly developed in order to offer extended interaction analysis support, by providing a wide range of indicators jointly used in various learning situations, to all discussion forae users (individual students, groups, teachers or even researchers), appropriate for their various roles in different learning activities. An additional goal is to provide a customizable, flexible and interoperable environment. The present paper briefly describes the reasons that enforced the need to construct this new tool, examining the aspect of CMC (Computer Mediated Communication) assessment. The description of the system’s architecture and functionality follows. The implemented technique of recording, storing and analyzing forum data is pointed out, justifying the choices. Finally the description of the on-going case studies of the systems’ usage in real conditions and the expected results.
1. Introduction: Asynchronous Discussion Forae 1.1 General Overview The past few years we witness an increased mobility in research concerning tools for analysing and supporting learning activities (by distance in particular). Several theories and techniques have evolved, using elements deriving from the CSCL and the CSCW domain. Recent developments in learning theory have emphasised the importance of context and social interaction. In this vein, the notion of a learning community is gaining momentum. In the present paper, our center of interest is Asynchronous Discussion Forae. It is a substantial component of every Learning Community, as it provides means of communication and implicitly learning process management. CMC can be defined as the exchange of messages among a group of participants by means of networked computers, for the purpose of discussing a topic of mutual interest [9],[2]. Such exchanges of messages can be carried out either synchronously or asynchronously. According to Groeling [8], facilitating asynchronous discussion has the potential to improve the teaching and learning experiences in traditional classroom formats, as well as in distance learning [2]. Asynchronous online discussion allows records of a participant’s written messages to be kept in the virtual electronic ‘space’ for long periods of time [7]. Participants in such a forum need not be online at the same time [20]. They can respond to the messages posted at any time they prefer and view them many times and long after they have been posted. In this way, asynchronous online discussion can resemble written communication [7],[2]. Considerable amount of work has been done concerning interaction and argumentation analysis in discussion forae. Nevertheless most of the solutions are carried
out by researchers off line and usually in scheduled time intervals analysis [6]. Indicators of quantitative as well as qualitative analysis have been introduced. Stepping backwards and examining large Distance Learning Systems, we will find out that the forum module contains little information available for the users. For example in WebCT [23] (one of the most complete systems available), the information available for forum usage is limited to: Session Information (number of sessions, session length and mean session time), Activity Information (number of messages posted and read) and a few statistical indicators (most and least busy day, etc). Other, forum specific software like WebWiz [22] and PhpBB [19] provide additional information, like: Online users, number of messages per day, number of unread messages, etc. We consider all of this minimal information, which supports forum usage only as a subsidiary tool for the Learning System. Furthermore, we can find qualitative analysis methods which are applied after the discussion termination or at scheduled time intervals. These methods are consisted of message content analysis, usually off line and take into account parameters like syntax, subject and content appropriateness (staying on topic), argumentation analysis (for example IRF and IDRF approach) [13]. Finally, more advanced interactions analysis methods have been developed and applied only by researchers to a few systems that partially involve forum, and are context specific in a more global learning environment [e.g. DEGREE system] [1]. 1.2 In Need of a New System Literature points out the difficulties of students participating in Forums: lack of active participation, poor quality of argumentation, behaviors that do not contribute to a collaborative activity, etc. The ‘presented’ reasons are often just the lack of confidence, the poor quality of their texts, the anxiety, etc. [17],[18]. We consider that serious supplementary reasons may be that: (a) students ignore how to proceed (the didactical contract is not established, the deontology is not assumed, the expected behavior is not known), (b) they suffer from an overflow of low level information, (c) they cannot create an ‘image’ of their own action/activity in comparison of those of others participants, (d) moreover, they cannot create an image of the whole activity as a group. Our approach aims to offer direct assistance to students participating to a discussion forum, that could support them in the level of awareness of their actions or behaviors as well as those of their ‘collaborators’, in order to activate their metacognitive processes, thus allowing them to auto-regulate their own activities. In parallel, we aim to support the persons that monitor forum discussions (eg. teachers) in order to ‘identify’, the difficulties during learning situations, and regulate them via appropriate interventions. Given the above considerations, and taking into account the fact that the actual forum systems offer a limited interactions analysis support or that they are context specific, we were led to the decision of designing and developing a new Asynchronous Discussion Forum System called DIAS (Discussion Interaction Analysis System). In order to design DIAS, three central design principles were specified, concerning its interaction analysis component: [a] Take into account the totality of the users that are involved in a ‘learning activity’, as well as their cognitive systems that may form [5], students as individuals (in various roles), but also as members of one or more groups or even communities, teachers in different roles according the category of learning activity, etc. [b] Provide a rich range of interaction analysis indicators: The analysis of interactions, in terms of indicators, seems to be an appropriate framework that offers different points of view of the learning activity process, its quality, as well as its product. Different indicators may be more appropriate during different time periods of the learning, for different learning task, as well as for different profiles of forum participants [4]. [c] Create a flexible, customizable, and interoperable system: Forums are tools that can be used in a number of contexts, and for a variety of discussion based learning activities categories. Furthermore, forum participants take various roles and they have different needs according to their discussions subjects, the available time, etc. Thus, it is significant to create customizable, flexible and interoperable systems. As aforementioned, minimal information is provided in order to support discussion forae as environments that promote learning [16],[12],[14],[2]. As Henri [10] mentioned, there are five (5) complementary dimensions on which we can evaluate CMC:
•
participative: at a minimum, is it used? This can degenerate to the counting of numbers and lengths of messages. It is easy to measure (at least in CMC, it is harder face-to-face), but says nothing about the quality of what is going on. • social: this is clearly important, since the social dimension provides some of the motivation for people to make use of the system. It describes the ability of learners to project themselves socially and affectively into a community[21]. However, this dimension says nothing about the quality of learning taking place. • interactive: it is possible to measure the interactions, responses and commentaries taking place, seeing in detail how particular events or statements lead to particular responses. Such analyses, by whatever techniques can give useful insights into how to improve conversations (through facilitation, for example), but do not tell us much about the type of learning that has gone on. • cognitive: people use skills connected to reasoning which uses critical thought. It is this dimension which is of big interest to educators, considering as common goal to encourage critical thinking,. • metacognitive: reasoning about reasoning and self-awareness. Our aim is to find ways of providing measurable elements of an Asynchronous Discussion Forum, in order to produce the means of evaluating this kind of CMC as a cornerstone of Distance Learning processes[11]. 2. The D.I.A.S. System 2.1 Technical Overview Our main goal was to develop an independent forum tool, which would be flexible and easily customizable as well as interoperable. This lead us to the selection of web based open source technology, making it easy to share with the academic community. The system is developed using asp code and java applets, making it easy to alter at will its functionality (customizability, flexibility). The use of a Data Base Management System was decided, in order to achieve more efficient Data manipulation (storage, access, retrieval). One of our goals in the near future is to build data input filters, in order to use our system with discussion data derived from any other Forum Software (interoperability). Another aspect of its interoperability and independence is that it can be used integrated in an Distance Learning system as an add-on, being purely Web Based. 2.1.1 System Architecture The system architecture is shown in Figure 1.
Figure 1: D.I.A.S. System Architecture
The D.I.A.S. system is consisted of two major components. The Data Base Management System is used for storing the data recorded throughout the forum usage. The Web User Interface, which is developed on ASP and Java Technologies, is constituted of three basic modules. The Forae Management Module allows the users to insert data into the forum system through message posting (including a number of formatting methods) and to access the data already stored. The User Rights Management Module which is responsible for controlling the data a user can insert, alter and view. The Indicator Request & Construction Module extracts data from the DBMS using queries (DB Query Module) according to user needs (Indicator Request), in order to analyze it (Indicator Calculation Module) and feed the Visualization Module which is responsible for presenting the query results in a tangible manner (Indicators’ Views). 2.1.2 System Functionality The D.I.A.S. System is a fully supported Asynchronous Discussion Forum with Interaction Analysis and Awareness Tools. The core of the system is the underlying DBMS, used for storing and managing the recorded data. Users can write messages using a WYSIWIS editor which embodies many formatting functionalities. They are exhorted to choose the type which corresponds to their message content, facilitating guided conversations. The message types are in the teacher’s discretion. By altering a few simple parameters, we can omit this functionality, thus implementing free discussion. There are three levels of classification; Thematic categories, which may contain many forae. Each forum may contain many discussion threads. Users can be assigned different access rights to forae, varying from “no-access” to “full permission”, depending on group membership. Furthermore the teacher is given the ability to choose the message types allowed to be used in every forum, at any time. The capability of creating printer friendly, flat format of the forae also exists, giving the opportunity to the users to study the content and the evolution of the discussion at a glimpse. 2.2 Data Capture and Recording We have analyzed many of the existing Forum Software in order to determine the best way of recording and storing usage data. We concluded that the most efficient way is the use of a RDBMS as it provides a plethora of ways to retrieve query-based data, leaving raw data intact. Furthermore it provides good integration with internet browsing software and consequently, convenience in choosing open source, ASP and Java components while building our system. The actual database schema is shown in the Figure 2.
Figure 2: Database Schema
The set of raw data we find compulsory for detailed and sufficient forum usage analysis contains: - User data (User-id, Name, Surname, e-mail address) - Post data (Subject, Message Content, Post Type, Author, Date written, Reading access by users) Also another set of data is necessary for better forum utilization and further usage analysis is constituted of: - Forum structure (Forum categorization, Forum name and description, thread separation, appearance order) - User rights management (Forum access rights, User grouping, Post type permission per forum) - Indicator and information access rights manipulation - Session information (logon hours, page visitation) 2.3 Data Analysis We access the raw data by applying the appropriate set of queries to the DBMS. Calculation of the retrieved information subsequently occurs, passing results to the visualization system. Partial set of the data is used for providing awareness information to the users, such as: - Participation. Information about active participation (message writing) and passive participation (message reading) - Relative participation. Information about the user’s participation ratio, regarding specified time tables and group activity. - Discussion evolvement. Information about the progress of the discussion regarding to time. Another portion of the data is used to produce interaction analysis indicators. Some reveal user activity, evincing active and passive users, ones who need encouragement or coaching, etc. Others relate to discussion and interaction assessment. Some of the data recorded is not yet used in computations (message length for example). It can be accessed for further, qualitative analysis of the discussion. Fifty two (52) indicators, divided in three sets are currently produced; Individual, Group and General Indicators. In Table 1, we can see a categorization, including a description of the basic functions used to produce them as well as the information type they embody. Information Type
FUNCTION
AP NP = F(t,f) AP NPT = F(t,f) AP NP = F(t,T,f) AP,AR,IP,IS,IC AB = F(u,T,f) AP,AR,IC AT = F(u,T,f) AR,IM,IS R = F(u,f) AE,IM Thread Depths, Thread weight AR,IM, IS Classification Indicator = F(R, NP) AR,AE,IS,IM Relative Activity Indicator = F(NP,T,S,t) AR,AE,IP,IM,IS Activity Indicator = F(NP,R,T) AP,AR,AE,I Contribution Indicator = F(NP,S,T) IC,II,IM Group Interactivity Indicator = F(AB, AT,u) AP,AR,AE,II, Answered Contributions = F(u,f, AB) AE,I Contributions Answered by Others = F(u,f, AT) AE,IC,IM Follow-Up Contributions = F(u,f, AT, AB) AP,AR Average(NP) = F(u,f) IS,IC,IM SNA → DL Full Matrix, Agna Matrix Information Type AP → Awareness (Participation) AR → Awareness (Relative) AE → Awareness (Evolvement) IP → Interaction (Participative) IS → Interaction (Social) IC → Interaction (Cognitive) IM → Interaction (MetaCognitive) II → Interaction (Interactive)
Number of Indicators Individual Group General 3 2 --2 2 --3 3 --2 2 --1 1 --1 1 --1 1 2 1 1 --1 1 --1 1 --1 1 ----2 2 ----2 ----2 ----2 1 2 2 ----2 Function Variables t = Time Intervals NP = Number of Posts NPT = Number of Type T Posts T = Post Types AB = Answers By User AT = Answers To User by others f = Forum R = Post Reads S = Thread Initiating Posts u = Users
Table 1: Indicator Functions and Classification
We have implemented a wide range of visualized information and decided to provide different sets for the teacher – researcher and the students. The main idea is to give the teacher the opportunity to choose the appropriate set of indicators for the students, depending on the learning scenario and its evolution (set variation as the scenario evolves). This would give us the opportunity to evaluate the appropriateness and utility of the various tools, regarding their acceptability by the users and their participation in usage support and enforcement. Almost all the indicators are displayed in graphical format, using Bar Graphs, Polar Diagrams, XY Charts, Pie Charts and Scatter Charts. For the SNA diagrams production, text files in well known format are produced (Ucinet DL format and Agna Format) [11]. Some of the information available, mainly awareness related, is displayed in text format. Everything is produced on the fly, except the SNA diagrams, which have to be passed on to another software (NetDraw or Agna).
From
To
Degree of Interaction
User
Number of Messages
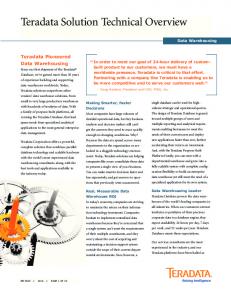
Figure 3: Screenshots
Four of the produced indicators are shown in Figure 3. These are: - User Classification Indicator: It is a XY scattered chart with the X-Axis representing the amount of contribution and the Y-Axis representing the amount of Interaction by the users. The two Axis are scaled from Low to High. The X-coordinate is calculated by the contributions (messages written) of the user as a percentage of the total contributions, thus placing the lowest number at the left end of the Axis (Low) and the highest number at the right end (High). The Y coordinate is calculated as the percentage of the available messages read by a user (excluding the ones written by
himself). A quick look on the chart reveals the kind of system use (balanced, mostly reading others’ messages, mostly writing messages, etc) - Relative Activity Indicator: A bar chart is created, showing the activity of the users for the selected time duration as a percentage of the total activity. Initiation of discussions and use of different types of messages is subsidized. The mean value of the contribution percentage for the selected time is also displayed, thus evincing the most active users. This is an indicator useful for the students as well, by providing information concerning their classification within the group activity. - Contribution Indicator: A polar chart contains bullets representing the various users. The distance from the circumference of the circle is proportional to the contribution status of the user, subsidizing the initiation of discussions. The size of the bullet is proportional to the number of message types used. - Activity Indicator: A XY scattered chart shows the amount of contributions (X-Axis), the amount of message types used (bullet size) and the mount of other users’ messages read (Y-Axis). Some of the indicators produced present the same kind of information using a different visualization approach. This is deliberately implemented for the investigation of the optimum method of data presentation. 3. System Testing & Evaluation Actually, DIAS system was designed and developed, offering and supporting a wide range of possibilities, in order to allow us, in a first level to: (a) Study the appropriateness of each indicator separately as well as indicators sets for specific interaction analysis functions users (b) Identify the appropriateness of those indicators, regarding forum-based learning activities categories as well as context of uses. and then, in a second level, to be able to propose to researchers and teachers (for their own work, but also for students support), specific interactions’ analysis indicators’ sets, for specific usages cases. Currently the system is being tested in real settings, at the University of the Aegean. Three different case studies take place, involving the students of one undergraduate and two post-graduate programs. In the first case, 50 undergraduate students participate, and the Forum is mostly intended to support weekly discussions that enforce the work done during the traditional seminar-based course. In the second case, 40 post graduate students participate, while attending two courses for six weeks. It is a distance learning program that involve students in face to face seminars for only three times per semester (in the beginning, in the middle, at the end). During these two courses a variation of discussion activities and project management activities (for final assignment preparation) will be implemented. In the third case, 15 post graduate students participate, while attending a course involving present seminars, every week. During this test period, the teachers will be able to use most of the available indicators, in various combinations. The system administrator will assure that every day the corresponding SNA diagrams and the flat formats of each forum will be produced. It is expected that a limited set of indicators will be available to the students, varying as time goes by. Our main goal is to assess the indicators’ usage, considering students and teachers as users of interaction analysis component of DIAS system. More concretely, we will investigate the following: (a) The correctness of the indicators produced is a main issue of consideration during this first testing period with real users. (b) We intend to point out which indicators’ set better present the group activity. (c) Regarding the students, the appropriateness of each indicator as well as of indicators’ set is the main issue of consideration. Furthermore, we want to detect the effect of the information provided by the indicators in their self regulative actions. . (d) A classification of user working mode and status is another objective in order to nominate the corresponding appropriate indicators sets to each case. (e) Finally, the possibility of creating additional indicators (more qualitative) is substantial during the analysis and evaluation of the project. Future Plans include Data Input Filters, allowing to import data from other Forum Software in our DIAS interaction analysis system, in order to test the interoperability of the
systems, as well as to evaluate the production of the indicators and the appropriateness of awareness and metacognitive support in a wider usages’ spectrum. 4. Acknowledgments The present work is based on previous research projects of LTEE lab, while it is actually inspired and enriched by the discussions and the work carried out in the frame of the ICALTS and Interactions_Analysis JEIRPS, of the Kaleidocsope NoE, IST-507838, [www.noe-kaleidoscope.org]
5. References [1]
[2] [3] [4] [5]
[6] [7] [8] [9] [10] [11] [12]
[13]
[14] [15] [16] [17] [18] [19] [20] [21] [22] [23]
Barros, B., Verdejo M.F., Read, T., Mizoguchi, R., (2002), Applications of a collaborative learning ontology, MICAI'2002 Advances in Artificial Intelligence. In C. A. Coello, A. de Albornoz, L. E. Sucar, O. C. Battistutti, (Eds.), Lecture Notes in Computer Science 2313, Springer-Verlag pp. 301-310 Corich S., Kinshuk, Hunt L. (2004): Assessing Discussion Forum Participation: In Search of Quality. International Journal of Instructional Technology and Distance Learning. TEIR Center, Duquesne University, Pittsburgh Cramphorn C. (2004): An Evaluation of Formal and Underlying Factors Influencing Student Participation within E-Learning Web Discussion Forums. Networked Learning Conference. Dimitracopoulou A. (2005). Vers des outils d’Analyse des Interactions pour l’Assistance Metacognitive des Participants aux Forums de Discussion. Symfonic Symposium :“Forum et communautés d’enseignants et d’apprentissage,Amiens, France, Jan. 2005. Dimitracopoulou, A. Dillenbourg, P. Hoppe, U. (2004). Interaction analysis supporting participants during technology –based collaborative activities: Workshop summary, In CSCL SIG Symposium, Lausanne, 7-9 October, 2004. http://cscl-sig.intermedia.uib.no/ lausannesymposium/, last visited 4/2005 Dringus L., Ellis T. (2004). Using data mining as a strategy for assessing asynchronous discussion forums. In Computers & Education. (2004). Ganeva, I. (1999). Native and non-native speakers’ participation in educational asynchronous computer conferencing: a case study. Unpublished Master thesis. Ontario Institute for Studies in Education, University of Toronto. Groeling, T. (1999). Virtual Discussion: Web-based Discussion Forums in Political Science. Paper presented at the American Political Science Association, 1999, Atlanta, Georgia. Gunawardena, C., Lowe, C. & Anderson, T. (1997). Analysis of a global online debate and the development of an interaction analysis model for examining social construction of knowledge in computer conferencing. Educational Computing Research, 17(4), 397-431. Henri, F. (1991): Computer conferencing and content analysis. In O'Malley, C. (ed.) Computer Supported Collaborative Learning: Heidelberg: Springer-Verlag. Hew K., Cheung W. (2003): Models to evaluate online learning communities of asynchronous discussion forums. Australian Journal of Educational Technology 2003, 19(2), 241-259. Kirkley, S. E., Savery, J.R. & Grabner-Hagen, M. M. (1998). Electronic teaching: Extending classroom dialogue and assistance through e-mail communication. In C. J. Bonk & K. S. King (Eds.), Electronic Collaborators: Learner-Centered Technologies for Literacy, Apprenticeship, and Discourse (pp. 209-232). Mahwah, NJ: LEA, Publishers Lucas, N. (2004): Les procédés d'exposition et de developpement collectif dans un forum pédagogique : le cas Maxime, Paper presented at Symfonic Symposium : “Forum et communautes d’enseignants et d’apprentissage, http://www.dep.u-picardie.fr/sidir/articles/, last visited, 4/2005, Amiens, France, Jan.2005, Mason, R. (1991): Methodologies for evaluating applications of computer conferencing in Kaye, A.R.(ed) Collaborative Learning through Computer Conferencing: Heidelberg: Springer-Verlag. Analytic Technologies. Social Network Analysis. http://www.analytictech.com/ Newman D., Webb B., Cochrane C. (1994): A content analysis method to measure critical thinking in face-to-face and computer supported group learning. Queen’s University Belfast, Information Management Dept. Nonnecke, B. & Preece, J. (2001). Why Lurkers Lurk. Paper presented at the AMCIS Conference, Boston. Rourke L., Anderson T., Garisson D.R., Archer W. (2001). Assessing social presence in asynchronous text-based computer conferencing In Journal of Distance Education. PhpBB Community Building Software. http://www.phpbb.com/ Romiszowski, A.J. & Mason, R. (1996). Computer-Mediated Communication. In D.H. Jonassen (Ed.). Handbook of Research for Educational Communications and Technology. 438-56. Rourke, L., Anderson, T., Garrison, D. R. & Archer, W. (1999). Assessing social presence in asynchronous text-based computer conferencing. Journal of Distance Education, 14(2). Web Wiz Guide: The Web Development Site. http://www.webwizguide.info/default.asp WebCT Learning System. http://www.webct.com/