PerfView: A Performance Monitoring and Visualization Tool for Intel Itanium Architecture
Technical Report
Department of Computer Science and Engineering University of Minnesota 4-192 EECS Building 200 Union Street SE Minneapolis, MN 55455-0159 USA
TR 04-030 PerfView: A Performance Monitoring and Visualization Tool for Intel Itanium Architecture Ananth Lingamneni, Abhinav Das, and Wei-chung Hsu
July 27, 2004
PerfView: A Performance Monitoring and Visualization Tool for Intel® Itanium® Architecture Ananth Lingamneni, Abhinav Das, Wei-Chung Hsu (lingamne,adas,
[email protected])
Abstract Application performance analysis in modern microprocessors has become extremely complex due to substantial instruction level parallelism, complex processor pipelines and deep memory hierarchies. Performance analysts need to have a thorough understanding of the dynamic behavior of programs in order to identify and fix performance bottlenecks. In order to help in the performance analysis process, modern day processors provide hardware support in the form of performance registers that capture micro-architectural events at program runtime. However, the data provided by these hardware registers is at a very low level and an extensive effort has to be made by performance analysts to make sense of the data. Therefore, it is extremely beneficial to make use of performance analysis tools that can assemble various types of performance related information available from the performance registers to provide a high level summary of the data. In this paper, we discuss PerfView, which is (1) a source-code based visualization tool (2) a tool that identifies and allows users to view performance-critical events based on execution paths and (3) an interactive performance monitoring and debugging tool.
1. Introduction Performance analysis of applications is an important part of software development. It is used by programmers across all levels of software development. The compiler designer, the operating system developer and the application programmer use it to test the efficiency of generated code. As computers have evolved, they overcame many performance limitations found in earlier systems. However, different performance bottlenecks are detected as different architectures are designed. The task of software developers is thus complicated by the need to understand these architectural limitations. In addition to changing architectures there has been a trend to develop hardware that is fast and simple leaving the complicated task of code optimization to software. One can see this trend from the adoption of RISC architectures over CISC and more recently to VLIW type processors over Out-of-Order processors. The central idea of these changes is to have a fast and simple hardware that assumes a higher level of abstraction,
1
which does complicated program analysis to figure out efficient instruction sequences. Modern architectures also provide some features for advanced optimizations that can improve performance significantly. A good example is support for speculative operations. Compilers use these features to, potentially, generate optimized code. Due to various limitations, the compiler cannot sometimes use these features optimally. PerfView tries to point out performance problems and highlight regions where the compiler failed to generate efficient code. This can enable programmers to understand the limitations of compilers and make simple changes or transformations to assist the compiler to generate efficient code. To satisfy the need for accurate performance analysis, various tools have been developed for different architectures. Different methodologies can be applied to measure performance of applications, depending on the metrics to be measured. For example, performance analysis generally begins with finding out functions that form a large percentage of total execution time. Instrumentation instructions can be added to the original program, to measure this and other metrics. Instrumentation can change the performance characteristics of the application. It is a software-based approach to performance analysis, but has the disadvantage of being too intrusive. The other end of performance analysis relies squarely on hardware to provide performance related information. The overhead is significantly less using this approach. For older processors, even if such hardware existed, there were many problems such as inaccuracy of information, and the requirement of operating system support to access counters, to name a few. This forced performance analysis tools to rely on software-only approaches. The Itanium Processor family (IPF) [3] provides comprehensive support for performance monitoring, making the connection between the performance of micro-architecture features and the executing binary more accurate. Irrespective of the methodology followed by a tool, it is important for the tool to provide a detailed analysis of all aspects of performance. Software-only tools are lacking in this respect. For example, one can imagine a function that shows up as the hot-function, and the programmer knows that other functions are more important or called more frequently. Clearly, some microarchitectural bottleneck is causing a problem, but what? The programmer doesn’t know if the bottleneck is due to data-cache misses or instruction-cache misses or some other reason. Such details can only be provided by hardware. Thus, tools utilizing hardware information are more useful, as they reduce the amount of “guess-work” the programmer has to do to nail the performance bottleneck. In this report, we present a performance analysis tool called PerfView that attempts to satisfy the requirements of performance analysis for modern architectures. We have implemented PerfView for Itanium processors as this architecture provides performance monitoring hardware,
2
which can be used to present a detailed analysis of program performance. The power of PerfView lies in its analysis and presentation of execution path that leads up to performance bottlenecks. This provides the programmer a better context for performance events.
2. PerfView Architecture
Pfmon SigProf Signal Handler
Collected Samples
Hard Disk
Processed Data
PerfView SigProf Signal on Sampling Buffer Overflow
User Kernel
Perfmon Kernel Subsystem Overflow
64-bit Counter Sampling Buffer Overflow Interrupt
Counter Overflow
PMD
CPU
PMC
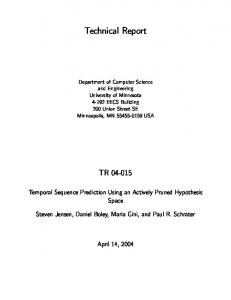
Figure 1: The PerfView Architecture. It illustrates the various systems that are used by PerfView to provide a visual analysis of performance bottlenecks.
PerfView is a user-level application that presents performance characteristics in a graphical user interface. Its architecture consists of the GUI, called PerfView, in the user-address space that uses a command line utility called pfmon [2] as the backend. Pfmon also runs in the user address space, and communicates to the performance hardware using system calls. These system calls are defined in the Linux kernel for Itanium systems. It is called the Perfmon interface. Perfmon is the interface of the hardware built in Itanium processors, which is called the Performance Monitoring Unit (PMU) [4][5]. Figure 1, illustrates the architecture of PerfView. This system has been developed for Itanium-2 processors that are based on the IA-64 architecture. The subsequent discussion will explain each block in greater detail.
3
2.1.
Itanium-2 Performance Monitoring Unit (PMU) The IA-64 architecture specification requires hardware support for performance
monitoring. Itanium-2 supports and extends this specification in its implementation, which is called the Performance Monitoring Unit. The interface to the PMU consists of a set of dedicated registers that can be programmed to count occurrences of certain micro-architecture events such as number of cycles elapsed or the number of cache misses in the L1 cache. The register file is composed of the Performance Monitor Data (PMD) registers which collect the data, and the Performance Monitor Configuration (PMC) registers which are used to configure the events to be monitored. The Itanium-2 PMU provides four 48-bit performance counters that help in counting up to four micro-architectural events simultaneously. It uses four pairs of registers (PMC4-PMC7 and PMD4-PMD7). The configuration registers PMC4-PMC7 are used to configure the events that are to be counted in data registers PMD4-PMD7. The data registers, each, contain a counter that is incremented every time an event specified by the configuration register occurs. When a counter eventually overflows and wraps around to 0, this condition is detected and stored as some bits in PMC registers, as the overflow status. The PMU can be programmed to generate an interrupt whenever a PMD register overflows. This interrupt facility can be used by the operating system to maintain a 64-bit software counter for every hardware counter. The PMD register that overflowed can be determined by inspecting the overflow status in the PMC. The PMU also provides filters such as OPCODE matchers and Address-Range matchers that provide a finer control over the events being monitored. With the help of these counters and filters, the PMU can be used for cycle accounting i.e. breaking down the number of cycles that are lost due to various kinds of micro-architectural events. By classifying these “stall” cycles, it is possible to identify performance problems and possible solutions. For instance, if there is a large number of stalls due to instruction cache accesses, prefetching the instructions may help in improving performance. Cycle accounting is very helpful in characterizing the overall behavior of applications, but does not help in identifying the specific locations in the program that are responsible for performance related events. In order to address this problem, the Itanium-2 processor provides a set of Event Address Registers (EARs) that can be programmed to capture micro-architectural event information along with the instruction pointer (IP) related to that event. In the absence of Event Address Registers, the IP address captured on the occurrence of an event can be many instructions beyond the instruction that actually triggered the event. When such a “skid” occurs,
4
programmers and performance tools must perform additional analysis to guess the IP location associated with the performance event. The provision of EARs greatly simplifies the use of the reported IP addresses. The EARs can be used for data, instruction and branch events, and can capture information such as the latency of a cache miss or the level of the TLB in which a miss is resolved, in addition to the instruction pointer. The cache miss events can be captured at programmable intervals. For example, we can program the PMU to generate an interrupt for every 500 data cache misses that have a latency of greater than 8 CPU cycles. In addition to the EARs, the PMU provides an 8-entry Branch Trace Buffer (BTB) that can record a history of the branch instructions leading up to a performance event. It is possible to configure the BTB to capture only a specific subset of branches such as taken branches, not taken branches, correctly predicted and incorrectly predicted branches. The BTB can record up to four branches in the buffer, and for each branch, source and target addresses are captured. 2.2.
Kernel support for configurat ion of the PMU The Linux kernel on IA64 [1], includes a subsystem called perfmon to provide access to
the IA-64 PMU. The perfmon interface consists of a single system call, perfmonctl() which supports a set of requests to configure, measure, and collect performance monitoring information by providing read and write access to the PMD and PMC registers. Setting up the PMU for monitoring involves programming the PMC registers with information such as the events to be monitored, the privilege level at which monitoring is to occur and interrupts to be generated on counter overflow. For event-based sampling, at least one counter has to be programmed to generate interrupts at the end of each sampling period. The sampling period defines the distance between two samples as an event count. At the end of each sampling period, the perfmon overflow interrupt handler records the contents of a set of specified PMD registers in a sampling buffer, the size of which can be configured by the monitoring task. When the sampling buffer becomes full, the perfmon overflow handler sends a signal to the monitoring task. The monitoring task can now process the contents of the filled sampling buffer through its signal handler. In order to avoid copying of large amounts of data from the kernel area to the application, perfmon automatically maps the buffer read-only into the user address space of the monitoring task.
5
2.3.
Pfmon - A user level tool for performance data collection To simplify the task of setting up the PMU for monitoring applications, a user level tool
called pfmon can be used. The tasks performed by pfmon for monitoring a single application are as follows: 1. Pfmon takes in parameters such as the events to be monitored, the sampling periods and the file in which the collected data is to be stored, and then uses the perfmon kernel interface to set up the PMU accordingly. This sets up a performance context for the pfmon process which is inherited by any child process, and the performance registers are saved on context switches. 2. Pfmon registers a signal handler to process the contents of the sampling buffer when it receives a signal from the perfmon subsystem. The contents of the sampling buffer are generally stored in a file on secondary storage for further analysis. 3. Pfmon then forks the application to be monitored. The forked process inherits the performance context from pfmon and is monitored as it runs. 4. The overhead of gathering the performance samples is not very high. The table below shows the overhead of collecting samples when using the SPEC CPU2000 integer benchmarks as the workload and measuring at different sampling rates.
Monitored Events ICache ICache + BTB CPU Cycles
1K ~ 4.6% ~ 10% -
5K ~ 0.7 % ~ 2% -
Sampling Period 50K < 0.1% < 0.1% -
100K ~ 1.4%
500K < 0.1%
Table 1: The overhead of sampling, when sampling period is increased from 1K to 500K events. Sampling is performed on two events, Instruction cache misses and CPU cycles. The ICache + BTB is the same as ICache with the added overhead of saving the BTB. Entries with a “-” have sampling intervals that are either too large or too small to be meaningful.
As can be seen from the above table, the overhead when sampling 1 in 50K I-Cache misses is negligible, and this sampling period seemed as successful in identifying the top misses as a higher sampling frequency. 2.4.
PerfView - Performance Data Processing and Visualization The data collected by pfmon consists of all the samples taken during a monitoring
session. In order to understand the performance behavior of the monitored application, it is necessary to extract the relevant information from the collected data, and summarize it to provide
6
a high level view of the data. PerfView has been designed to sort out and group the samples according to IP addresses collected from the Event Address registers, in order to help in identification of the most frequently occurring IP addresses. This enables identification of hot spots in the program with respect to performance bottlenecks. For instance, if the monitoring was based on Instruction cache miss sampling, the IP addresses occurring most often in the Event Address registers correspond to instructions that missed most frequently in the cache. Identification of hot spots in an application is an important step when trying to tune for performance, since 80 percent of the execution time falls in 20 percent of the code. PerfView also associates the collected samples with corresponding entries from the Branch Trace Buffer, enabling the construction of an execution trace leading to the event of interest. Finally, PerfView maps the IP addresses back to the source code using the debugging symbol table information present in the executable. This helps in identifying the code and data structures that are the causes for various bottlenecks, and possible reasons for the bottleneck.
3. Using PerfView PerfView provides a complete GUI environment for performance monitoring. From event configuration, to executing the monitored process and high level analysis of performance bottlenecks are performed in the GUI. The following paragraphs describe each of these steps in greater detail. 3.1.
Event Configuration In order to help the user in setting up a monitoring session, PerfView provides a dialog
box as shown in Figure 2, for setting up values for each of the following parameters: 1. Sampling Event and Period: The sampling event specifies the event to be sampled. The sampling period specifies the number of such events that are allowed to occur between two samples. For example, if we are sampling on CPU_CYCLES (an event in the Itanium PMU that counts the number of clock ticks) with a sampling period of 1000, we will sample the monitored events every 1000 CPU_CYCLES. In other words, after every 1000 clock ticks the closest occurrence of the monitored events will be recorded as a sample. 2. Other events to be captured: This is used to specify the event information that is to be captured by the PMU and stored in the sampling buffer. By default, the PMU only stores information about the event specified as the sampling event. To make the PMU store information about other events, the user selects the required events from the list of options
7
provided by PerfView. Each sample recorded in the sampling buffer consists of the contents of the performance data registers that contain information relevant to the events selected by the user. For instance, if the user has opted to collect information on Data Cache misses and Instruction cache misses, each sampling buffer entry on an Itanium machine will contain the contents of performance registers PMD2 (data memory address that missed in the D-Cache), PMD3 (latency of the D-Cache miss), PMD17 (IP address of instruction causing the D-Cache miss), PMD0 (IP address of instruction causing the I-Cache miss) and PMD1 (latency of ICache miss).
Figure 2: The event configuration dialog box in PerfView. This dialog is used to completely configure PerfView to collect data.
3. Latency of misses to be captured: In the case of capturing cache miss events, it is possible to filter out events which are responsible for latencies that are lower than a selected value. This enables a finer control over the type of cache miss events that are captured. By specifying that all cache misses causing latencies greater than 4 cycles are to be captured, the PMU can be programmed to capture all L1 cache misses. An example of setting values in the event configuration box is shown in Table 2. Option Sampling event Sampling Period Other events to be captured Miss Latency
Value Instruction Cache Miss 5000 Taken Branches >=4
Table 2: If the user wishes to capture branch traces for every 5000 instruction cache misses with latency greater than 4, then the event configuration is, as shown in this table.
8
3.2.
Run Application Once the configuration for the PMU has been performed as specified above, PerfView is
ready to monitor an application. The application, which is to be analyzed, has to be compiled with debug information. The addition of debugging information to the executables has minimal impact on compiler optimizations at O1 and O2. We have not observed significant performance difference in the execution time of the executable. For applications requiring higher optimizations and more complex loop transformations, the need for debugging information constrains the use of PerfView. In the case of the GCC compiler, the –g flag is specified to include debugging information in the object file. PerfView makes use of the debugging symbols to map IP addresses obtained from the PMU to the source code statements. This makes it necessary that the source files be present in the same location that they were at the time of compilation. To start running an application with performance monitoring turned on, the user needs to specify the command used to start the application along with any necessary command line arguments in the text box present at the top right corner of the PerfView application window. This is similar to typing in the command to start the application at the shell prompt. It is necessary that any filenames specified in the command should have a pathname relative to the directory from which the PerfView tool is being run, or the pathname should be absolute. Once the command has been typed, the run button is clicked to start running an instance of the application.
Figure 3: The command line to run the application is typed in this text box and after the events configuration is done the “Run” button can be clicked.
When the run button is clicked, an instance of the pfmon process is started which in turn initiates the application to be analyzed with a performance context attached to it. As the application runs, information about the required events is captured by the PMU. At the end of each sampling period, the contents of the performance registers are copied into the sampling buffer. When the sampling buffer overflows, the signal handler registered by pfmon is used to copy the samples in the buffer to a file. This process continues till the monitored application terminates.
9
Once all the performance samples about the behavior of the application are stored in a file, PerfView analyzes the data. It presents a high level view of the collected performance data by highlighting regions of performance bottlenecks in the source code. 3.3.
Evaluating Performance Information Evaluating performance information is not a simple task. The information obtained from
the monitoring must be evaluated objectively, to correctly identify performance problems. PerfView is designed to make this task simpler. It summarizes the performance information by source code. This makes the job of the programmer or performance analyst simpler by abstracting away lower level details of the architecture and binary. The idea that performance of the same code can be different based on the path taken to reach that code, has been around for some time, and is used in PerfView. The programmer is presented with some of the most frequent execution paths that led to the performance event. In the following paragraphs we will see how PerfView can be used to view this information.
Figure 4: PerfView Main Screen: It displays highlighted source code that corresponds to performance events and optionally a list of most frequent execution paths leading up to that event. Its also shows a list of source code lines that form a majority of the performance problems sorted with the ones that contribute the most to lower performance.
The PerfView interface consists of a single application window with multiple frames. A screenshot of the interface displaying some data from the 176.gcc benchmark from the SPEC2000
10
benchmark suite is shown in Figure 4. The top right frame of the application window displays a single file at a time. The source lines that were responsible for a significant fraction of the monitored events are highlighted. The source lines are augmented with line numbers, and a count of the number of events that occurred at each highlighted line is displayed in the top left frame. The top left frame consists of links to source files for which there is performance information. Clicking on a file name in the left frame causes the file to be displayed in the source file frame on the right. In addition to filenames, there is also a listing of line numbers and the event counts associated with each of these line numbers. Clicking on a line number displays the corresponding line of the file to which the line number belongs, in the source file frame. The bottom frame displays any errors that may have occurred during the running of the application, and any output that is generated by pfmon. It is also used to show supplemental information about selected performance events.
Figure 5: PerfView: Branch Trace Buffer source code view: It shows the path of execution followed up to the performance event. By correlating this with the complete source code, it is easy to recreate the execution path leading up to the performance event.
This output so far points to source code that incurs the most significant performance bottlenecks (in this case instruction cache misses). In some cases, this information would have been enough to reason about the causes of these bottlenecks. There are many times when this information is path-based (i.e. dependent on context). PerfView analyzes the Branch Trace Buffer (BTB) to decode the performance context leading to the bottleneck. Right-clicking on a
11
highlighted performance event changes the bottom frame to display the branch trace information in assembly and its mapping to source code format. This can be seen in Figure 4 for the top instruction cache miss. Clicking on SourceView brings up another window shown in Figure 5. The performance event is at the bottom of the screen and moving up we find each block of straight line code, leading to this event, in a separate scrollable frame. Due to optimizations and ambiguity in mapping binary code to source lines, it can be difficult to interpret the flow of control in source code. The assembly code can be helpful to understand the flow of control. Clicking on AssemblyView in the bottom frame of the main window brings up the assembly code in blocks.
Figure 6: PerfView: The Branch Trace Buffer Assembly code view: The same execution trace that leads to the performance event in assembly. It allows for better understanding of control flow when the source code view does not present a clear picture of execution path.
Figure 6 shows the blocks of straight line code leading to the performance event. In this figure, the third block (from top) of straight line code shows in red the source-code line numbers that correspond to the listed assembly code. We can see that parts of source line 7293 and 7310 are placed adjacently in assembly although they are parts of different code blocks. This makes it difficult, sometimes, to map straight line code in binary to source code. So, the assembly view gives the programmer the exact code that was executed. The source code view is an approximation of actual code that was executed. The analysis of the branch trace information can also be supplemented by the assembly code that caused performance bottleneck. This can be
12
obtained by left-clicking on the highlighted source-code line in the main window. A new window is opened with the disassembled instruction list. The region of performance bottleneck is highlighted as shown in Figure 7.
Figure 7: PerfView: Assembly code view: The portion of code that corresponds to performance bottlenecks is highlighted in red.
The main window shows a menu called “View”. This menu can be used to select between different views in PerfView. Three views are currently built into PerfView. These are (1) Data cache misses (2) Instruction cache misses and (3) Hot code. A view will show data only if information needed for that view has been collected. For example to view information about data cache misses, either the sampling event or the other events must have data-cache as one of the selected events. The hot code view requires sampling on CPU-cycles.
4. Comparison with VTune™ VTune [6] is a performance analysis tool developed by Intel® for its range of processors. VTune supports a host of features for performance analysis including time and event based sampling, call-graph profiling and monitoring performance counters to name a few. In this section, we highlight the importance of analyzing the taken-path leading to a performance event in PerfView, and compare it to the capabilities in VTune. The micro-benchmark reads values from an array of integers. The index into the array is chosen either an element from a new cache line or the 0th element. A percentage can be given to this choice. If we chose to go down each
13
path an equal number of times, it is obvious that data cache misses will occur only in the first path, where we access an element from a new cache line. The code structure is shown in Figure 8.
1 2 3 4 5 6 7 8 9 10 11 12
while(.....) { if(.....) { // select index such that a data-cache // miss will occur index = ... } else { // select index such that no data-cache // miss occurs index = ... } val = array[index]; }
Figure 8: A section of code from a micro-benchmark that highlights path dependent data-cache misses. Data cache misses occur in line 11 and only occur if the if condition is true.
Data accessed in line 11 is decided on the index that is different on different paths. The choice of path to follow can be set to various percentages. For our experiments, we set it to 50/50 so that each path is equally taken. We ran the micro-benchmark to simulate a level 3 data cache miss. The output of PerfView is shown in Figure 9.
Figure 9: Output of micro-benchmark using PerfView. PerfView, correctly, highlights the only source code line that corresponds to data cache misses and presents a list of frequent execution paths leading to the data cache miss.
14
We can see that the array access misses in the data cache. From this screen, the only thing we can figure out is the fact that the array access causes data cache misses, and nothing else. However, PerfView analyzes the Branch Trace Buffer and clicking on the SourceView or AssemblyView gives us the path leading to the data cache miss. This is important information, as we know that one path does not lead to data cache misses but the other does. The BTB information shows the path to be the one with the data cache misses. The other path does not show up, confirming the fact that data cache misses occur only along the first path although both the paths have the same frequency of occurrence.
Figure 10: Output of the VTune Performance Analysis Tool on the micro-benchmark. The columns on the right hand side indicate the percentage contribution of data cache misses in the column named “DEAR_LAT”. It points to the source line containing the “if” condition, which has no data-cache misses.
When the same data is collected from VTune (shown in Figure 10) we first see a percentage contribution of each source line towards the collected events. The data cache miss events (first column to the right of the source code) shows that the line with the “if” condition has the maximum contribution on data cache misses. This is incorrect as data cache misses are bound
15
to occur in array accesses and not in the variable for the “if” condition. VTune collect instruction pointer information whenever a sample is collected. This occurs by triggering an interrupt every fixed number of performance events (in this case data cache misses with latency greater than 64). The interrupt service routine reads the location of return address to get an approximate location of event triggering instruction. This location is approximate as interrupts are not serviced immediately and some instructions execute during this time. The return address skids past the instruction generating the event causing incorrect interpretation by VTune. PerfView avoids this by exploiting extra information provided by hardware. As discussed earlier, Itanium stores the exact address of the instruction that generates the performance event. Another feature that is missing in VTune is the analysis of Branch Trace Buffer. Even if VTune had pointed to the correct instruction that causes data cache misses, we would not know which path was followed that led to the miss. A programmer may spend time in optimizing a path that does not cause performance bottlenecks and not get performance gains. In this simple microbenchmark it is simple to see which path would cause data cache misses, but in real world programs there can be many paths leading to a performance bottleneck with complicated code structure. Having path information focuses the programmer’s attention at the path leading to the performance bottleneck.
5. Related Work There are a large number of performance analysis tools and it is impossible to elaborate on each. We will discuss some of the popular tools for performance analysis. The GNU profiler, gprof [9], is perhaps the most popular command-line tool used for basic performance analysis. It uses instrumentation to provide, hot-functions, call-graph profiling and basic-block counting. PAPI [10] is a framework for developing performance analysis applications. More specifically, it provides an application programming interface (API) for accessing hardware counters available on many microprocessors. They support a large number of processors such as, Intel Pentium and Itanium families, some processors from MIPS, AMD, Ultrasparc and others too. A variety of tools have been developed using this framework. PapiEx [11], PerfSuite [12] and HPCToolkit are some of the tools implemented using PAPI. We will discuss a little about one of these, the HPCToolkit. HPCToolkit [13] [14] consists of a group of applications that can be combined to perform detailed performance analysis. It includes papirun, which is a tool for profiling binaries by sampling on hardware counters. HPCToolkit also has other applications to analyze program
16
structure, mapping performance information back to source code and visualization of performance information. HPCView is the visualization application. The principal sources of input data for HPCView are hardware performance counter profiles consisting of a histogram of program counter values. HPCView provides statistics such as the number of memory accesses and cache misses at different hierarchies of the source program such as files, procedures, loops and individual source lines. However, HPCView does not provide for analysis at the assembly level and this makes it difficult in cases such as macro expansions to correctly attribute performance metrics. HPCView does not make use of IA-64 specific features such as the Branch Trace Buffer, and hence does not provide for execution traces leading to events. HPCView uses a web browser for its user interface, and pre-computes static html for the entire set of potential displays. The HP Digital Continuous Profiling Infrastructure [15] is a low overhead profiling system for Alpha processors. The low overhead allows continuous profiling of the system, user program, shared libraries and drivers. It continuously stores performance information into a database that can be used to perform further analysis. It comes with a suite of performance analysis tools that range from providing information on where time was spent to control-flow graphs annotated with source code. VTune is a commercial performance analysis tool that can provide source level analysis. It can run on Windows and Linux platforms. It can use hardware performance counters to present a detailed account of program performance. It has many features, such as time and event based sampling, counter monitoring, call-graph profiling and many others. However, as we have illustrated in section 4, it does not always provide accurate information. It also does not use features like the BTB in Itanium to present a better analysis, where applicable.
6. Conclusion and Future Directions Performance analysis is an integral part of system development. This analysis is difficult, intrusive and many times inaccurate in software. Many architects realize this necessity and provide hardware features that can aid performance analysis. However, there are not many tools that use advanced features of the performance monitoring unit. In this paper, we have discussed features of such a visualization tool that uses features in the Itanium PMU. PerfView has proved to be a useful tool for identifying regions of possible bottlenecks, which is the first step that needs to be taken for the tuning of applications. It can give detailed performance information about major performance bottleneck in applications i.e. cache misses. The execution traces provided by
17
PerfView further help in analyzing the reason for these bottlenecks. It aids in easily and accurately targeting performance bottlenecks with minimal intrusion by presenting an easy to use GUI for performance analysis. The only requirement is that programs should be compiled with debugging information. We are working to enhance this tool and in the future we wish to incorporate more advanced features like instruction and data address range matching to narrow performance analysis to particular application areas. Other features like op-code matching, counter monitoring, call-graph profiling and monitoring the entire system will be incorporated into this tool. We also plan to extend usability of this tool by allowing multiplexing of counters to overcome hardware limitations.
References [1]
David Mosberger, Stephane Eranian. “IA-64 Linux Kernel: Design and Implementation”. Published by Prentice Hall PTR, 2002
[2]
HP Labs, Perfmon Project web site. http://www.hpl.hp.com/research/linux/perfmon/.
[3]
Intel
Corp.
“Intel®
Itanium®
2
Processor
Hardware
Developer's
Manual”.
http://developer.intel.com/design/itanium2/manuals/251109.htm, July 2002 [4]
Intel Corp. “Intel® Itanium® 2 Processor Reference Manual for Software Development and Optimization”. http://developer.intel.com/design/itanium2/manuals/251110.htm, May 2004.
[5]
Intel
Corp.
“Intel®
Itanium®
Architecture
Software
Developer's
http://developer.intel.com/design/itanium/manuals/iiasdmanual.htm,
revision
Manual”. 2.1,
Oct
2002. [6]
Intel
Corp.
“Intel®
VTune™
Performance
Analyzer”.
http://www.intel.com/software/products/vtune/vpa/index.htm. [7]
Youngsoo Choi, Allan Knies, Geetha Vedaraman, Jeremiah Williamson. “Design and Experience: Using the Intel Itanium 2 Processor performance monitoring unit to implement feedback optimizations”.
[8]
Sverre Jarp. “A Methodology for using the Itanium 2 Performance Counters for Bottleneck Analysis”
[9]
“The GNU Profiler: gprof manual”. http://www.gnu.org/software/binutils/manual/gprof2.9.1/gprof.html.
18
[10] London, K., Moore, S., Mucci, P., Seymour, K., Luczak, R. “The PAPI Cross-Platform Interface to Hardware Performance Counters”. Department of Defense Users’ Group Conference Proceedings, Biloxi, Mississippi, June 18-21, 2001. [11] “PapiEx - PAPI Execute”, http://icl.cs.utk.edu/~mucci/papiex/ [12] “An
overview
of
the
capabilities
in
the
initial
release
of
PerfSuite”.
http://perfsuite.ncsa.uiuc.edu/.Supercomputing 2003, Phoenix, AZ, Nov 2003. [13] John Mellor-Crummey, Robert Fowler, Gabriel Marin, and Nathan Tallent. “HPCView: A tool for top-down analysis of node performance”. The Journal of Supercomputing, 23, 81101, 2002. [14] John Mellor-Crummey, Robert Fowler, and David Whalley. “Tools for applicationoriented performance tuning”. In Proceedings of the 15th ACM International Conference on Supercomputing, Sorrento, Italy, June 2001. [15] Jennifer M. Anderson , Lance M. Berc , Jeffrey Dean , Sanjay Ghemawat , Monika R. Henzinger , Shun-Tak A. Leung , Richard L. Sites , Mark T. Vandevoorde , Carl A. Waldspurger , William E. Weihl. “Continuous profiling: where have all the cycles gone?” ACM Transactions on Computer Systems (TOCS), v.15 n.4, p.357-390, Nov. 1997.
19