spottail shiner*. Notropis hudsonius steelcolor shiner. Cyprinella whipplei striped shiner*. Luxilus chrysocephalus suckermouth minnow*. Phenacobius mirabilis.
T E C H N I C A L
R E P O R T
THE LONG-TERM ILLINOIS RIVER FISH POPULATION MONITORING PROGRAM Project F-101-R-19
Annual Report to the Illinois Department of Natural Resources
Michael A. McClelland and Greg G. Sass Illinois River Biological Station 704 North Schrader Avenue Havana, IL 62644
Illinois Natural History Survey Division of Ecology and Conservation Sciences Section for Field Stations and Ecosystems Science
INHS Technical Report 2008 (10) Date of issue: March 31, 2008
INHS 1816 S. Oak St. Champaign, IL 61820 http://www.inhs.uiuc.edu
1
DISCLAIMER The findings, conclusions, and views expressed herein are those of the researchers and should not be considered as the official position of the United States Fish and Wildlife Service or the Illinois Department of Natural Resources. ACKNOWLEDGMENT OF SUPPORT The Long-term Illinois River Fish Population Monitoring Program (F-101-R) is supported by the Federal Aid in Sport Fish Restoration Act (P.L. 81-6814, DingellJohnson/Wallop-Breaux).
EXECUTIVE SUMMARY
2
Between 4 September and 1 October 2007, 27 sites on the Illinois River waterway and one site in Reach 26 of the Mississippi River were electrofished to monitor fish communities. A total of 8,768 fishes representing 60 species (plus three hybrids) from 14 families were collected during 26.34 hours of sampling. Collections made in 2007 indicated continued high catches of gizzard shad, emerald shiner, and bluegill throughout most of the Illinois River waterway. Common carp and goldfish, which were once dominant, continue to exhibit relatively low in catch rates throughout the Illinois River waterway, contributing only 2.8% of the total catch and 2.9% of the Illinois River Waterway catch. Southern redbelly dace were collected for the first time during project F-101-R sampling along the waterway in 2007. A single specimen was collected from Henry Island (RM 193.8) in Peoria Reach. Silver carp were again collected during project F-101-R sampling at most lower and middle river sites. Silver carp were the most abundantly collected species throughout the waterway in 2007 with 2,921 fish collected comprising 33.3% of the total catch. Silver carp collections in La Grange and Peoria reaches were the highest observed for this species since it was first recorded in 2002. Silver carp collections in La Grange and Peoria reaches were also the highest catches ever recorded for a single species in both reaches in F101-R sampling. Bighead carp and round goby were collected at new sites in 2007 illustrating further expansion of these invasive species. Bighead carp were collected at Bull’s Island (RM 240.8) in Starved Rock Reach marking the furthest upstream collection of this species in F-101-R sampling. Round goby were collected at two sites, Clark Island (RM 215.3) and Hennepin Island (RM 207.7) in Peoria Reach, marking the furthest downstream collection of this species in F-101-R sampling. The sample from Lambie’s Boat Harbor (RM 170.3, Peoria Reach) yielded the highest collection of total fish (2,293, 26.2% of the total collected from all 28 sites), while the sample from Moore’s Towhead produced the lowest total fish (43, 0.5% of the total collected from all 28 sites). Fish species richness at sites ranged from 27 at Hennepin Island to 10 species at Moore’s Towhead. Fish species richness of the lower, middle, and upper waterway was 32, 49, and 38, respectively. Cyprinid catches continued to remain relatively high in the upper waterway, with emerald shiner being the most abundant, making up 19.6% of the total upper waterway catch. Emerald shiner catch percentages for Dresden, Marseilles, and Starved Rock reaches were 0.9%, 30.6%, and 29.9%, respectively. Important sport fish species such as bluegill, largemouth bass, and channel catfish were collected in all six waterway reaches in 2007. Bluegill catch per unit effort in number of fish collected per hour (CPUEN) ranged from 116.5 in Dresden Reach to 4.36 in La Grange Reach. Largemouth bass CPUEN ranged from 35.0 in Dresden Reach to 0.2 in La Grange reach. Channel catfish CPUEN ranged from 13.1 in La Grange Reach to 3.6 in Marseilles Reach. In terms of pounds of fish collected per hour (CPUE W), the collection from Peoria Reach yielded the highest biomass at 196.4 pounds per hour while the collection from Marseilles Reach yielded the lowest biomass at 32.6 pounds per hour. Silver carp biomass ranked first over all reaches at 24.1 pounds per hour, comprising 23.5% of the total biomass. Silver carp also ranked first in CPUEW for Alton, La Grange, and Peoria reaches. Catch in weight for silver carp in each reach was 15.2 (40.9% of the total), 32.8 (33.8% of the total), and 46.3 (23.6% of the total), respectively. Bighead carp ranked first and comprised 43.1 % of the total catch in weight for Starved Rock reach with two individuals captured. Channel catfish ranked first in Marseilles and comprised 36.8% of the total catch in weight with a CPUEW of 12.0. Common carp ranked first in and comprised 34.0% of the total catch in weight with a CPUEW of 32.1 for Dresden Reach. Sixteen fishes were observed to have externally visible abnormalities in 2007. Abnormalities were found in fishes of all reaches except La Grange.
TABLE OF CONTENTS 3
TITLE AND SIGNATURE PAGE ................................................................................ 1 DISCLAIMER ............................................................................................................. 2 ACKNOWLEDGMENT OF SUPPORT ....................................................................... 2 EXECUTIVE SUMMARY............................................................................................ 3 TABLE OF CONTENTS ............................................................................................. 4 LIST OF TABLES ....................................................................................................... 6 LIST OF FIGURES..................................................................................................... 7 INDEX TO JOB ACCOMPLISHMENTS ..................................................................... 8 ACKNOWLEDGMENTS............................................................................................. 9 INTRODUCTION...................................................................................................... 10 STUDY AREA AND METHODS ............................................................................... 10 DATA ANALYSIS ..................................................................................................... 11 RESULTS AND DISCUSSION ................................................................................. 13 A. CONDITIONS DURING ELECTROFISHING RUNS ................................ 13 B. ELECTROFISHING RESULTS ................................................................ 15 Numbers of Fish Collected.................................................................. 15 Catch Rates in Numbers of Individuals Collected per Hour by Reach.............................................................................. 23 Alton (lower waterway, Illinois River) .................................................. 23 La Grange (middle waterway, Illinois River)........................................ 27 Peoria (middle waterway, Illinois River) .............................................. 27 Starved Rock (upper waterway, Illinois River) .................................... 28 Marseilles (upper waterway, Illinois River).......................................... 29
4
Dresden (upper waterway, Des Plaines River) ................................... 30 Catch Rates in Weights (pounds) Collected per Hour by Reach ........................................................................................ 31 Alton (lower waterway, Illinois River) .................................................. 31 La Grange (middle waterway, Illinois River)........................................ 31 Peoria (middle waterway, Illinois River) .............................................. 35 Starved Rock (upper waterway, Illinois River) .................................... 36 Marseilles (upper waterway, Illinois River).......................................... 37 Dresden (upper waterway, Des Plaines River) ................................... 37 Fish Health Determined by External Visual Inspection ...................................................................................................... 38 CONCLUSIONS ....................................................................................................... 38 LITERATURE CITED ............................................................................................... 43 APPENDIX A46 APPENDIX B48 APPENDIX C ........................................................................................................... 49 APPENDIX D ........................................................................................................... 50
LIST OF TABLES Table 1. Station information and characteristics during sampling in 2007....................................................................................................... 14
5
Table 2. Number of individuals of each fish species collected on the Mississippi River (Brickhouse Slough) and the lower Illinois Waterway (Alton Reach, RM 0-80) in 2007............................................... 18 Table 3. Number of individuals of each fish species collected on La Grange Reach (RM 80-158) of the middle Illinois Waterway (RM 80-231) in 2007 ................................................................................. 19 Table 4. Number of individuals of each fish species collected on Peoria Reach (RM 158-231) of the middle Illinois Waterway (RM 80-231) in 2007 ................................................................................. 20 Table 5. Number of individuals of each fish species collected on Starved Rock, Marseilles, and Dresden Reaches of the upper Illinois Waterway (RM 231-280) in 2007 ................................................... 22 Table 6. Number of individuals of each fish species collected per hour of electrofishing on Reach 26 of the Mississippi River (Brickhouse Slough) and on six reaches of the Illinois Waterway in 2007 ..................................................................................... 24 Table 7. Fish species ranked by relative abundance in number of fish collected per hour of electrofishing for 2007 ............................................. 26 Table 8. Pounds of each fish species collected per hour of electrofishing on Reach 26 of the Mississippi River (Brickhouse Slough) and on six reaches of the Illinois Waterway in 2007 ..................................................................................... 32 Table 9. Fish species ranked by relative abundance in pounds of fish collected per hour of electrofishing for 2007 ............................................. 34
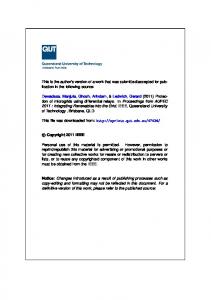
LIST OF FIGURES Figure 1. Three segments of the Illinois Waterway sampled by electrofishing to monitor fish communities in 2007 .................................. 12
6
INDEX TO JOB ACCOMPLISHMENTS Job 1a
Prepare electrofishing equipment and train staff ...................................... 13
Job 2
Sample by electrofishing at 28 sites along the Illinois Waterway and Reach 26 of the Mississippi River .................................... 13
Job 3
Update computer database ...................................................................... 13 7
Job 4
Analyze data ............................................................................................ 11
Job 5
Presentation of results ............................................................................. 15
a
Job numbers and titles refer to the F-101-R-19 annual work plan dated January 2007
ACKNOWLEDGMENTS Project F-101-R is supported by the Federal Aid to Sportfish Restoration Act (P.L. 81-681, Dingell-Johnson/Wallop-Breaux), with funds administered by the U.S. Fish and Wildlife Service and the Illinois Department of Natural Resources (IDNR). Mr. Larry
8
Dunham (IDNR), Dr. David Thomas, former Chief of the Illinois Natural History Survey (INHS), and Dr. Michael Douglas, Director of the Division of Ecology and Conservation Sciences (INHS) provided administrative support. Mrs. Cammy Smith, Ms. Nerissa Michaels and Mr. Matt Stroub of the Illinois River Biological Station at Havana provided clerical, data entry and data verification support. Mr. Thad Cook, Mr. Matt O’ Hara, Ms. Nerissa Michaels, Mr. Maurice Sisson III, Mr. Jared Woodcock, and Mr. Denim Perry assisted with the field work. This survey was originally conceived and initiated in 1957 by the late Dr. William C. Starrett.
INTRODUCTION This report presents a summary of data collected in 2007 during segment 19 of federal aid project F-101-R, The Long-term Illinois River Fish Population Monitoring Program. Previous summaries of the long-term data set, begun in 1957, were given by
9
Sparks and Starrett (1975), Sparks (1977), Sparks and Lerczak (1993), Lerczak and Sparks (1994), Lerczak et al. (1994), Koel and Sparks (1999), and McClelland and Pegg (2004). The annual reports for project F-101-R will continue to build upon previously collected data with major analyses of the long-term data set scheduled at five-year intervals. The next summary is due at the end of segment 20. The format used in this report is patterned after previous annual reports of this project (Lerczak et al. 1993, 1994, 1995, and 1996; Koel et al. 1997 and 1998; Koel and Sparks 1999; Arnold et al. 2000; McClelland and Pegg 2001, 2002, 2003, 2004, 2005; McClelland and Cook 2006; McClelland and Sass 2007) to allow for easy comparisons of data among years. STUDY AREA AND METHODS Twenty-seven sites were sampled for fish at fixed locations along the Illinois Waterway. Twenty-six of the site locations were defined by Sparks and Starrett (1975) and Lerczak et al. (1994). In 1999, a twenty-seventh site was added at Moore’s Towhead in Alton Reach, Illinois River mile 75.3, to more closely monitor fish communities near The Nature Conservancy’s (TNC) floodplain restoration project (Spunky Bottoms Merwin Preserve). Twenty-five of the sites were located on the Illinois River, with two additional sites on the lower Des Plaines River. The Des Plaines River, along with the Illinois River forms part of the Illinois Waterway. One additional site was located on the Mississippi River (Figure 1). Seventeen of the sites were in side channels; the remaining sites were in other habitats, including the main channel border, or in a combination of habitat types (see Lerczak et al., 1994). Following water quality measurements (e.g., dissolved oxygen) at each site, fish 10
populations were sampled by electrofishing from a 16-ft (5-m) aluminum boat using a 3000-watt, three-phase AC generator. Sampling at each site typically lasted one hour. Stunned fish were gathered with a dip net (1/4-in [0.64-cm] mesh) and stored in an oxygenated livewell until sampling was completed. Fish were then identified to species, measured (total length and weight), inspected for externally visible abnormalities, and returned to the water. Additional details on the electrofishing method and equipment were given by Lerczak et al. (1994). DATA ANALYSIS (Job 4) For each site, the number of individual fish and total weight (pounds) were tallied for each species. Fish catch rates were quantified as the number of individuals collected per hour of electrofishing (CPUEN) and as weight in pounds collected per hour of electrofishing (CPUEW). Catch data, both the number of individuals and pounds collected per sample and hour, were summarized and reported by collection site. Data from sites was also grouped into reaches defined by navigation dams (Figure 1) as follows: Alton Reach, river mile (RM) 0-80; La Grange Reach, RM 80-158; Peoria Reach, RM 158-231; Starved Rock Reach, RM 231-247; Marseilles Reach, RM 247271.5; and Dresden Reach, RM 271.5-286 on the Des Plaines River. Data from
11
Des Plaines River Chicago Metropolitan Area
Mississippi River
Dresden RM 271.5
Marseilles RM 247
279.8 277.3
.6 260 9.6 24 48.0 2 1.5 24.8 0 24
Starved Rock RM 231 215.3 207.6 203.3 202.8 193.8 Peoria 180.6 RM 158 170.3 163.3 155.1 148.0 113.0 107.0 95.1 86.5
La Grange RM 80
30.0 26.8 24.7 19.0
River Mile Site Name
Lower River
0.0
Missouri River
Kankakee River
Upper Waterway
Middle River
75.3 58.3
Lake Michigan
St. Louis Metropolitan Area
Mississippi River
279.8 277.3 260.6 249.6 248.0 241.5 240.8 215.3 207.6 203.3 202.8 193.8 180.6 170.3 163.3 155.1 148.0 113.0 107.0 95.1 75.3 86.5 58.3 30.0 26.8 24.7 19.0 0.0
Treats Island Du Page River Waupecan Island Johnson Island Ballards Island Bulls Island Bend Bulls Island Clark Island Hennepin Upper Twin Sister Lower Twin Sister Henry Island Chillicothe Lambie's Boat Harbor Lower Peoria Lake Pekin Turkey Island Upper Bath Chute Lower Bath Chute Sugar Creek Island Moore's Towhead Grape-Bar Islands Big Blue Island Crater-Willow Islands Hurricane Island Dark Chute Mortland Island Brickhouse Slough
Figure 1. Map of the Illinois River waterway illustrating the three segments of the Illinois River Waterway sampled by electrofishing to monitor fish communities in 2007.
12
reaches was also combined into three groups; lower (Alton Reach), middle (La Grange and Peoria reaches), and upper (Starved Rock, Marseilles, and Dresden reaches) Illinois Waterway segments defined by their location along the river (waterway) and by the amount of off-channel habitat accessible to fish per unit length of river (Figure 1; Lerczak et al. 1994). Lerczak et al. (1994, 1995, and 1996) found that river fish communities of the three segments differed substantially enough to give segment designations biological meaning. RESULTS AND DISCUSSION (Job 5) All equipment was tested and repaired as necessary before the fish sampling season began and staff were given a review in safety procedures and electrofishing methods (Job 1). All 28 sites were sampled between 4 September and 1 October 2007 (Job 2); total electrofishing time was 26.34 h (Table 1). Collected data were entered into Microsoft ACCESS 2000 and verified against original field data sheets until no errors were detected (Job 3). The original data sheets from 2007 sampling and all of the other original data sheets of this project (1957-2007) are stored in flame-resistant cabinets at the Illinois River Biological Station at 704 N. Schrader Avenue, Havana (Job 3). A. CONDITIONS DURING ELECTROFISHING RUNS Sampling was conducted in full daylight between 8:25 AM and 5:00 PM central standard time (Table 1). The ranges for physical measurements collected during the 2007 sampling season were as follows: air temperature, 60.8-91.1o F; water
13
14 279.6
Treats Islande
279.9 280.1
277.8 279.9
277.3
248.0 249.8 260.7
10:53
8:25
12:00 13:25 17:00
13:10 11:25
10:40 15:35 12:55 10:26 10:40
9:25 12:00 11:00
10:48 8:40 11:48 9:24 9:13 9:30
15:35 13:30 11:40 9:55 9:55 12:20
10:48
1.00
1.00
1.00 0.50 1.00
1.00 1.00
1.00 1.00 1.00 1.00 1.00
1.00 0.92 1.00
1.00 1.00 1.00 1.00 0.50 1.00
1.00 1.00 1.00 1.00 1.00 0.42
1.00
(h)
Duration
76.9
91.1 89.0 88.1
88.9 86.3
79.0 79.1 79.9 78.6 79.0
60.8 78.8 78.6
71.6 67.1 87.0 79.1 61.9 66.1
70.9 67.9 63.9 61.9 67.0 78.6
77.7
82.0
80.6 80.8 81.5
80.2 79.3
71.1 74.7 74.1 73.4 76.5
68.1 69.8 69.6
74.7 74.8 76.6 76.8 74.3 70.0
76.6 75.7 75.7 75.7 75.6 76.8
73.6
water
Temp (oF) air
e
d
Des Plaines River.
Mississippi River.
68.1 82.6 75.8
276.8
Du Page Rivere
277.4
248.2 249.8 261.1
240.7 241.4
193.9 202.8 203.4 207.9 215.3
163.6 170.4 180.9
86.4 94.8 107.1 113.0 148.2 154.9
18.8 25.0 27.5 30.0 58.5 75.3
205.1
(CST)
End time
Minimum 0.42 60.8 Maximum 1.00 91.1 Mean 0.94 76.2 Total time electrofished 26.34 a Refers to approximate average river mile electrofished at each site, 1957-2007. b Estimated during sampling. c Feet above sea level or river stage (ft) at the U.S. Army Corps of Engineers river gage nearest to the sampling site.
247.7 249.7 260.2
Ballards Island Johnson Island Waupecan Island
248.0 249.7 260.6
241.0 241.6
194.5 203.2 203.5 208.1 215.6
163.6 170.8 181.1
87.0 95.0 107.3 113.2 148.3 155.3
19.5 25.5 27.9 30.8 59.0 75.8
205.3
mean
82.6
6-Sep
7
240.3 241.1
Bulls Island Bulls Island Bend
240.8 241.5
163.5 170.6 180.6
Lower Peoria Lake Lambie's Boat Harbor Chillicothe 193.3 202.4 203.3 207.6 214.9
85.7 94.5 106.9 112.8 148.0 154.5
Grape-Bar Islands Sugar Creek Island Lower Bath Chute Upper Bath Chute Turkey Island Pekin
Henry Island Lower Twin Sister Upper Twin Sister Hennepin Clark Island
18.1 24.5 27.0 29.2 58.0 74.8
Mortland Island Dark Chute Hurricane Island Crater-Willow Island Big Blue Island Moore's Towhead
193.8 202.8 203.3 207.7 215.3
204.9
Brickhouse Sloughd
upper
Sample river mile lower
Name
79.0
6-Sep
6
11 18-Sep 14 19-Sep 13 19-Sep 12 19-Sep 19 25-Sep Starved Rock Reach 2 4-Sep 1 4-Sep Marseilles Reach 3 5-Sep 4 5-Sep 5 5-Sep Dresden Reach
Site Milea Order Date Reach 26, Mississippi River 8 13-Sep 0.0 Alton Reach 23 26-Sep 19.0 22 26-Sep 24.7 21 26-Sep 26.8 20 26-Sep 30.0 24 27-Sep 58.3 25 27-Sep 75.3 La Grange Reach 16 22-Sep 86.5 15 22-Sep 95.1 18 24-Sep 107.1 17 24-Sep 113.0 26 28-Sep 148.0 28 1-Oct 155.1 Peoria Reach 9 14-Sep 163.4 27 28-Sep 170.3 10 17-Sep 180.6
Sampling
6.3 13.8 8.8
7.00
7.40
9.00 8.80 9.17
8.82 8.54
11.06 13.78 13.22 12.39 9.03
9.27 12.97 10.41
6.62 6.47 6.25 6.43 7.45 8.33
7.21 7.10 6.75 6.75 7.12 7.70
10.43
(ppm)
61.11% 128.77% 110.8%
90.22%
93.54%
128.93% 123.87% 128.10%
124.05% 117.47%
142.55% 177.78% 171.81% 159.11% 116.39%
99.46% 166.86% 133.68%
79.51% 74.25% 86.49% 82.95% 80.90% 94.61%
86.00% 82.16% 74.90% 73.30% 81.63% 98.88%
132.82%
(% Sat.)
DO
12.0 81.0 34.9
65.0
81.0
53.0 38.0 32.0 62.0 59.0 59.0
30.0 31.0 27.0 34.0 44.0
13.0 12.0 21.0
20.0 24.0 23.0 22.0 18.0 26.0
35.0 19.0 19.0 28.0 33.0 29.0
19.0
(cm)
Secchi
435 798 737
774
786
712 713 713
708 706
726 754 765 766 798
664 754 745
766 736 737 765 792 798
736 743 750 750 765 772
435
(umhos)
Cond.
220 230 226
225
225
230 230 230
230 230
230 230 225 225 225
225 225 225
225 225 225 225 225 225
220 225 225 225 220 225
225
Volts
0.01 0.51 0.24
0.26
0.04
0.51 0.43 0.40
0.28 0.41
0.32 0.21 0.27 0.21 0.21
0.01 0.02 0.31
0.20 0.25 0.33 0.33 0.25 0.31
0.20 0.21 0.17 0.19 0.20 0.30
0.02
0.5 1 0.9
1.0
1.0
0.5 0.5 1.0
1.0 1.0
1.0 1.0 1.0 0.5 1.0
2.0 0.5 0.5
0.5 1.0 1.0 1.0 1.0 0.5
1.0 0.5 1.0 1.0 1.0 0.5
0.5
(ft/s) min
Vel.
7.0 2.35 2.35 2.35 2.35 2.30 2.30
(ft)
14.69 14.76 14.76 14.76 11.52
12.87 12.01 14.84
6.93 6.93 6.93
3.0 11.0 6.5
6.0 505.40
6.5 505.40
6.0 4.0 6.5
6.5 460.40 6.0 460.40
6.0 7.0 7.0 7.0 6.0
4.0 3.0 7.0
6.0 9.96 6.0 9.96 6.5 6.10 7.0 6.10 7.5 3.26 7.0 431.50
8.0 11.0 8.0 7.5 6.5 5.0
max
Depthb (ft) Stagec
Table 1. Station information and characteristics during sampling in 2007. All stations, except where noted, are on the Illinois River and are listed in downstream-to-upstream order. Site miles are the average river mile and refer to Figure 1.
temperature, 68.1-82.6o F; dissolved oxygen concentration, 6.3-13.8 ppm; secchi disk transparency, 12.0-81.0 cm; conductivity, 435-798 µhos/cm; surface velocity, 0.01-0.51 ft/s; water depth, 0.5-11.0 ft. All physical values were within the ranges expected based upon previous sampling (Lerczak et al. 1994; Koel and Sparks 1999). All sites were sampled within established water temperature and river level criteria (Table 1; Lerczak et al. 1994). B. ELECTROFISHING RESULTS The following data summaries proceed through several levels of detail. First, data on the number of individual fish (by species) collected at each of the 28 sites are presented. Second, catch rates of the number of individuals collected per hour of electrofishing are calculated for each of the seven navigation reaches. Similar summaries are presented for fish weights. Results conclude with fish health as determined by external visual inspection. Fish common names used throughout this report follow Robins et al. (1991). Fish common and scientific names are listed in APPENDIX A. Numbers of Fish Collected We collected a total of 8,768 fishes representing 60 species (plus three hybrids) from 14 families during 26.34h of electrofishing at 27 sites on the Illinois River waterway and a single site on the Mississippi River in 2007. Silver carp were the most abundantly collected species, representing 33.3% of the total catch. Silver carp were followed by bluegill (10.5%), emerald shiner (9.0%), gizzard shad (8.3%), bluntnose minnow (4.1%), and orange spotted sunfish (3.7%). Channel catfish and freshwater drum were
15
collected at all 28 sites; emerald shiner and gizzard shad were collected at 27 sites; bullhead minnow were collected at 26 sites; bluegill and common carp were collected at 25 sites; black crappie, green sunfish, orange spotted sunfish, and white bass were collected at 21 sites. The collection from Lambie’s Boat Harbor (RM 170.3, Peoria Reach) yielded the most fish (2,293, 26.2% of the total collected from all 28 sites), while the collection from Moore’s Towhead (RM 75.3, Alton Reach) yielded the least fish (43, 0.5% of the total collected from all 28 sites). The most fish species collected at one site was 27 obtained at Hennepin Island (RM 207.6) in Peoria Reach. The fewest species collected at a single site was 10 from Moore’s Towhead. Of the 60 fish species and three hybrid crosses, 15 species and two hybrids (bighead carp, bowfin, brown bullhead, common shiner, goldeye, highfin carpsucker, logperch, mud darter, northern hogsucker, redear sunfish, southern redbelly dace, silver redhorse, tadpole madtom, quillback, white perch, common carp x goldfish, and yellow bass x white perch) were collected at only one site. Six fish species (blackstripe topminnow, longear sunfish, river shiner, sauger, threadfin shad, and yellow bullhead) were collected at only two sites. Eight fish species and two hybrids (bowfin, goldeye, highfin carpsucker, mud darter, southern redbelly dace, silver redhorse, tadpole madtom, quillback, common carp x goldfish, and yellow bass x white perch) were represented by single individuals at sites. A maximum of two individuals were collected at sites for each of seven fish species (bighead carp, blackstripe topminnow, brown bullhead, redear sunfish, threadfin shad, white perch, and yellow bullhead). On the 27 Illinois River waterway sites, we collected 8,503 fishes representing 60 species (plus three hybrids) from 14 families during 25.34 h of sampling. At Brickhouse 16
Slough on the Mississippi River (RM 204.9), we collected 265 fishes representing 17 species from six families (Table 2). Total catch from Brickhouse Slough in 2007 was the second highest collection ever recorded in F-101-R sampling at this site. Previous high catches occurred in 2006 when 2,267 fishes were collected (McClelland and Sass 2007). On the lower Illinois River waterway we collected 837 fishes representing 32 species and two hybrids (Table 2). In 2007, fish species richness ranged from 10 at Moore’s Towhead (RM 75.3) to 19 at Crater-Willow Islands (RM 30.0). Our 2007 observation at Crater-Willow Islands matches the highest species richness recorded for this site in F-101-R sampling; a previous high species collection of 18 was recorded in 1999 (Arnold et. al 2000). Crater-Willow Islands also exhibited the highest total catch in the lower waterway with 126 total fishes. We collected 5,881 fishes representing 49 species and two hybrids on the middle Illinois River waterway (Tables 3 and 4). The total catch for the middle river in 2007 was the highest recorded for this region in F-101-R sampling. The six sites on La Grange Reach (RM 80-158) produced 1,773 fishes representing 33 species and two hybrids. Both the total number and total fish species collections for La Grange Reach are the highest ever recorded for this reach in F-101-R sampling. The eight sites on Peoria Reach (RM 158-231) produced 4,103 fishes representing 39 species and one hybrid. The total fish numbers for Peoria Reach also represent the highest recorded for this reach in F-101-R sampling. Fish species richness in the middle river ranged
17
Table 2. Number of individuals of each fish species collected on the Mississippi River (Brickhouse Slough) and the lower Illinois Waterway (Alton Reach, RM 0-80) in 2007. River Mile and Hours Fished Miss. River Species Amiidae bowfin Catostomidae bigmouth buffalo black buffalo golden redhorse river carpsucker shorthead redhorse smallmouth buffalo Centrarchidae black crappie bluegill bluegill x green sunfish green sunfish largemouth bass orange spotted sunfish smallmouth bass warmouth Clupeidae gizzard shad Cyprinidae bullhead minnow common carp common carp x goldfish emerald shiner river shiner silver carp silver chub silverband shiner spotfin shiner spottail shiner Hiodontidae goldeye Ictaluridae channel catfish flathead catfish Lepisosteidae shortnose gar Moronidae white bass Percidae mud darter sauger Sciaenidae freshwater drum Total individuals Total species/hybrids
Lower Illinois River
Mile
0.0
19.0
24.7
26.8
30.0
58.3
75.3
Total
Effort
1.00
1.00
1.00
1.00
1.00
1.00
0.42
5.42
1 1
2
1
2 1
1 1
1 1
4 9
8 13
1 2
1
1 1
1 4 50
5 1 1 3 2 1
4 7 1
2 18
9 1 7 1 1
2 3 1
2 1
146
4
8
10
5
12
9
194
7
9 2
12
15 1
14 2
2
23
34
9 1 1 23
20
33
6
3
2
4
22 2 7 2
6
6
3
3
3
3
68 6 1 161 2 28 2 9 9 1
2 1
22 106 1 11 8 18 3 1
9
1 5
3
3 1 1
4 2
11
10
3 2
4
2
1
6
9
10 1
5 2
1 5
3 11
1
1
38
1
1 1
14 43 10/0
79 837 32/2
1
2 265 17/0
9 103 15/1
18
9 94 16/1
10 99 16/0
42 7
24 126 19/0
11 107 16/0
Table 3. Number of individuals of each fish species collected on La Grange Reach (RM 80-158) of the middle Illinois Waterway (RM 80-231) in 2007. River Mile and Hours Fished
Species Catostomidae bigmouth buffalo black buffalo river carpsucker shorthead redhorse smallmouth buffalo Centrarchidae black crappie bluegill bluegill x green sunfish green sunfish largemouth bass orange spotted sunfish white crappie Clupeidae gizzard shad skipjack herring threadfin shad Cyprinidae bluntnose minnow bullhead minnow common carp emerald shiner grass carp red shiner river shiner silver carp silver chub silverband shiner Ictaluridae channel catfish flathead catfish Lepisosteidae shortnose gar Moronidae white bass white perch yellow bass yellow bass x white perch Percidae sauger Poeciliidae western mosquitofish Sciaenidae freshwater drum Total Individuals Total species/hybrids
Mile Effort
86.5 1.00
95.1 1.00
107.1 1.00
113 1.00
148 0.50
1
2 2
1 1
1 3
2
3
1 6
1 5 1 3
3
2 1 4 1 10
1 4
La Grange Reach 155.1 Total 1.00 5.50
Middle River Total 13.04
3 3 4 5 25
68 3 13 6 158
6 24 1 9 1 71 1
27 502 7 205 72 300 3
153 1 2
401 7 2
1 26 55 82 4 18 1 1040 1 1
1 180 185 228 8 21 1 2893 3 1
1 3 12
2
2
1 1
3
13
35
20 1
64
29
42
7 1
7 3 38 4 9
4 17 18
3 6 9
1 2 3 16
3
1
5
15
25
523
473
8 3
14
19 1
2
9
1
1
7 3 1
3 23
1 3 1
1
6
18
72 4
133 9
1
1
1
40 2 3 1
54 2 7 1
93 2 7 1
3
3
3
48
52
43 1773 33/2
171 5881 49/2
1 7
2
2
1
1
2
45
2 161 16/0
7 144 17/0
9 701 15/1
19
2
7
1
3
8 581 22/0
3 50 18/0
14 136 16/1
Table 4. Number of individuals of each fish species collected on Peoria Reach (RM 158-231) of the middle Illinois Waterway (RM 80-231) in 2007. River Mile and Hours Fished Peoria Reach Mile 163.3 170.3 180.6 193.8 202.8 203.3 207.6 215.3 Total Species Effort 1.00 0.92 1.00 1.00 1.00 1.00 1.00 1.00 7.92 Catostomidae bigmouth buffalo 3 8 9 31 4 10 65 golden redhorse 1 1 3 5 northern hogsucker river carpsucker shorthead redhorse smallmouth buffalo Centrarchidae black crappie bluegill bluegill x green sunfish green sunfish largemouth bass orange spotted sunfish pumpkinseed redear sunfish rock bass smallmouth bass warmouth white crappie Clupeidae gizzard shad skipjack herring Cyprinidae bullhead minnow common carp emerald shiner golden shiner goldfish grass carp red shiner silver carp silver chub southern redbelly dace spotfin shiner spottail shiner Gobiidae round goby Ictaluridae brown bullhead channel catfish flathead catfish yellow bullhead Moronidae white bass Percidae logperch Poeciliidae western mosquitofish Sciaenidae freshwater drum Total individuals Total species/hybrids
5 3
1 100 1 53 7 21 1
3
1 146 4 57 39 14 1
1
1
5 13 6 158
1
21 478 6 196 71 229 9 2 1 12 2 2
27 502 7 205 72 300 9 2 1 12 2 3
9
13
58
11
3 44
1 35
13
10 36
1 23
15 2 70 2
1 2 14
4 2 1
1 10 2
4 81 1 45 9 53 5 2
1 1
1
9
1
20 54
1
1
68 5
5 9 1 133
1 1 28
14
1
Middle River Total 13.42
7
165
13
6 1
1 1
4 1
12 1
40 2
248 6
401 7
3 23 2
3 13 10 6 7
22 48 9 1
11 12 43
20 11 14
6 14 2
59 3 41
30 6 25
2
2
154 130 146 7 11 4 3 1853 2 1 23 27
180 185 228 7 11 8 21 2893 3 1 23 27
3
1
1 1813
3 1
4
14
13 254 15/1
2 3
3 2293 18/1
10
2
1 1 1
9
18
6 1
2 1
12 13
10
1
1
2
2
14
5
2 1
5 2 1
10 1
8 1
2 61 5 1
2 133 9 1
12
5
5
5
5
7
39
93
4
4
4
4
4
52
128 4108 39/1
171 5881 49/2
50 331 21/0
8 178 21/0
20
26 140 22/0
12 222 21/0
5 403 27/1
11 287 24/0
from 15 species collected at Lower Bath Chute (RM 107.1, La Grange Reach) and Lower Peoria Lake (RM 163.3, Peoria Reach) to 27 species at Hennepin Island in 2007. Our 2007 observation is the highest fish species richness ever recorded at Hennepin Island in F-101-R sampling. A previous high fish species collection of 26 was recorded in 2005 (McClelland and Cook 2006). Fish species collections at Clark Island (24 species; RM 215.3) and Lower Twin Sisters Island (22 species; RM 202.8) in Peoria Reach and Turkey Island (18 species; RM 148.0) and Upper Bath Chute (22 species; RM 113.0) in La Grange Reach were also the highest ever recorded for these locations in F-101-R sampling. Lambie’s Boat Harbor was the site of the highest total catch on the middle Illinois River waterway with 2,293 fishes. Our collection represents the highest number of fishes ever collected in F-101-R sampling for any collection site throughout the river. The previous high total catch of 1,142 fishes was recorded at Lambie’s Boat Harbor in 2002 (McClelland and Pegg 2003). In addition to the high numbers observed at Lambie’s Boat Harbor, the collections at Upper Twin Sisters Island (222 fishes; RM 203.3, Peoria Reach), Chillicothe Island (331 fishes; RM 180.6, Peoria Reach), Upper Bath Chute (581 fishes), and Lower Bath Chute (701 fishes) each recorded their highest total catches in F-101-R sampling. We collected 2,050 fishes representing 38 species and one hybrid cross (Table 5) on the upper Illinois River waterway in 2007. This is the highest fish species collection for the upper river in F-101-R sampling. In addition, fish species collections were the highest ever recorded for each reach in the upper river. A total of 29 fish species were collected in Starved Rock Reach, 27 fish species in Marseilles Reach,
21
Table 5. Number of individuals of each fish species collected on Starved Rock, Marseilles, and Dresden Reaches of the upper Illinois Waterway (RM 231-280) in 2007. River Mle and Hours Fished
Species Catostomidae black buffalo golden redhorse highfin carpsucker quillback river carpsucker shorthead redhorse silver redhorse smallmouth buffalo Centrarchidae black crappie bluegill bluegill x green sunfish green sunfish largemouth bass longear sunfish orange spotted sunfish pumpkinseed rock bass smallmouth bass Clupeidae gizzard shad Cyprinidae bighead carp bluntnose minnow bullhead minnow central stoneroller common carp emerald shiner golden shiner goldfish silver chub silverband shiner spotfin shiner spottail shiner Fundulidae blackstripe topminnow Gobiidae round goby Ictaluridae channel catfish tadpole madtom yellow bullhead Moronidae white bass yellow bass Sciaenidae freshwater drum
Mile Effort
Starved Rock 240.8 241.5 1.00 1.00
248 1.00
Marseilles 249.6 0.50
1 7
260.6 1.00
5
Dresden 277.4 279.8 1.00 1.00
1
3
1 1 1 12
2
2 1
1 1
1 1
3
18 1 1 9 1
1
4
1 14
1 36
1 5
10
6 8 2
3 14
2
16 6
16 9
6
1
2
42
72
137
38 11
40 2
28
66
4 16
1 101
15 1 4 2 66
5 4 11 12
12 3
10
10
2 134 22
36 8
5 173
1 38
6
1
4
106 19 44 18 1 5
4
1 4 107 5
1 16 1 1 6 15 1 11
2 7 1 3
2 3 1 2
1 127 12 35 52
6.50
4 316 32 105 109 3 9 18 19 29
2 1 3
1
3
Upper Waterway Total
35 1
34 5
63 1
14
1
1
1
1
2
1
3
12
4
2
3
1 3
2
1
2 357 44 4 30 401 11 17 1 4 253 13 2 5
8
6 1 1
2
38 1 1 5 3
1
2
1
2
17
1
1
25
Total individuals
510
196
191
224
183
369
377
2050
Total species/hybrids
21/1
25/0
22/0
14/0
22/0
17/1
20/1
38/1
22
and 24 fish species in Dresden Reach. Fish species richness at a single site ranged from 14 at Johnson Island (RM 249.6, Marseilles Reach) to 25 at Bull’s Island Bend (RM 241.5, Starved Rock Reach). Fish species collections at Bull’s Island (21 fish species; RM 240.8, Starved Rock Reach), Bull’s Island Bend, Ballard’s Island (22 fish species; RM 248.0, Marseilles Reach), Waupecan Island (22 fish species; RM 260.6, Marseilles Reach) and Treat’s Island (20 fish species; RM 279.8, Dresden Reach) were the highest fish species catches observed for these sites in F-101-R sampling. The collection of 510 fishes at Bull’s Island also represented the highest total catch in the upper Illinois River waterway in 2007. The collection from Johnson Island of 224 total fishes was the highest total catch at this site in F-101-R sampling. A previous high total catch of 203 fishes was recorded in 1995 (Lerczak et al. 1996). Catch Rates in Numbers of Individuals Collected per Hour by Reach. In the following data summary, most of the discussion was restricted either to species that each separately accounted for over 10% of the total catch or to species that were of special significance. Alton (lower waterway, Illinois River). The 95% lists (fish species were added to the list until 95% of the total catch in numbers was obtained) for Alton, La Grange, and Peoria reaches remained similar to each other, as in past years, although total catch in numbers per hour (CPUEN) varied among reaches. Sixteen fish species accounted for 95.8% of the total catch in Alton Reach (Tables 6 and 7) and overall CPUEN was 105.54 in 2007. The highest CPUEN for an individual fish species was 25.48 for emerald shiner. Emerald shiner comprised 24.1% of the total fish collected in
23
Table 6. Number of individuals of each fish species collected per hour of electrofishing (CPUEN) on Reach 26 of the Mississippi River (Brickhouse Slough) and on six reaches of the Illinois Waterway in 2007. Reach and Hours Fished Starved Reach 26 Alton La Grange Peoria Rock Marseilles Dresden Species 1.00 5.42 5.50 7.92 2.00 2.50 2.00 Amiidae bowfin 0.18 Catastomidae bigmouth buffalo 0.92 0.55 8.21 black buffalo 0.18 0.55 0.50 golden redhorse 0.18 0.63 3.50 2.00 2.00 highfin carpsucker 0.50 northern hogsucker 0.63 quillback 0.40 river carpsucker 1.00 0.37 0.73 1.14 1.50 1.20 shorthead redhorse 0.37 0.91 0.13 6.00 0.80 0.50 silver redhorse 0.50 smallmouth buffalo 1.00 4.55 16.80 2.00 1.60 1.50 Centrarchidae black crappie 4.00 3.32 1.09 2.65 0.50 0.80 0.50 bluegill 50.00 10.34 4.36 60.38 16.00 20.40 116.50 bluegill x green sunfish 0.18 0.18 0.76 0.50 15.50 green sunfish 9.00 0.37 1.64 24.76 3.50 7.60 39.50 largemouth bass 1.00 1.29 0.18 8.97 8.50 8.80 35.00 longear sunfish 1.50 orange spotted sunfish 7.00 2.03 12.91 28.93 1.60 2.50 pumpkinseed 1.14 1.50 4.00 2.50 redear sunfish 0.25 rock bass 0.13 0.50 0.80 8.00 smallmouth bass 1.00 0.37 1.52 4.50 2.00 7.50 warmouth 1.00 0.25 white crappie 0.18 0.25 Clupeidae gizzard shad 146.00 8.86 27.82 31.33 5.00 5.20 57.00 skipjack herring 0.18 0.76 threadfin shad 0.36 Cyprinidae bighead carp 1.00 bluntnose minnow 0.18 85.00 37.20 47.00 bullhead minnow 7.00 11.26 4.73 19.45 15.00 5.60 central stoneroller 1.60 common carp 1.11 10.00 16.42 3.00 2.80 8.50 common carp x goldfish 0.18 emerald shiner 23.00 25.48 14.91 18.44 105.50 73.20 3.50 golden shiner 0.88 5.50 goldfish 1.39 0.40 8.00 grass carp 0.73 0.51 red shiner 3.27 0.38 river shiner 0.37 0.18 silver carp 3.00 4.62 189.09 234.06 silver chub 0.37 0.18 0.25 0.50 silverband shiner 1.66 0.18 2.00 southern redbelly dace 0.13 spotfin shiner 3.00 1.11 2.91 71.00 44.40 spottail shiner 0.18 3.41 3.00 2.40 0.50
24
Overall CPUEN 26.34 0.04 2.77 0.19 0.84 0.04 0.19 0.04 0.84 0.87 0.04 6.45 2.01 35.08 1.52 12.19 7.18 0.11 12.41 1.03 0.08 0.76 1.67 0.11 0.11 27.79 0.27 0.08 0.08 13.59 11.09 0.15 8.39 0.04 29.99 0.68 1.06 0.30 0.80 0.11 110.90 0.23 0.53 0.04 10.82 1.56
Table 6. (continued) Number of individuals of each fish species collected per hour of electrofishing (CPUEn) on Reach 26 of the Mississippi River (Brickhouse Slough) and on six reaches of the Illinois Waterway in 2007. Reach and Hours Fished Starved Reach 26 Alton La Grange Peoria Rock Marseilles Dresden Species 1.00 5.75 5.16 7.88 2.00 2.50 2.00 Fundulidae blackstripe topminnow 0.50 0.40 Gobiidae round goby 0.25 0.50 1.60 Hiodontidae goldeye 0.18 Ictaluridae brown bullhead 0.25 channel catfish 4.00 7.02 13.09 7.71 7.50 3.60 7.00 flathead catfish 2.00 0.92 0.73 0.63 tadpole madtom 0.50 yellow bullhead 0.13 0.50 Lepisosteidae shortnose gar 0.55 0.18 Moronidae white bass 7.02 9.82 4.93 1.50 0.80 white perch 0.36 yellow bass 1.27 1.50 yellow bass x white perch 0.18 Percidae logperch 0.51 mud darter 0.18 sauger 0.18 0.55 Poeciliidae western mosquitofish 8.73 0.51 Sciaenidae freshwater drum 2.00 14.22 7.82 16.17 1.50 8.00 1.00 Total Number per hour Number of species/hybrids
Overall CPUEN 26.29 0.08 0.27 0.04 0.08 8.09 0.61 0.04 0.08 0.15 5.16 0.08 0.38 0.04 0.15 0.04 0.15 1.97 10.44
265.00
105.54
322.36
518.69
353.00
239.20
373.00
332.88
19/0
30/2
33/2
40/1
29/1
27/0
24/1
60/3
25
Table 7. Fish species ranks by relative abundance (number of fish collected per hour) for 2007 on the 6 reaches of the Illinois Waterway. Species were added to the list in descending order of abundance until 95% of the total catch for that reach was obtained. Percentages are in parentheses. Rankings by Reach Starved Species Catostomidae bigmouth buffalo golden redhorse shorthead redhorse smallmouth buffalo Centrarchidae bluegill bluegill x green sunfish black crappie green sunfish largemouth bass orange spotted sunfish pumpkinseed rock bass smallmouth bass Clupeidae gizzard shad Cyprinidae bluntnose minnow bullhead minnow common carp emerald shiner golden shiner goldfish silverband shiner silver carp spotfin shiner spottail shiner Ictaluridae channel catfish flathead catfish Moronidae white bass Poeciliidae western mosquitofish Sciaenidae freshwater drum
Alton
La Grange
15 (0.9)
4 (10.3)
Peoria
Rock
Marseilles
11 (1.0) 8 (1.7)
14 (0.8)
Dresden
12 (1.6)
11 (1.4)
8 (3.2)
12 (1.4)
2 (11.6)
4 (4.5)
4 (8.5)
1 (31.2) 6 (4.2)
11 (1.0) 6 (2.4)
7 (3.2) 5 (3.7)
4 (10.6) 5 (9.4)
5 (4.0)
5 (4.8) 11 (1.7) 4 (5.6)
9 (3.3) 12 (1.3) 10 (2.0)
10 (1.7) 10 (1.3)
14 (0.8)
8 (2.1) 10(2.0)
5 (8.9)
2 (8.6)
3 (6.0)
9 (1.4)
9 (2.2)
2 (15.3)
10 (1.5) 6 (3.1) 3 (4.6)
6 (3.8) 9 (3.2) 7 (3.6)
2 (24.1) 5 (4.2) 13 (0.8) 1 (29.9)
3 (15.6) 8 (2.3) 12 (1.2) 1 (30.6)
3 (12.6)
3 (11.3) 13 (1.1) 1 (24.1)
7 (2.3) 12 (1.5) 8 (2.1)
11 (1.7) 8 (4.6) 13 (1.1)
1 (58.7)
6 (7.0) 15 (0.9)
4 (4.1)
6 (7.0)
7 (3.1)
1 (45.1)
13 (1.5)
3 (20.1) 13 (0.8)
2 (18.6) 13 (1.0)
7 (2.1)
11 (1.5)
11 (1.9)
8 (2.7) 2 (14.2)
9 (2.4)
10 (3.1)
16
12
13
6 (3.3)
Number of species accounting for 95 % of total catch
26
14
15
12
this reach. Freshwater drum ranked second with a CPUEN of 14.22 (14.2% of the total). Bullhead minnow ranked third with a CPUEN of 11.26 (11.3% of the total) representing the highest CPUEN for this species in F-101-R sampling. The previous high CPUEN for bullhead minnow was 3.94 recorded in 2005 (McClelland and Cook 2006). La Grange (middle waterway, Illinois River). Twelve fish species accounted for 95.5% of the total catch in La Grange Reach (Tables 6 and 7). Overall, CPUEN was 322.36; the highest catch rate recorded for La Grange Reach in F-101-R sampling. The previous high CPUEN of 315.09 was observed in 1996 (Koel et al. 1997). In 2007, the highest catch rate for any fish species was 189.09 for silver carp which comprised 58.7% of the total fish collected in this reach. Silver carp were first collected in F-101-R sampling in the La Grange Reach in 2002 and catches increased to a point where the 2007 catch rate for silver carp represented the highest CPUEN for any single fish species in the La Grange Reach in F-101-R sampling (McClelland and Pegg 2003). Gizzard shad ranked second with a CPUEN of 27.82 (8.6% of the total). Emerald shiner ranked third with a CPUEN of 14.91 and accounted for 4.6% of the total. Yellow bass x white perch hybrids were again collected for the second year in F-101-R sampling in La Grange Reach at Pekin (RM155.1). Peoria (middle waterway, Illinois River). Thirteen fish species accounted for 94.8% of the total catch in Peoria Reach (Tables 6 and 7). Overall, CPUEN was 518.69 representing the highest catch rate ever recorded for Peoria Reach in F-101-R sampling. A previous high catch rate of 334.97 was observed in 2005 (McClelland and Cook 2006). The highest CPUEN for any fish species was 234.06 for silver carp
27
comprising 45.1% of the total fishes collected in this reach. The catch rate for silver carp, which were first collected in F-101-R sampling in the Peoria Reach in 2004, represented the highest CPUEN for any species in this reach in F-101-R sampling (McClelland and Pegg 2005). Bluegill ranked second in Peoria Reach with a CPUEN of 60.38 (11.6% of the total. Bluegill have ranked among the top two species since 1990 in the Peoria Reach (Lerczak et al. 1993, 1994, 1995, 1996; Koel et al. 1997, 1998, Koel and Sparks 1999; Arnold et al. 2000; McClelland and Pegg 2001, 2002, 2003, 2004, 2005; McClelland and Cook 2006; McClelland and Sass 2007). Gizzard shad ranked third with a CPUEN of 31.33 (6.0% of the total). Orange spotted sunfish ranked fourth in 2007 with a catch rate of 28.93 (5.6% of the total) representing the highest CPUEN for this species in the Illinois River waterway in F-101-R sampling. Channel catfish and smallmouth bass were also collected at their highest CPUEN ever recorded in Peoria Reach in 2007 with catch rates of 7.71 and 1.52, respectively. Four species were collected in Peoria Reach for the first time in F-101-R sampling in 2007; a single rock bass was collected at Lower Twin Sisters Island, a single southern redbelly dace was collected at Henry Island (RM 193.8), northern hogsucker were collected at Lambie’s Boat Harbor (RM 170.3), and round goby were collected at Clark Island (RM 215.3) and Hennepin Island (RM 207.6). The collection of round goby at Hennepin Island marked the furthest downstream record of this species for F-101-R sampling since it was first collected in Marseilles and Dresden Reaches in 2004. The collection of southern redbelly dace was the first collection of this species throughout the Illinois River waterway in F-101-R sampling. Starved Rock (upper waterway, Illinois River). Fourteen fish species 28
accounted for 95.5% of the total catch in Starved Rock Reach (Tables 6 and 7). Overall, CPUEN was 353.00 in 2007. The highest CPUEN for any species was 105.50 recorded for emerald shiner, which comprised 29.9% of the total catch. Bluntnose minnow ranked second with a catch rate of 85.00 comprising 24.1% of the total catch representing the highest CPUEN for this species in Starved Rock Reach in F-101-R sampling. Spotfin shiner ranked third with a catch rate of 71.00 (20.1% of the total) representing the highest CPUEN for this species in Starved Rock Reach in F-101-R sampling. Similar to Peoria Reach, channel catfish and smallmouth bass were also collected at their highest CPUEN ever recorded in Starved Rock Reach in 2007 with catch rates of 7.50 and 4.50, respectively. Bighead carp were collected in Starved Rock Reach for the first time in F-101-R sampling at Bull’s Island (RM 240.8). The collection of bighead carp in Starved Rock Reach marked the furthest upstream record of this species for F-101-R sampling since they were first collected in La Grange Reach in 2000. Marseilles (upper waterway, Illinois River). Fifteen fish species accounted for 95.0% of the total catch in Marseilles Reach (Tables 6 and 7) and overall CPUEN was 239.20 in 2007. The highest CPUEN for any species was 73.20 for emerald shiner. Emerald shiner comprised of 30.6% of the total fishes collected in this reach. Spotfin shiner ranked second with a CPUEN of 44.40 (18.6% of total) and bluntnose minnow ranked third with a CPUEN of 37.20 (15.6% of total), representing the highest catch rate in Marseilles Reach for bluntnose minnow in F-101-R sampling. Largemouth bass again ranked in the top 95% CPUEN in Marseilles Reach; a catch rate of 8.80 (3.7% of the total catch) was recorded for this species in 2007. The catch rate for channel catfish 29
in 2007 was the highest recorded in Marseilles Reach for this species in F-01-R sampling with a CPUEN of 3.60 (1.5% of the total catch). Pumpkinseed were collected for the second time in Marseilles Reach in 2007, the CPUEN of 4.00 observed for this species represented the highest catch rate ever recorded in F-101-R throughout the entire Illinois River waterway. Dresden (upper waterway, Des Plaines River). Twelve fish species accounted for 95.2% of the total catch in Dresden Reach (Tables 6 and 7). Overall, CPUEN was 373.00 in 2007. In 2007, the highest CPUEN for any species was 116.50 for bluegill, which made up 31.2% of the fishes collected. Gizzard shad ranked second with a CPUEN of 57.00 (15.3% of total). Bluntnose minnow ranked third with a CPUEN of 47.00, which comprised 12.6% of the total catch. Green sunfish ranked fourth with a CPUEN of 39.50 (10.6% of total). The catch rate for largemouth bass in 2007 was the highest ever observed for this species in Dresden Reach with a CPUEN of 35.00 (5th ranked, 9.4% of the total catch). This is the second highest catch rate recorded for largemouth bass throughout the entire Illinois River waterway in F-101-R sampling. The highest CPUEN of 41.00 was recorded in 2005 in Starved Rock Reach (McClelland and Cook 2006). The catch rate for channel catfish in 2007 was the highest recorded in Dresden Reach for this species in F-01-R sampling with a CPUEN of 7.00 (1.9% of the total catch). The catch rate for rock bass in 2007 was the highest ever recorded for this species throughout the entire Illinois River waterway with a CPUEN of 8.00 (2.1% of the total catch). The previous high CPUEN of 6.50 was recorded in Dresden Reach in 1995 (Lerczak et. al 1996). Silver redhorse and tadpole madtom were collected for the first time in Dresden Reach in 2007. A single silver redhorse was collected at the Mouth of 30
the Du Page River site (RM 277.4) and a single tadpole madtom was collected at Treat’s Island. Catch Rates in Weights (pounds) Collected per Hour by Reach. The following data summary and discussion was restricted to fish species that individually accounted for over 10% of the total catch and to species that were of special interest. A 95% list was produced for each reach, in which species were ranked by relative biomass (pounds per hour) and added to the list until 95% of the total catch rate in weight for that reach was obtained. Overall, these data indicated that, in terms of biomass, the fish communities of the Illinois River waterway were dominated by silver carp, bighead carp, common carp, smallmouth buffalo, and channel catfish. Alton (lower waterway, Illinois River). Twelve fish species accounted for 95.2% of the total catch by weight in pounds per hour (CPUEW) in Alton Reach (Tables 8 and 9) in 2007. Overall CPUEW was 37.09. Silver carp CPUEW ranked highest at 15.17 (40.9% of total). Channel catfish ranked second with a CPUEW of 5.63 (15.2% of total). Bigmouth buffalo ranked third with a CPUEW of 3.34 (9.0% of total). Common carp CPUEW was 2.62 representing the lowest recorded for this species in Alton Reach in F-101-R sampling.
31
Table 8. Pounds of each fish species collected per hour of electrofishing (CPUEW) on Reach 26 of the Mississippi River (Brickhouse Slough) and on six reaches of the Illinois Waterway in 2007. Pounds per hour less than 0.01, but greater than zero, are indicated by 0.00. Reach and Hours Fished Starved Reach 26 Alton La Grange Peoria Rock Marseilles Dresden Species 1.00 5.75 5.16 7.88 2.00 2.50 2.00 Amiidae bowfin 0.78 Catastomidae bigmouth buffalo 3.34 1.89 25.86 black buffalo 0.73 2.05 1.14 golden redhorse 0.19 0.57 0.47 0.34 0.83 highfin carpsucker 0.37 northern hogsucker 0.58 quillback 0.44 river carpsucker 0.20 0.08 0.22 1.83 0.45 1.65 shorthead redhorse 0.06 0.41 0.01 0.05 0.26 0.02 silver redhorse 0.20 smallmouth buffalo 0.48 5.81 31.57 2.97 2.94 1.16 Centrarchidae black crappie 2.04 1.76 0.20 0.60 0.24 0.45 0.01 bluegill 4.00 0.36 0.13 2.97 0.27 1.02 5.34 bluegill x green sunfish 0.05 0.00 0.05 0.04 2.46 green sunfish 0.39 0.01 0.03 1.25 0.05 0.14 1.73 largemouth bass 1.24 0.49 0.03 3.81 3.40 2.79 22.57 longear sunfish 0.16 orange spotted sunfish 0.07 0.02 0.08 0.22 0.02 0.01 pumpkinseed 0.05 0.02 0.07 0.07 redear sunfish 0.00 rock bass 0.07 0.01 0.22 1.08 smallmouth bass 0.73 0.18 0.07 0.61 0.27 1.34 warmouth 0.06 0.01 white crappie 0.00 0.12 Clupeidae gizzard shad 7.15 0.43 1.33 2.57 0.12 1.04 3.22 skipjack herring 0.02 0.06 threadfin shad 0.01 Cyprinidae bighead carp 25.35 bluntnose minnow 0.00 0.18 0.11 0.15 bullhead minnow 0.02 0.02 0.01 0.07 0.04 0.01 central stoneroller 0.01 common carp 2.62 18.98 45.27 10.05 4.95 32.10 common carp x goldfish 0.21 emerald shiner 0.03 0.08 0.05 0.07 0.31 0.28 0.01 golden shiner 0.01 0.06 goldfish 0.08 0.18 0.88 grass carp 0.00 3.96 red shiner 0.01 0.00 river shiner 0.00 0.00 silver carp 5.41 15.17 32.77 46.30 silver chub 0.00 0.01 0.00 0.00 silverband shiner 0.01 0.00 0.01 southern redbelly dace 0.00 spotfin shiner 0.00 0.00 0.01 0.14 0.12 spottail shiner 0.00 0.02 0.02 0.01 0.00
32
Overall CPUE 26.29 0.16 8.85 0.66 0.34 0.03 0.18 0.04 0.81 0.13 0.02 11.31 0.72 1.67 0.22 0.55 3.54 0.01 0.09 0.03 0.00 0.12 0.26 0.01 0.04 1.76 0.02 0.00 1.93 0.04 0.03 0.00 21.78 0.04 0.10 0.01 0.11 1.19 0.00 0.00 24.08 0.00 0.00 0.00 0.02 0.01
Table 8. (continued) Pounds of each fish species collected per hour of electrofishing (CPUEw) on Reach 26 of the Mississippi River (Brickhouse Slough) and on six reaches of the Illinois Waterway in 2007. Pounds per hour less than 0.01, but greater than zero, are indicated by 0.00. Reach and Hours Fished Starved Reach 26 Alton La Grange Peoria Rock Marseilles Species 1.00 5.75 5.16 7.88 2.00 2.50 Fundulidae blackstripe topminnow 0.00 0.00 Gobiidae round goby 0.00 0.00 0.01 Hiodontidae goldeye 0.08 Ictaluridae brown bullhead 0.18 channel catfish 4.88 5.63 14.84 13.72 11.85 11.99 flathead catfish 0.71 0.53 12.05 7.23 tadpole madtom yellow bullhead 0.04 Lepisosteidae shortnose gar 0.74 Moronidae white bass 1.44 3.12 2.63 0.10 0.69 white perch 0.04 yellow bass 0.17 0.04 yellow bass x white perch 0.01 Percidae logperch
Dresden 2.00
0.00 0.00 0.02
17.82 0.00 0.39
0.00
sauger
0.02
0.05 11.96 4.82 0.00 0.04 0.15 1.81 0.01 0.04 0.00
0.01
mud darter
Overall CPUE 26.29
0.00 0.00
0.04
0.01
Poeciliidae western mosquitofish
0.01
0.01
0.00
Sciaenidae freshwater drum Total pounds per hour
0.09
2.09
2.48
4.60
0.33
2.60
3.00
2.83
27.49
37.09
96.80
196.38
58.78
32.65
94.44
102.67
33
Table 9. Fish species ranked by relative biomass in pounds of fish collected per hour for 2007. Species were added to the list in descending order of abundance until 95% of the total catch for that reach was obtained. Percentages are in parentheses. Rankings by Reach Starved Species
Alton
Amiidae bowfin
8 (2.1)
Catostomidae bigmouth buffalo black buffalo
La Grange
Peoria
3 (9.0) 10 (2.0)
Rock
Marseilles
4 (13.2) 8 (2.1)
6 (1.9)
golden redhorse
8 (0.8)
12 (1.1)
quillback
11 (1.4)
river carpsucker
6 (5.1)
smallmouth buffalo Centrarchidae black crappie
5 (6.0)
3 (16.1)
5 (5.1)
4 (4.7)
3 (9.0) 10 (1.4)
bluegill
10 (1.5)
8 (3.1)
bluegill x green sunfish
4 (5.6) 7 (2.6)
green sunfish largemouth bass
Dresden
8 (1.8) 12 (1.3)
9 (1.9)
smallmouth bass
4 (5.8)
4 (8.6)
7 (1.0)
Clupeidae gizzard shad Cyprinidae bighead carp
2 (23.9) 9 (1.4)
7 (3.2)
5 (3.4)
3 (17.1)
2 (15.2)
1 (34.0)
2 (20.2)
1 (36.7)
3 (18.9)
1 (43.1)
common carp grass carp
4 (7.1)
2 (19.6)
2 (23.1) 8 (2.0)
silver carp
1 (40.9)
1 (33.9)
1 (23.6)
Ictaluridae channel catfish
2 (15.2)
3 (15.3)
5 (7.0)
flathead catfish
11 (1.4)
4 (12.4)
6 (3.7)
Lepisosteidae shortnose gar
9 (2.0)
Moronidae white bass
7 (3.9)
6 (3.2)
Sciaenidae freshwater drum
5 (5.6)
7 (2.6)
7 (2.3)
12
8
10
9 (2.1) 5 (8.0)
6 (3.2)
12
9
Number of species accouting for 95% of total catch
34
8
La Grange (middle waterway, Illinois River).
Eight fish species accounted for
95.1% of the total catch by weight in La Grange Reach (Tables 8 and 9) in 2007. Overall, CPUEW was 96.80 in La Grange Reach in 2007. Silver carp again ranked first in La Grange Reach catch by weight with a CPUEW of 32.77 (33.9% of the total). Common carp ranked second in total catch by weight in La Grange Reach with a CPUEW of 18.98 (19.6% of total). Channel catfish ranked third with a CPUEW of 14.84 (15.3% of total) and flathead catfish ranked fourth with a CPUEW of 12.05 (12.4% of the total). The CPUEW for channel catfish was the highest ever observed for La Grange Reach and the CPUEW for flathead catfish was the highest ever observed throughout the entire Illinois River waterway in F-101-R sampling. The catch by weight for largemouth bass on the La Grange Reach prior to 1996 varied, but was typically above two pounds per hour (Lerczak et al. 1993, 1994, 1995, 1996). CPUEW for largemouth bass has been below two pounds per hour for the last 11 of 12 years (1996, 1997, 1998, 1999, 2001, 2002, 2003, 2004, 2005, 2006, and 2007) and below one pound per hour since 2001 (Koel et al. 1997, 1998; Koel and Sparks, 1999; Arnold et al. 2000; McClelland and Pegg 2002, 2003, 2004, 2005; McClelland and Cook 2006; McClelland and Sass). The catch by weight for largemouth bass (0.03) in 2007 was the second lowest ever recorded in La Grange Reach. Peoria (middle waterway, Illinois River). Ten fish species accounted for 94.4% of the total catch by weight in Peoria Reach (Tables 8 and 9). Overall, CPUEW was 196.38. The Peoria Reach collection was the highest catch by weight recorded for all reaches of the Illinois River waterway in 2007. The highest species-specific CPUEW
35
was 46.30 for silver carp, which made up 23.6% of the total catch by weight for this reach in 2007. The CPUEW for silver carp represents the highest catch by weight ever recorded for this species in the Peoria Reach in F-101-R sampling. Common carp ranked second with a CPUEW of 45.27 (23.1% of total) representing the highest catch by weight in Peoria Reach for this species in F-101-R sampling. Smallmouth buffalo ranked third with a CPUEW of 31.57 (16.1% of total), which also represented the highest catch by weight in Peoria Reach for this species in F-101-R sampling. Channel catfish catch weights were the highest recorded for Peoria Reach for this species in F-101-R sampling. CPUEW in 2007 for channel catfish was 13.72; the previous high CPUEW for channel catfish of 9.51 was recorded in 2006 (McClelland and Sass 2007). Flathead catfish catch weights were also the highest recorded for Peoria Reach for this species in F-101-R sampling. CPUEW in 2007 for flathead catfish was 7.23; the previous high CPUEW for flathead catfish of 4.80 was recorded in 1998 (Koel and Sparks 1999). Starved Rock (upper waterway, Illinois River). Eight fish species accounted for 95.0% of the total catch by weight in Starved Rock Reach (Tables 8 and 9). Overall, CPUEW was 58.78. The catch by weight observed in Starved Rock Reach in 2007 represented the highest CPUEW for this reach in F-101-R sampling. The highest CPUEW for any species was 25.35 for bighead carp, which made up 43.1% of the total. The 2007 catch by weight for bighead carp represented the highest ever recorded for this species throughout the Illinois River waterway and it was the first year this species has been collected in Starved Rock Reach in F-101-R sampling. Two bighead carp collected in Starved Rock Reach accounted for the total biomass. Channel catfish ranked second with a CPUEW of 11.85 (20.2% of total) representing the highest catch 36
by weight in Starved Rock Reach for this species in F-101-R sampling. Common carp ranked third with a CPUEW of 10.05 (17.1% of total). Largemouth bass catch by weight was the highest ever recorded for this species in Starved Rock Reach in F-101-R sampling. CPUEW for largemouth bass in 2007 was 3.40; previous high catch by weight was 1.61 recorded in 1998 (Koel and Sparks 1999). Marseilles (upper waterway, Illinois River). Twelve fish species accounted for 94.7% of the total catch by weight in Marseilles Reach (Tables 8 and 9). Overall, CPUEW was 32.65 in 2007. Channel catfish CPUEW ranked highest at 11.99 (36.7% of total), which represented the highest catch by weight ever recorded in Marseilles Reach for this species in F-101-R sampling. Common carp ranked second with a CPUEW of 4.95 (15.2% of total). Smallmouth buffalo ranked third with a CPUEW of 2.94 (9.0% of total). Dresden (upper waterway, Des Plaines River). Nine fish species accounted for 94.8% of the total catch by weight in Dresden Reach (Tables 8 and 9). Overall, CPUEW was 94.44, representing the highest catch by weight ever observed for Dresden Reach in F-101-R sampling. The highest CPUEW for any species in Dresden Reach for 2007 was 32.10 for common carp, which made up 34.0% of the total. The catch by weight for common carp was the highest ever observed in Dresden Reach for this species in F-101-R sampling. Largemouth bass ranked second with a CPUEW of 22.57 (23.9% of total). The catch by weight observed for largemouth bass represented the highest CPUEW ever recorded for this species throughout the Illinois River waterway in F-101-R sampling. The previous high catch by weight for largemouth bass was 14.24
37
recorded in Dresden Reach in 2002 (McClelland and Pegg 2003). Channel catfish ranked third with a CPUEW of 17.82 (18.9% of total). This is the highest catch by weight ever recorded in Dresden Reach for channel catfish in F-101-R sampling. The catch by weight observed in Dresden Reach for bluegill was 5.34 representing the highest catch by weight ever recorded for bluegill throughout the Illinois River waterway. Fish Health Determined by External Visual Inspection. Sixteen fishes were observed to have externally visible abnormalities in 2007. Abnormalities were found on fishes in all reaches except La Grange. Abnormalities recorded ranged from fin and barbel erosion to external injuries. Fin infections were observed on five fishes, one occurring at Brickhouse Slough on the Mississippi River and four in the upper river. A largemouth bass and smallmouth bass were observed with eye and face injuries in Dresden Reach. One largemouth bass was observed to have a side injury in Alton Reach and a smallmouth buffalo exhibited an eroded opercle in Peoria Reach. CONCLUSIONS Samples collected by electrofishing on the Illinois Waterway during September through October 2007 provided evidence of continued increases in fish species richness, catch rates, and low incidence of visual abnormalities. One hundred fish species and seven hybrids have been collected since William Starrett began this survey in 1957. Eighty three fish species and six hybrids have been documented by project F101-R sampling (1989-present); 60 species and two hybrids from 14 families were collected during 26.34 h of sampling in 2007. Southern redbelly dace were collected for
38
the first time in 2007 along the waterway; a single specimen was collected at Henry Island in Peoria Reach (middle waterway). Yellow bass x white perch hybrid was collected for the second time in F-101-R sampling; one specimen was collected at Pekin in La Grange Reach (middle waterway). Rock bass and northern hogsucker were collected for the first time in Peoria Reach in 2007. A single rock bass was collected at Lower Twin Sisters Island and five specimens of northern hogsucker were collected at Lambie’s Boat Harbor. Round goby were also collected for the first time at two sites in Peoria Reach (Clark Island and Hennepin Island) and bighead carp were collected for the first time in Starved Rock Reach (upper river) at Bull’s Island in 2007. These two invasive species are expanding their ranges in opposite directions along the Illinois River waterway. Round goby expansion is occurring downstream from Lake Michigan and the 2007 collections in Peoria Reach illustrate the furthest downstream collection from previous years (2004-2006). Bighead carp expansion is occurring upstream from the Mississippi River and the 2007 collections of this species in Starved Rock Reach illustrate the furtherest upstream collection from previous years (2000-2006). A single specimen each of two species, silver redhorse and tadpole madtom, were collected for the first time in Dresden Reach (upper river) at the Mouth of the Du Page River and Treat’s Island, respectively. Peoria Reach continued to produce the highest number of fish species (39) along the Illinois River waterway and the highest total catch (4,108). This was likely due, in part, to a greater number of sites in this reach, varied site types (backwater and side channel), and its position along the waterway, which included the Great Bend (above Hennepin) of the Illinois River. Peoria Reach represents a transition from a river which 39
is constricted, has few contiguous backwaters, and is high in gradient (upper river) to a large river floodplain system with low gradient (lower river) (Sparks 1977). Catch rates in terms of number of fish collected per hour and total catch numbers along the Illinois Waterway were the highest ever recorded for La Grange and Peoria reaches. Catches of several sportfish species in multiple reaches were at their highest in 2007. Channel catfish exhibited high catch rates for Peoria, Starved Rock, Marseilles, and Dresden reaches. Smallmouth bass catches were at their highest for Peoria and Starved Rock reaches. Largemouth bass catches were at their highest for Dresden Reach. Pumpkinseed catches in Marseilles Reach and rock bass catches in Dresden Reach were the highest ever recorded for these species throughout the entire river in F-101-R sampling. Increased catches of individual sportfish species may be a result of numerous factors, many of which may be difficult to identify, but may be indicative of improved water quality conditions, coherent timing of hydrological events (flooding), and habitat improvements. The catch in weight of fishes collected was again highest in Peoria Reach, where CPUEW was 196.38. Fish species accounting for this high catch in weight were silver carp, common carp, smallmouth buffalo, and channel catfish. Several sportfish species catches in terms of relative biomass were at their highest in 2007. Channel catfish catch in weight was the highest ever observed for La Grange, Peoria, Starved Rock, Marseilles, and Dresden reaches. Flathead catfish catch in weight was the highest ever observed for Peoria Reach and the catch in weight recorded for this species in La Grange Reach was the highest ever observed throughout the Illinois River waterway. Largemouth bass catch in weight was the highest ever observed for Starved Rock 40
Reach and the catch in weight recorded for this species in Dresden Reach was the highest ever observed throughout the Illinois River waterway. Bluegill catch in weight in Dresden Reach was also the highest ever observed throughout the Illinois River waterway. Non-native fish species continued to have a major role in relative biomass catches in the Illinois River waterway. Common carp, silver carp, bighead carp, and grass carp combined to produce 1284.7 pounds of the 2676.8 (48.0%) total pounds collected on the Illinois River waterway. Silver carp relative biomass collections continue to increase in the lower and middle river. The catch in weight of silver carp was the highest recorded for this species in Peoria Reach. Since their first collection in Alton Reach in 2001, silver carp biomass has increased to become the dominant species by weight for the Illinois Waterway (although only collected in the lower and middle waterway reaches, ranking 1st in all three reaches in 2007) with a total of 628.9 pounds collected in 2007. Of the 2,704.3 total pounds of fish collected during our 2007 survey, 2,087.7 pounds (77.2%) were collected from the middle river. The upper waterway produced 388.1 pounds (14.4%) while the lower waterway produced 201.0 pounds (7.4%). Although these catches may be reflective of higher productivity of the middle Illinois Waterway floodplain ecosystem, a greater number of collections in this section may likely play a role. Sport fishes were collected throughout the waterway in 2007, although catch rate in number and weight varied among reaches. For channel catfish, we usually collect more individuals per hour in Alton Reach (lower waterway) than in the middle or upper waterway reaches. However, La Grange Reach produced the greatest catch of channel 41
catfish in number over all reaches. In terms of catch in weight for channel catfish, the lower and middle waterway reaches usually produced the highest pounds per hour. In 2007, Dresden Reach exhibited the highest CPUEW of channel catfish at 17.82 pounds per hour. White bass were most abundant and provided the highest CPUEW in the middle waterway. Black crappie was most abundant and provided the highest catches by weight in the lower waterway. Bluegill CPUEN and CPUEW was greatest in Dresden Reach of the upper waterway. Largemouth bass CPUEN and CPUEW was also highest in Dresden Reach in 2007. As in previous years of project F-101-R sampling, we collected low numbers of sauger. Smallmouth bass, which were usually found in low numbers, were again collected in every reach of the upper waterway, in the Peoria Reach of the middle waterway, and Alton Reach of the lower waterway. A total of 16 fishes had externally visible abnormalities. Seven (43.7%) were sediment-contact fishes. The highest incidence occurred in the upper waterway where 0.5% of all fishes exhibited visual abnormalities. In the lower and middle waterway, only 0.2% and 0.03% fishes, respectively, exhibited abnormalities. LITERATURE CITED Arnold, J.L., T.M. Koel, and R.E. Sparks. 2000. The long-term Illinois River fish population monitoring program. Project F-101-R-11 Annual Report. Center for Aquatic Ecology Technical Report 00/05. Illinois Natural History Survey, Champaign. 36pp. Koel, T.M., R.E. Sparks, K.D. Blodgett, and S.D. Whitney. 1997. The long-term Illinois River fish population monitoring program (F-101-R-8). Annual Report to the Illinois Department of Natural Resources. Aquatic Ecology Technical Report 97/14. Illinois Natural History Survey, Champaign. 35 pp. Koel, T.M., R.E. Sparks, and K.D. Blodgett. 1998. The long-term Illinois River fish population monitoring program. Project F-108-R-9 Annual Report. Center for Aquatic Ecology Technical Report 98/8. Illinois Natural History Survey, Champaign. 35 pp.
42
Koel, T.M., and R.E. Sparks. 1999. The long-term Illinois River fish population monitoring program (F-101-R). Final Report to the Illinois Department of Natural Resources. Aquatic Ecology Technical Report 99/15. Illinois Natural History Survey, Champaign. 60 pp. Cross, F.B. and J.T. Collins. 1995. Fishes in Kansas 2nd edition, revised. University Press of Kansas. 315 pp. Lerczak, T.V., R.E. Sparks, and K.D. Blodgett. 1992. The long-term Illinois River fish population monitoring program (F-101-R). Annual Report to the Illinois Department of Conservation. Aquatic Ecology Technical Report 92/9. Illinois Natural History Survey, Champaign. 51 pp. Lerczak, T.V., R.E. Sparks, and K.D. Blodgett. 1993. The long-term Illinois River fish population monitoring program (F-101-R). Annual Report to the Illinois Department of Conservation. Aquatic Ecology Technical Report 93/3. Illinois Natural History Survey, Champaign. 76 pp. Lerczak, T.V. and R.E. Sparks. 1994. Fish populations in the Illinois River. Pages 239241 in K.P. Pabich, editor. The changing Illinois environment: critical trends, volume 3, ecological resources. ILENR/RE-EA-95/05. Illinois Department of Energy and natural Resources, Springfield. Lerczak, T.V., and R.E. Sparks, and K.D. Blodgett. 1994. The long-term Illinois River fish population monitoring program (F-101-R). Final Report to the Illinois Department of Conservation. Aquatic Ecology Technical Report 94/5. Illinois Natural History Survey, Champaign. 105 pp.
Lerczak, T.V., R.E. Sparks, and K.D. Blodgett. 1995. The long-term Illinois River fish population monitoring program (F-101-R-6). Annual Report to the Illinois Department of Conservation. Aquatic Ecology Technical Report 95/4. Illinois Natural History Survey, Champaign. 38 pp. Lerczak, T.V., R.E. Sparks, and K.D. Blodgett. 1996. The long-term Illinois River fish population monitoring program (F-101-R-7). Annual Report to the Illinois Department of Natural Resources. Aquatic Ecology Technical Report 96/2. Illinois Natural History Survey, Champaign. 38 pp. McClelland, M.A., and G.G. Sass. 2007. The long-term Illinois River fish population monitoring program. Project F-101-R-18 Annual Report to the Illinois Department of Natural Resources. Illinois Natural History Survey Technical Report 2007(24). Illinois Natural History Survey, Champaign. 53 pp.
43
McClelland, M.A., and T.R. Cook. 2006. The long-term Illinois River fish population monitoring program. Project F-101-R-17 Annual Report to the Illinois Department of Natural Resources. Center for Aquatic Ecology Technical Report 06/3. Illinois Natural History Survey, Champaign. 54 pp. McClelland, M.A., and M.A. Pegg. 2005. The long-term Illinois River fish population monitoring program. Project F-101-R-16 Annual Report to the Illinois Department of Natural Resources. Center for Aquatic Ecology Technical Report 05/8. Illinois Natural History Survey, Champaign. 50 pp. McClelland, M.A., and M.A. Pegg. 2004. The long-term Illinois River fish population monitoring program. Project F-101-R-15 Final Report to the Illinois Department of Natural Resources. Center for Aquatic Ecology Technical Report 04/3. Illinois Natural History Survey, Champaign. 82 pp. McClelland, M.A., and M.A. Pegg. 2003. The long-term Illinois River fish population monitoring program. Project F-101-R-14 Annual Report to the Illinois Department of Natural Resources. Center for Aquatic Ecology Technical Report 03/5. Illinois Natural History Survey, Champaign. 48 pp. McClelland, M.A., and M.A. Pegg. 2002. The long-term Illinois River fish population monitoring program. Project F-101-R-13 Annual Report to the Illinois Department of Natural Resources. Center for Aquatic Ecology Technical Report 02/5. Illinois Natural History Survey, Champaign. 46 pp.
McClelland, M.A., and M.A. Pegg. 2001. The long-term Illinois River fish population monitoring program. Project F-101-R-12 Annual Report to the Illinois Department of Natural Resources. Center for Aquatic Ecology Technical Report 01/5. Illinois Natural History Survey, Champaign. 35 pp. Pflieger, W.L. 1975. The fishes of Missouri. Missouri Department of Conservation. 343 pp. Robins, C.R., R.M. Bailey, C.E. Bond, J.R. Brooker, E.A. Lachner, R.N. Lea, and W.B. Scott. 1991. Common and scientific names of fishes from the United States and Canada. Special Publication number 20. American Fisheries Society, Bethesda, MD Sparks, R.E. 1977. Environmental inventory and assessment of navigation pools 24, 25, and 26, Upper Mississippi and lower Illinois Rivers: an electrofishing survey of the Illinois River, Special Report No. 5 Water Resources Center, University of Illinois, Urbana. 82 pp. Sparks, R.E. and W.C. Starrett. 1975. An electrofishing survey of the Illinois River, 44
1959-1974. Illinois Natural History Survey Bulletin 31:317-380. Sparks, R.E. and T.V. Lerczak. 1993. Recent trends in the Illinois River indicated by fish populations. Aquatic Ecology Technical Report 93/16. Illinois Natural History Survey, Champaign. 34 pp.
45
APPENDIX A. Fish species collected during Long-term Monitoring of the Illinois Waterway, 1957-2007. Common names marked by an asterisk indicate species that were collected from 1989 through 2007 during federal aid project F-101-R. Common and scientific names are from Robins et al. (1991) and Cross et al. (1995). Habitat associations are based on behavioral descriptions from Pflieger (1975), Cross et al. (1995) and communications with INHS fisheries biologists. Family Name
Common Name
Scientific Name
Lepisosteidae
longnose gar* shortnose gar* spotted gar*
Lepisosteus osseus Lepisosteus platostomus Lepisosteus oculatus
Amiidae
bowfin*
Amia calva
Hiodontidae
goldeye* mooneye*
Hiodon alosoides Hiodon tergisus
Anguillidae
American eel
Anguilla rostrata
Clupeidae
gizzard shad* skipjack herring* threadfin shad*
Dorosoma cepedianum Alosa chrysochloris Dorosoma petenense
Cyprinidae
bighead carp* bigmouth shiner* blacknose dace* bluntnose minnow* bullhead minnow* central stoneroller* common carp* common carp x goldfish* common shiner* creek chub* emerald shiner* fathead minnow* ghost shiner golden shiner* goldfish* grass carp* hornyhead chub Mississippi silvery minnow pugnose minnow redfin shiner red shiner* ribbon shiner* river shiner* sand shiner* silverband shiner* silver carp* silver chub* silverjaw minnow southern redbelly dace* spotfin shiner* spottail shiner* steelcolor shiner striped shiner* suckermouth minnow*
Hypophthalmichthys nobilis Notropis dorsalis Rhinichthys atratulus Pimephales notatus Pimephales vigilax Campostoma anomalum Cyprinus carpio Cyprinus carpio x Carassius aurtatus Luxilus cornutus Semotilus atromaculatus Notropis atherinoides Pimephales promelas Notropis buchanani Notemigonus crysolucas Carassius auratus Ctenopharyngodon idella Nocomis biguttatus Hybognathus nuchalis Opsopoeodus emiliae Lythrurus umbratilis Cyprinella lutrensis Lythrurus fumeus Notropis blennius Notropis stramineus Notropis shumardi Hypophthalmichthys molitrix Hybopsis storeriana Notropis buccatus Phoxinus erythrogaster Cyprinella spiloptera Notropis hudsonius Cyprinella whipplei Luxilus chrysocephalus Phenacobius mirabilis
bigmouth buffalo* black buffalo* black redhorse golden redhorse* highfin carpsucker* northern hogsucker* quillback* river carpsucker* river redhorse shorthead redhorse* silver redhorse* smallmouth buffalo* white sucker*
Ictiobus cyprinellus Ictiobus niger Moxostoma duzuesnei Moxostoma erythrurum Carpoides velifer Hypentelium nigricans Carpoides cyprinus Carpoides carpio Moxostoma carinatum Moxostoma macrolepidotum Moxostoma anisurum Ictiobus bubalus Catostomus commersoni
Catostomidae
46
Habitat Association (B=benthic)
B B
B B B
B
B
B B
B B B B B B B B B B B B B B
Appenidix A Continued. Family Name
Common Name
Scientific Name
Ictaluridae
black bullhead* blue catfish brown bullhead* channel catfish* flathead catfish* freckled madtom* tadpole madtom* white catfish yellow bullhead*
Ameiurus melas Ictalurus furcatus Ameiurus nebulosus Ictalurus punctatus Pylodictis olivaris Noturus nocturnus Noturus gyrinus Ameiurus catus Ameiurus natalis
Esocidae
grass pickerel* nothern pike
Esox americanus vermiculatus Esox lucius
Salmonidae
rainbow trout
Oncoryhnchus mykiss
Percopsidae
trout-perch
Percopsis omiscomaycus
Fundulidae
banded killifish* blackstripe topminnow*
Fundulus diaphanus Fundulus notatus
Poeciliidae
western mosquitofish*
Gambusia affinis
Atherinidae
brook silverside*
Labidesthes sicculus
Moronidae
striped bass striped bass x white bass* white bass* white perch* yellow bass* yellow bass x white perch*
Morone saxatilis Morone saxatilis x M. chrysops Morone chrysops Morone americana Morone mississippiensis Morone mississippiensis x M. americana
Centrarchidae
black crappie* bluegill* bluegill x green sunfish* green sunfish* largemouth bass* longear sunfish* orangespotted sunfish* orangespotted sunfish x bluegill* orangespotted sunfish x green sunfish* pumpkinseed* pumpkinseed x green sunfish* redear sunfish* rock bass* smallmouth bass* spotted sunfish* warmouth* white crappie*
Pomoxis nigromaculatus Lepomis macrochirus Lepomis macrochirus x L. cyanellus Lepomis cyanellus Micropterus salmoides Lepomis megalotis Lepomis humilis Lepomis humilis x L. macrochirus Lepomis humilis x L. cyanellus Lepomis gibbosus Lepomis gibbosus x L. cyanellus Lepomis microlophus Ambloplites rupestris Micropterus dolomieu Lepomis punctatus Lepomis gulosus Pomoxis annularis
Percidae
bluntnose darter johnny darter* logperch* mud darter* sauger* slenderhead darter* walleye* yellow perch*
Etheostoma chlorosomum Etheostoma nigrum Percina caprodes Etheostoma asprigene Stizostedion canadense Percina phoxocephala Stizostedion vitreum Perca flavescens
B B B B
Sciaenidae
freshwater drum*
Aplodinotus grunniens
B
Gobiidae
round goby*
Neogobius melanostomus
B
47
Habitat Association (B=benthic) B B B B B B B B B
B
B
APPENDIX B. Species richness (S) at Long-term Illinois River Fish Population Monitoring (F-101-R) sites. Description Site # Reach Low S (year) High S (year) Treats Island 279.8 3 10 (2003) 20 (2007) Du Page River 277.4 3 11 (1999, 2000) 20 (2006) Waupecan Island 260.6 4 11 (1996) 22 (2007) Johnson Island 249.6 4 6 (1993) 16 (1995) Ballards Island 248.0 4 10 (1991) 22 (2007) Bulls Island Bend 241.5 5 8 (1990) 25 (2007) Bulls Island 240.8 5 8 (1990, 96, 99) 21 (2007) Clark Island 215.3 6 11 (1990) 24 (2007) Hennepin 207.6 6 2 (1990) 27 (2007) Upper Twin Sister 203.3 6 8 (1990) 22 (2001) Lower Twin Sister 202.8 6 7 (1992) 22 (2007) Henry Island 193.8 6 12 (1991) 24 (2005) Chillicothe 180.6 6 14 (1989,91,92,96) 26 (2006) Lambie's Boat Harbor 170.3 6 9 (1989) 22 (2006) Lower Peoria Lake 163.3 6 10 (1989) 20 (2005) Pekin 155.1 7 6 (1992) 19 (2005) Turkey Island 148.0 7 8 (2004) 18 (2007) Upper Bath Chute 113.0 7 12 (1994) 22 (2001, 2007) Lower Bath Chute 107.1 7 9 (1992) 19 (2001) Sugar Creek Island 95.1 7 10 (1989, 1999, 2003) 20 (2005) Grape-Bar Islands 86.5 7 7 (1989) 23 (1994) Moore's Towhead 75.3 8 6 (2002) 17 (2004, 2005) Big Blue Island 58.3 8 9 (1990) 20 (2005, 2006) Crater-Willow Islands 30.0 8 11 (2003) 19 (2007) Hurricane Island 26.8 8 11 (1990, 1999, 2004) 20 (1997) Dark Chute 24.7 8 11 (1994, 2004) 18 (2006) Mortland Island 19.0 8 10 (2003) 19 (2006) Brickhouse Slough 0.0 26 10 (1990) 20 (2005) 1 Sites 0.0-215.3 were not sampled during 1993 (n=18 years) (sites 240.8-279.8 n=19 years).
48
APPENDIX C. Total catch (C) at Long-term Illinois River Fish Population Monitoring (F-101-R) sites. Description Site # Reach Low C (year) High C (year) Treats Island 279.8 3 55 (1996) 586 (1995) Du Page River 277.4 3 88 (1991) 614 (1995) Waupecan Island 260.6 4 35 (1996) 266 (2006) Johnson Island 249.6 4 15 (2003) 224 (2007) Ballards Island 248.0 4 34 (1991) 492 (2005) Bulls Island Bend 241.5 5 36 (1990) 897 (1995) Bulls Island 240.8 5 32 (1990) 919 (2006) Clark Island 215.3 6 45 (1991) 396 (1997) Hennepin 207.6 6 2 (1990) 523 (2005) Upper Twin Sister 203.3 6 33 (1990) 222 (2007) Lower Twin Sister 202.8 6 33 (1990) 218 (2001) Henry Island 193.8 6 54 (1990) 474 (1996) Chillicothe 180.6 6 80 (1992) 331 (2007) Lambie's Boat Harbor 170.3 6 47 (2003) 2293 (2007) Lower Peoria Lake 163.3 6 83 (1991) 507 (2005) Pekin 155.1 7 22 (1992) 524 (1996) Turkey Island 148.0 7 30 (1992) 165 (1995) Upper Bath Chute 113.0 7 80 (2002, '03) 581 (2007) Lower Bath Chute 107.1 7 57 (1992) 701 (2007) Sugar Creek Island 95.1 7 37 (2003) 238 (1996) Grape-Bar Islands 86.5 7 42 (1990) 524 (1994) Moore's Towhead 75.3 8 31 (2003) 263 (2005) Big Blue Island 58.3 8 25 (1990) 240 (2005) Crater-Willow Islands 30.0 8 57 (2003) 207 (1994) Hurricane Island 26.8 8 50 (1999) 304 (2005) Dark Chute 24.7 8 47 (2004) 237 (1991) Mortland Island 19.0 8 28 (2004) 195 (1991) Brickhouse Slough 0.0 26 53 (1996) 267 (2006) 1 Sites 0.0-215.3 were not sampled during 1993 (n=18 years) (sites 240.8-279.8 n=19 years).
49
Appendix D (Job 5). Publications, reports, and presentations that resulted from research conducted during segments 6-15 of project F-101-R, the Long-term Illinois River Fish Population Monitoring Program (funded under Federal Aid in Sportfish Restoration Act, P.L. 81-681, Dingell-Johnson, Wallup-Breaux). I. Publications Irons, K.S., G.G. Sass, M.A. McClelland, and J.D. Stafford. 2007. Reduced Condition Factor of Two Native Fish Species Coincident with Invasion of Non-native Asian Carps in the Illinois River, USA: Evidence for Competition and Reduced Fitness? Journal of Fish Biology 71 (Supplement D), 258-273. Koel, T.M. and Richard E. Sparks. 2000. Ecohydrology of the Illinois River and development of ecological criteria for operation of dams. Regulated Rivers: Research and Management. Koel, T.M. 2000. Ecohydrology and development of ecological criteria for operation of dams. Project Status Report 2000-02. U.S. Geological Survey, Upper Midwest Environmental Sciences Center, Onalaska, Wisconsin. Koel, T.M. 2000. Abundance of age-0 fishes correlated with hydrologic indicators. Project Status Report 2000-03. U.S. Geological Survey, Upper Midwest Environmental Sciences Center, Onalaska, Wisconsin. Koel, T.M. 1998. Channel catfish (Ictalurus punctatus) in the Upper Mississippi River System. Project Status Report 98-11. U.S. Geological Survey, Environmental Management Technical Center, Onalaska, Wisconsin. Koel, T.M., R. Sparks, and R.E. Sparks. 1998. Channel catfish in the Upper Mississippi River System. Survey Report No. 353. Illinois Natural History Survey, Champaign. Lerczak, T.V., R.E. Sparks, and K.D. Blodgett. 1994. Some upstream-to-downstream differences in Illinois River fish communities. Transactions of the Illinois State Academy of Science 87(Supplement):53. (Abstract) Lerczak, T.V. 1995. Fish community changes in the Illinois River, 1962-1994. American Currents (Summer Issue). Lerczak, T.V. 1995. The gizzard shad in nature’s economy. Illinois Audubon. (Summer Issue). Reprinted in Big River 2(12):1-3.
Lerczak, T.V., and R.E. Sparks. 1995. Fish populations in the Illinois River. Pages 7-9 in G.S. Farris, editor. Our living resources 1994. National Biological Survey, Washington, D.C. 50
Lerczak, T.V., R.E. Sparks, and K.D. Blodgett. 1995. Long-term trends (1959-1994) in fish populations of the Illinois River. Transactions of the Illinois State Academy of Science 88(Supplement):74. (Abstract) Lerczak, T.V., R.E. Sparks, and K.D. Blodgett. 1995. Long-term trends (1959-1994) in fish populations of the Illinois River with emphasis on upstream-to-downstream trends. Proceedings of the Mississippi River Research Consortium 27:62-63. Lerczak, T.V. 1996. Illinois River fish communities: 1960’s versus 1990’s. Illinois Natural History Survey Report No. 339. McClelland, Michael A., Mark A. Pegg, and Timothy W. Spier. 2006. Longitudinal Patterns of the Illinois Waterway Fish Community. Journal of Freshwater Ecology. 21/1:91-99. Pegg, M.A. and M.A. McClelland. 2004. Assessment of spatial and temporal fish community patterns in the Illinois River. Ecology of Freshwater Fish 13:125-135. Pegg, M. A. 2002. Invasion and transport of non-native aquatic species in the Illinois River. Pages 203-209 in A.M. Strawn, editor. Proceedings of the 2001 Governor’s conference on the management of the Illinois River System, Special Report Number 27, Illinois Water Resources Center, Champaign, Illinois. Raibley, P.T., K.D. Blodgett, and R.E. Sparks. 1995. Evidence of grass carp (Ctenopharyngodon idella) reproduction in the Illinois and upper Mississippi Rivers. Journal of Freshwater Ecology 10:65-74. Sparks, R.E. 1995. Value and need for ecosystem management of large rivers and their floodplains. Bioscience 45:168-182. Sparks, R.E. 1995. Environmental effects. Pages 132-162 in S.A. Changnon, editor. The great flood of 1993. University Corporation for Atmospheric Research (UCAR) and Westview Press. II. Essays Pegg, M.A. 2002. Aquatic resource monitoring in the Upper Mississippi River Basin. INHS Reports. Number 371:8-9. III. Technical Papers (presenters in bold) Kevin S. Irons, Greg G. Sass, Thad R. Cook, T. Matt O'Hara, Michael A. McClelland, Nerissa N. Michaels, and Mathew R. Stroub. An Overview of the Illinois River Biological Station's Asian Carps Research. The 64th Annual Meeting of the UMRCC & 15th 51
Annual Meeting of the LMRCC, Collinsville, IL, 18-20 March 2008. Kevin S. Irons, Greg G. Sass, Thad R. Cook, T. Mathew O’Hara, Michael A. McClelland, Nerissa N. Michaels, and Mathew R. Stroub. An Overview of the Illinois River Biological Station’s Asian Carp’s Research. Presented at the 46th Annual Meeting of the Illinois Chapter of the American Fisheries Society, Rockford, IL, February 26-28, 2008. Michael A. McClelland, Greg G. Sass, Thad R. Cook, Kevin S. Irons, T. Matt O’Hara, Camilla S. Smith, Nerissa N. Michaels, and Mathew R. Stroub. Fifty Years of the LongTerm Illinois River Fish Population Monitoring Program, 1957-2007. Presented at the 46th Annual Meeting of the Illinois Chapter of the American Fisheries Society, Rockford, IL, February 26-28, 2008. Kevin S. Irons, Greg G. Sass, Michael A. McClelland, and Joshua D. Stafford. Reduced Condition Factor of Two Native Fish Species Coincident with Invasion of Nonnative Asian Carps in the Illinois River, USA: Evidence for Competition and Reduced Fitness? Fisheries Society of the British Isles International Symposium: Non-native Fishes: Integrated Biology of Establishment Success and Dispersal. University of Exeter, Exeter, U.K., July 23-27. Kevin S. Irons, Greg G. Sass, Michael A. McClelland, and Joshua D. Stafford. Reduced Condition Factor of Two Native Fish Species Coincident with Invasion of Nonnative Asian Carp in the Illinois River: Evidence for Competition and Reduced Fitness? Presented at the 39th Annual Meeting of the Mississippi River Research Consortium, La Crosse, WI, April 12-13, 2007. Michael A. McClelland and Greg G. Sass. Trends in Largemouth Bass and Bluegill Populations Among the Upper and Lower Illinois River, 1957-2006. Presented at the 39th Annual Meeting of the Mississippi River Research Consortium, La Crosse, WI, April 12-13, 2007. Kevin S. Irons, Greg G. Sass, Michael A. McClelland, and Joshua D. Stafford. Reduced Condition Factor of Two Native Fish Species Coincident with Invasion of Nonnative Asian Carp in the Illinois River: Evidence for Competition and Reduced Fitness? Presented at the 45th Annual Meeting of the Illinois Chapter of the American Fisheries Society, Lake Shelbyville, IL, February 27-March 1, 2007. Michael A. McClelland and Greg G. Sass. Trends in largemouth bass and bluegill populations among the upper and lower Illinois River, 1957-2006. Presented at the 45th Annual Meeting of the Illinois Chapter of the American Fisheries Society, Lake Shelbyville, IL, February 27-Mar 1, 2007. Michael A. McClelland, Mark A. Pegg, Kevin S. Irons, and T. Matt O’Hara. Fish 52
Abundances of Backwater Lakes with Connectivity Gradients in the La Grange Reach, Illinois River. Presented at the 37th Annual Meeting of the Mississippi River Research Consortium, La Crosse, WI, April 28-29, 2005. McClelland, Michael A., Kevin S. Irons, T. Matt O’Hara, Mark A. Pegg, and Thad R. Cook. A Comparison of Two Electrofishing Gears Used for Fish Monitoring on the Illinois River. Presented at the 36th Annual Meeting of the Mississippi River Research Consortium, LaCrosse, WI, April 1-2, 2004. McClelland, Michael A. and Mark A. Pegg. Longitudinal Patterns of the Illinois Waterway Fish Community. Presented at the 64th Annual Midwest Fish and Wildlife Conference, Kansas City, MO, December 7-10, 2003. Pegg, M.A. and M.A. McClelland. Assessment of spatial and temporal fish community patterns in the Illinois River. Presented at the American Fisheries Society meeting, Quebec City, Quebec Canada, August, 2003. O’Hara, T.M., K.S. Irons, M.A. McClelland, and M.A. Pegg. Status of bighead carp and silver carp in the La Grange Reach, Illinois River and possible impacts to the commercial fishery. 41st Annual Meeting of the Illinois Chapter of the American Fisheries Society, Mt. Vernon, Illinois, 4-6 March, 2003. Irons, K.S., T.M. O’Hara, M.A. McClelland, and M.A. Pegg. Status of non-native fish species in the Illinois River. 41st Annual Meeting of the Illinois Chapter of the American Fisheries Society, Mt. Vernon, Illinois, 4-6 March, 2003. O’Hara, T.M., K.S. Irons, M.A. McClelland, and M.A. Pegg. Status of bighead carp and silver carp in the La Grange Reach, Illinois River and possible impacts to the commercial fishery. Presented at the 34th Annual Meeting of the Mississippi River Research Consortium, LaCrosse, Wisconsin, April, 2002. Irons, K.S., T.M. O’Hara, M.A. McClelland, and M.A. Pegg. White perch distributions in the Illinois River: detecting an invasive species with the Long Term Resource Monitoring Program. Presented at the 34th Annual Meeting of the Mississippi River Research Consortium, LaCrosse, Wisconsin, April, 2002.
O’Hara, T.M., K.S. Irons, M.A. McClelland, and M.A. Pegg. Status of bighead carp and silver carp in the La Grange Reach, Illinois River and possible impacts to the commercial fishery. Presented at the 2002 North Central Division American Fisheries Society River and Streams Technical Committee Meeting, Moline, Illinois, March 2002. McClelland, M.A., Irons, K.S., and T.M. O’Hara, and M.A. Pegg. White perch (morone americana) occurrence in the Illinois River, Upper Mississippi River System. 53
Presentation at the Illinois-Iowa American Fisheries Society Annual Meeting, Moline, Illinois, February , 2002. Pegg, M.A. Invasion and transport of non-native aquatic species in the Illinois River. 2001 Governor’s conference on the management of the Illinois River System, Peoria, Illinois, October, 2001. Koel, T.M. and Richard E. Sparks. Ecohydrology of the Illinois River: development of criteria for operation of the La Grange and Peoria locks and dams. 32nd Annual Meeting of the Mississippi River Research Consortium, La Crosse, Wisconsin, April 1314, 2000. Koel, T.M., T.R. Cook, and K.S. Irons. Criteria for biota-friendly operations of the Peoria and La Grange locks and dams, Illinois River Waterway. 61st Midwest Fish and Wildlife Conference, Chicago, Illinois December 5-8, 1999. Koel, T.M. and R.E. Sparks. Interannual variation in catches of young-of-year fish correlated with hydrology of the Upper Mississippi River System. 47th Annual Meeting of the North American Benthological Society, Duluth, Minnesota, May 23-24, 1999. Koel, T.M. Changes in fish community structure: effects of hydrological variability in the Upper Mississippi River System. Presented to the Illinois Natural History Survey, Center for Aquatic Ecology, Havana Field Station Director Search Committee and Senior Staff, March 24, 1999. Koel, T.M. Spatial and temporal variability of channel catfish populations in the Upper Mississippi River System. Illinois Department of Natural Resources LTRMP field station biannual retreat, Dickson Mounds, Illinois, December 15, 1998. Koel, T.M. Long Term Resource Monitoring Program Showcase: analysis of catfish catch. Environmental Management Program Coordinating Committee, Fall Quarterly Meeting, Rock Island, Illinois, November 19-20, 1998.
Koel, T.M. and K.D. Blodgett. Fish-environment associations: effects of inter-annual hydrological variability on fish populations of the Illinois River waterway, 1957-1997. Upper Mississippi River Conservation Committee, Fish Technical Section Annual Fall Meeting, Dubuque, Iowa, September 15-17, 1998. Koel, T.M., K.S. Irons, T.M. O’Hara, K.D. Blodgett, and R.E. Sparks. Changes in fish community structure: effects of hydrological variability in the Upper Mississippi River System. 128th Annual Meeting of the American Fisheries Society, Hartford, 54
Connecticut, August 23-27, 1998. Koel, T.M., T.M. Mihuc, R.E. Sparks, and K.D. Blodgett. Upper Mississippi River System status and trends report. Fish species-environment relationships: LTRMP data analysis and preliminary results. 54th Annual Meeting of the Upper Mississippi River Conservation Committee, Moline, Illinois, 17-19 March 1998. Blodgett, K.D. and T.M. Mihuc. Decision support using Long Term Resource Monitoring Program component data and supplementary data on the Illinois River. 54th Annual Meeting of the Upper Mississippi River Conservation Committee, Moline, Illinois, 17-19 March 1998. Koel, T.M. and T.M. Mihuc. Fish abundance in the La Grange Reach of the Illinois River correlated with environmental factors: problems of cross-component analysis. Presented at the Long Term Resource Monitoring Program Annual Winter Meeting, Davenport, Iowa, 13 January 1998. Lerczak, T.V., R.E. Sparks, and K.D. Blodgett. Some upstream-to-downstream differences in Illinois River fish communities. Contributed paper presented at the Illinois State Academy of Science Annual Meeting, Galesburg, Illinois, 7 October 1994. Sparks, R.E. Large river-floodplain ecosystems of the Midwest: status, trends, and management needs. Presented at the U.S. Environmental Protection Agency’s “Ecological Seminar Series” held in Chicago, Illinois, 14 March. IV. Poster Presentations (presenter in bold) Koel, T.M. and R.E. Sparks. The Long-term Illinois River Fish Population Monitoring Program. National Meeting of the Ecological Society of America, Spokane, Washington, August 10-14, 1998. Lerczak, T.V., R.E. Sparks, and K.D. Blodgett. Long-term trends (1959-1994) in fish populations of the Illinois River. Poster presented at the 56th Midwest Fish and Wildlife Conference, Indianapolis, Indiana, 4-7 December 1994. Lerczak, T.V., R.E. Sparks, and K.D. Blodgett. Long-term trends (1959-1994) in fish populations of the Illinois River. Poster presented at the Illinois State Academy of Science Annual Meeting, Charleston, Illinois, 6 October 1995. Lerczak, T.V., R.E. Sparks, and K.D. Blodgett. Long-term trends (1959-1994) in fish populations of the Illinois River with emphasis on upstream-to-downstream differences. Poster presented at the annual meeting of the Mississippi River Research Consortium, La Crosse, Wisconsin, 26-28 April 1995.
55
Michael A. McClelland, Greg G. Sass, Thad R. Cook, Kevin S. Irons, T. Matt O’Hara, Camilla S. Smith, Nerissa N. Michaels, and Mathew R. Stroub. Fifty Years of the LongTerm Illinois River Fish Population Monitoring Program, 1957-2007. Presented at the 46th Annual Meeting of the Illinois Chapter of the American Fisheries Society, Rockford, IL, February 26-28, 2008. Pegg, M.A. and M.A. McClelland. Long-term fish population trends along the Illinois River. Poster presented at the 63rd Midwest Fish and Wildlife Conference, Des Moines, Iowa, December, 2001. Pegg, M.A. and M.A. McClelland. Long-term fish population trends along the Illinois River. Poster presented at the 131st Annual Meeting of the American Fisheries Society, Phoenix, Arizona, August, 2001. V. Popular Presentations Lerczak, T.V. Wintering bald eagles along the Illinois River and factors affecting their environment. Invited presentation to the Peoria Audubon Society, Peoria, Illinois, 8 March 1995. Lerczak, T.V. Seminar on Illinois River environmental issues. Conducted for Biology 140 (Human Ecology) at Spoon River College, 27 June 1994. Lerczak, T.V. A photo trip up the Illinois River. After dinner talk presented to Havana Rotary Club, Havana, Illinois, 17 April 1995. Blodgett, K.D. Ecosystem management for the Illinois River: can biological integrity be restored? Invited lecture for Earth Day celebration at Spoon River College, Canton, Illinois, 19 April 1995. McClelland, M.A. The Long Term Illinois River Fish Population Monitoring Program. After dinner talk presented to Central Christian Men’s 10th Annual Fish Fry, August 2003. VI. Data Requests 1. 2. 3. 4. 5. 6. 7. 8.
Sam Cull, City of Peru, Electrical Department, Peru, Illinois Stanley and Associates, Muscatine, Iowa U.S. Army Corps of Engineers, Rock Island, Illinois Shelly Miller, Aquatic Ecologist, The Nature Conservancy, Peoria, Illinois K. Douglas Blodgett, Project Manager, The Nature Conservancy, Havana, Illinois Kevin Irons, Fishery Biologist, LTRMP, Havana, Illinois Matt O’Hara, Fishery Biologist, LTRMP, Havana, Illinois Scott Langloss, Writer for Adventure Sports Outdoors 56
9. Richard Sparks, Director of Research National Great Rivers Research & Education Center 10. Jim Mick, Illinois Department of Natural Resources 11. James B. McLaren, ASA Analysis & Communication, Inc. 12. Ximing Cai, University of Illinois 13. Rob Maher, Illinois Department of Natural Resources 14. Karen Haggerty, U.S. Army Corps of Engineers 15. Mike Kacinski, EA Engineering
57