Technique for “tuning” vocal tract area functions based on acoustic sensitivity functions (L) Brad H. Storya兲 Speech Acoustics Laboratory, Department of Speech and Hearing Sciences, University of Arizona, Tucson, Arizona 85721
共Received 17 May 2005; revised 17 October 2005; accepted 22 November 2005兲 A technique for modifying vocal tract area functions is developed by using sum and difference combinations of acoustic sensitivity functions to perturb an initial vocal tract configuration. First, sensitivity functions 关e.g., Fant and Pauli, Proc. Speech Comm. Sem. 74, 1975兴 are calculated for a given area function, at its specific formant frequencies. The sensitivity functions are then multiplied by scaling coefficients that are determined from the difference between a desired set of formant frequencies and those supported by the current area function. The scaled sensitivity functions are then summed together to generate a perturbation of the area function. This produces a new area function whose associated formant frequencies are closer to the desired values than the previous one. This process is repeated iteratively until the coefficients are equal to zero or are below a threshold value. © 2006 Acoustical Society of America. 关DOI: 10.1121/1.2151802兴 PACS number共s兲: 43.70-h, 43.70.Bk 关AL兴
Pages: 715–718
I. INTRODUCTION
II. ACOUSTIC SENSITIVITY FUNCTIONS
The shape of the vocal tract can be approximately represented by an area function; that is, the variation in crosssectional area as a function of distance from the glottis. A pattern of acoustic resonances can be calculated based on the shape of any given area function, and will indicate the locations of the formant frequencies that contribute to both phonetic and speaker-specific characteristics. It may be of interest to know how particular changes in the formant frequency pattern could be generated by changes to the shape of the area function, and vice versa. For example, how might an area function for the vowel 关Ä兴 be modified so that the second formant 共F2兲 is increased in frequency while all other formants remain fixed at their original values? Or perhaps the interest may be in altering the area function to generate a particular pattern of the upper formants 共e.g., F3–F5兲 such that a distinct change in sound quality is produced, while F1 and F2 remain fixed. The purpose of this letter is to present a technique that iteratively adjusts 共“tunes”兲 the shape of a given vocal tract area function so that a specific pattern of formant frequencies is produced. The technique is based on perturbing the shape of an initial vocal tract configuration with a summation of scaled acoustic sensitivity functions, such that the formants are systematically displaced toward desired values. Although it is well known that transformation of a set of formant frequencies to a vocal tract area function does not produce a unique solution 共e.g., Schroeder, 1967; Mermelstein, 1967; Wakita, 1973; Atal, Chang, Mathews, and Tukey, 1978; Milenkovic, 1984; Sondhi and Resnick, 1983; Sorokin, 1992兲, the technique described may be useful for generating subtle, hypothetical, modifications to a specific vocal tract shape.
The sensitivity of a particular formant frequency to a change in vocal tract cross-sectional area can be defined as the difference between the kinetic energy 共KE兲 and potential energy 共PE兲 as a function of distance from the glottis, divided by the total energy in the system 共Fant and Pauli, 1975兲. A sensitivity function can be written as
a兲
Electronic mail:
[email protected]
J. Acoust. Soc. Am. 119 共2兲, February 2006
Sn共i兲 =
KEn共i兲 − PEn共i兲 TEn
n = 1,2,3, . . .
and
i = 关1, . . . ,Nareas兴,
共1兲
where i is the section number 共section 1 is just above the glottis and section Nareas is at the lips兲, n is the formant number, and Nareas
TEn =
兺 i=1
关KEn共i兲 + PEn共i兲兴.
共2兲
The kinetic and potential energies for each formant frequency are based on the pressure Pn共i兲 and volume velocity Un共i兲 computed for each section of an area function. They are calculated as KEn共i兲 =
1 l共i兲 兩Un共i兲兩2 2 a共i兲
共3兲
PEn共i兲 =
1 a共i兲l共i兲 兩Pn共i兲兩2 , 2 c2
共4兲
and
where a共i兲 and l共i兲 are the cross-sectional area and length of element i within an area function, respectively, and is the density of air and c is the speed of sound. The area functions used throughout this study contained 44 sections, each with a length of l共i兲 = 0.396825 cm. Hence i = 关1 , . . . , 44兴 and the actual distance from the glottis for each section is x = i · l共i兲.
0001-4966/2006/119共2兲/715/4/$22.50
© 2006 Acoustical Society of America
715
III. AREA FUNCTION PERTURBATION
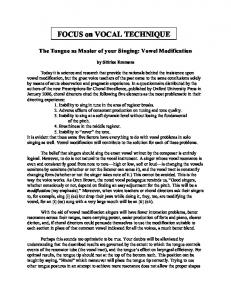
FIG. 1. Sensitivity function calculation for a male 关Ä兴 vowel based on Story, Titze, and Hoffman 共1996兲. 共a兲 Measured area function, 共b兲 sensitivity functions for F1, F2, and F3.
Calculations of pressures, flows, and frequency response functions for this study were accomplished with a transmission-line type model of the vocal tract 共e.g., Sondhi and Schroeter, 1987; Story, Laukkanen, and Titze, 2000兲 that included energy losses due to yielding walls, viscosity, heat conduction, and acoustic radiation at the lips. This particular implementation did not, however, include any side branches such as the piriform sinuses, sublingual cavities, or nasal passages. While it is recognized that these cavities may significantly affect some formant frequencies 共Dang and Honda, 1997; Espy-Wilson, 1992; Makarov and Sorokin, 2004兲, their omission here does not affect the development of the proposed method, nor would it prevent their inclusion in the future. As an example, sensitivity functions were calculated for a male 关Ä兴 vowel based on Story, Titze, and Hoffman 共1996兲 关see Fig. 1共a兲兴 and are shown in Fig. 1共b兲. Each line extends along the distance from the glottis to lips and indicates the relative sensitivity of the first, second, and third formants 共F1, F2, and F3兲 to a small perturbation of the area function 关⌬a共i兲兴. Mathematically, this can be written as, ⌬Fn = Fn
Nareas
兺 i=1
Sn共i兲
⌬a共i兲 , a共i兲
共5兲
where n is again the formant number. Using S1 in Fig. 1共b兲 and Eq. 共5兲 as a guide, it is observed that F1 could be increased by expanding the area in regions along the vocal tract length between 5 cm and 9 cm from the glottis and from 14 cm to the lip termination. F1 could also be increased by constricting the regions between the glottis and 5 cm, as well as between 9 cm and 14 cm. Lowering F1 would require the opposite changes in area within the same regions. For S2, an increase in F2 could be produced by expanding the regions between 4.5– 8.8 cm and 14.8– 17.5 cm, and constricting the regions of the area function that extend from 0 to 4.5 cm and 8.8 to 14.8 cm; lowering F2 would require the opposite changes in area. Changes in F3 could be similarly carried out by modifying cross-sectional areas in the positively and negatively valued regions specified by S3. Although not shown, sensitivity functions corresponding of F4 and F5 were also calculated. 716
J. Acoust. Soc. Am., Vol. 119, No. 2, February 2006
Whereas changes to an area function that would modify formant frequencies according to the calculated sensitivity functions can be performed manually 共e.g., Story, Titze, and Hoffman, 2001兲, an automated process would be more efficient, and ultimately more useful. The proposed technique consists of superimposing scaled 共to affect cross-sectional area兲 replicas of the sensitivity functions on an area function. Direct superposition of S1 for any area function would raise F1, whereas its opposite, −S1, would lower it. F2 could be similarly controlled with superposition of a scaled S2 replica, where +S2 would increase F2 and −S2 would decrease it. Higher frequency formants 共e.g., F3, F4, and F5兲 could also be controlled with superposition of their respective sensitivity functions. Shifting multiple formants simultaneously could be carried out with superposition of the sum of ±S1 , ± S2 , ± S3 , . . . , ± Sn. The prediction of formant frequency change based on sensitivity functions is, however, limited to small area changes 共approximately ⬍10%兲. Thus, sensitivity functions need to be recomputed after any small amount of area change, and a new perturbation determined. This can be performed iteratively until arriving at an area function that produces a desired set of formant frequencies. The process is mathematically represented as, Nfmts
ak+1共i兲 = ak共i兲 +
兺 zn Sn 共i兲
n=1
k
i = 关1,Nareas兴
k
k = 关0,Niter兴.
共6兲
With the initial area function denoted by a0共i兲, the ak共i兲’s and Snk’s are vocal tract area functions and sensitivity functions, respectively, at successive iterations. The coefficients znk scale the sensitivity functions so the area function perturbation displaces the formant frequencies in the desired direction. At every iteration, the znk’s are determined by z nk = ␣
冋 册 F n − F nk F nk
,
共7兲
where Fn is a set of target formant frequencies and the Fnk’s are the formants that correspond to the kth area function. ␣ is an additional scale factor that can be used to speed the iterative process and is typically set to ␣ = 10. The iterations continue until the root of the sum of the squared differences between target formants and those of the kth area function,
␦=
冑兺 共F
n
− F nk兲 2
共8兲
is less than a desired tolerance value. For this study, the iterations were allowed to proceed until ␦ ⬍ 0.1 Hz. To protect against cross-sectional areas becoming too small over the course of successive iterations, the superposition is performed logarithmically for those areas within an area function that are less than 1 cm2 so that Eq. 共6兲 becomes, Brad H Story: Letters to the Editor
冦冉
ak共i兲 +
ak+1共i兲 =
Nfmts
兺 zn Sn 共i兲
n=1
k
k
for ak共i兲 ⬎ 1
冉兺
Nfmts
exp ln共ak共i兲兲 + ln
n=1
znkSnk共i兲 + 1
冊冊
for ak共i兲 艋 1.
冧
共9兲
In addition, a minimum area threshold is set such that, ak+1共i兲 = max关ak+1共i兲,0.1兴,
共10兲
where the 0.1 is in units of square centimeters. It is noted that Carré 共2004兲 proposed a similar iterative technique for modifying the shape of an area function, specifically a uniform tube. His technique was based on using sensitivity functions as deformation patterns, but did not include individual scaling coefficients like the znk’s specified here. Instead, each sensitivity function was always scaled with an amplitude of ±1.0, as well as a “deformability function” that constrained specific regions of the area function. Because of the constraints on the scaling coefficients, Carré’s method apparently does not allow for the specification of a desired formant pattern, but rather modifies the area function successively with constant coefficients to produce a varying formant contour.
To demonstrate the method outlined in the previous section, the area function shown in Fig. 1共a兲 共关Ä兴 vowel兲 was “tuned” in two different ways. In the first example, the second formant was shifted upward in frequency while all other formants 共F1, F3, F4, and F5兲 were held constant at their original calculated values. For the second example, the upper formants were shifted toward each other so that they formed a cluster in the vicinity of about 3000 Hz 关this is a typical frequency range of the “singing formant” 共Sundberg, 1974兲兴.
A. Upward shift of F2
With the 关Ä兴 area function 共Fig. 1兲 serving as the initial vocal tract configuration a0共i兲, the corresponding initial 共calculated兲 formant frequencies were, n = 1,2,3,4,5 共11兲 and the target set of formant frequencies were set to, Fn = 800,1400,2770,3448,4240 Hz
n = 1,2,3,4,5, 共12兲
where only F2 differs from the original formants. Based on Eq. 共7兲, and with ␣ = 10, the initial z coefficients were 共13兲
z10 = 0.0,
冋
z20 = 10
F 2 − F 20 F 20
册冋 =
册
1400 − 1136 = 2.32, 1136
J. Acoust. Soc. Am., Vol. 119, No. 2, February 2006
共15兲
z30 = z40 = z50 = 0.0.
IV. EXAMPLES OF AREA FUNCTION TUNING
Fn0 = 800,1136,2770,3448,4240 Hz,
FIG. 2. Example of area function tuning to produce an upward shift of F2 based on the 关Ä兴 vowel in Fig. 1共a兲. 共a兲 Area function perturbations at the first 共solid兲 and the twentieth 共dashed兲 iterations. 共b兲 Values of the z for the first three coefficients as they converge toward 0.0 over 257 iterations. 共c兲 Initial 共solid兲 and modified 共dashed兲 area functions. 共d兲 Frequency response functions of the initial 共solid兲 and final 共dashed兲 area functions; the vertical lines represent the target formant frequencies.
共14兲
The perturbation pattern imposed on the initial area function at the first iteration is simply 2.32S2 and is plotted as the solid line in Fig. 2共a兲. Note that the y-axis is shown as “⌬ area cm2” to indicate the cross-sectional area that is added to, or subtracted from, the area function and represents ⌬a共i兲 in Eq. 共5兲. The shape of the perturbation will gradually evolve over the course of the iterations to reflect the progressive change in sensitivity of the modified area function. As an example, the perturbation at the 20th iteration is shown as the dashed line. After 257 iterations, ␦ ⬍ 0.1 Hz and the z coefficients corresponding to each formant have converged toward zero as shown for the first three formants in Fig. 2共b兲; the z coefficients for F4 and F5 similarly converge but are not shown in order to preserve the clarity of the figure. The original and final area functions are shown in Fig. 2共c兲, where it can be seen that the tuning process has generated an expansion of the pharyngeal part of the vocal tract, and a reduction of the cross-sectional areas in the oral cavity and just above the glottis. The corresponding frequency response functions are plotted in Fig. 2共d兲 and indicate that the second formant frequency produced by the modified area function is precisely matched to the target frequency of 1400 Hz. The other formants were successfully maintained at their original values. B. Clustering of F3, F4, and F5
A second example of area function tuning is shown in Fig. 3. The initial area function was the same 关Ä兴 vowel used in the first example. As before, the initial calculated formants were, Brad H Story: Letters to the Editor
717
V. DISCUSSION
A technique has been proposed that allows area functions to be modified so that their formant frequencies match a set of targets. In both of the examples, the technique was used to successfully modify an original area function, reducing the difference between a set of original and target formant frequencies to nearly zero. An inherent limitation of the technique, however, is that it is not possible to know if the resulting modifications to an initial area function are those that would actually be produced by a human speaker. Hence, the modifications can only be considered hypothetical. Nonetheless, the ability to systematically perturb an area function such that a desired formant pattern is produced may be a useful tool to help understand how relatively subtle changes in cross-sectional area can produce significant acoustic changes. ACKNOWLEDGMENTS
FIG. 3. Example of area function tuning to compress the distance between F3, F4, and F5, while maintaining F1 and F2 at their original values. 共a兲 Area function perturbations at the first 共solid兲 and the twentieth 共dashed兲 iterations. 共b兲 Values of the z coefficients as they converge toward 0.0 over 403 iterations. 共c兲 Initial 共solid兲 and modified 共dashed兲 area functions. 共d兲 Frequency response functions of the initial 共solid兲 and final 共dashed兲 area functions; the vertical lines represent the target formant frequencies.
Fn0 = 800,1136,2770,3448,4240 Hz,
n = 1,2,3,4,5 共16兲
but the target values were set to be, Fn = 800,1136,2800,3250,3700 Hz,
n = 1,2,3,4,5, 共17兲
which specifies that the distance between the upper formants 共F3, F4, and F5兲 will be decreased. The perturbation pattern at the first iteration is shown in Fig. 3共a兲, and the converging z coefficients for F1, F2, and F3 are plotted in Fig. 3共b兲. In this case, 403 iterations were required so that ␦ ⬍ 0.1 Hz. Shown in Fig. 3共c兲 are the initial and modified area functions. Relative to the initial configuration, the modifications consist of slight constrictions and expansions along the entire vocal tract length. The most apparent changes are in the oral portion of the area function, but the small changes between the glottis and about 8 cm may have also contributed significantly to the acoustic changes. The frequency response functions in Fig. 3共d兲 indicate that the target formant frequencies are achieved with the modified area function. F1 and F2 are the same as in the initial configuration, but F3, F4, and F5 were moved toward each other, and their combined effect produces a somewhat enhanced amplitude in the 2800– 3800 Hz range. It can be noted parenthetically that the cluster of F3, F4, and F5 was produced without any major changes to the length and area of the epilaryngeal portion of the area function. This contrasts with the typical articulatory interpretation of the singing formant 共Sundberg, 1974兲.
718
J. Acoust. Soc. Am., Vol. 119, No. 2, February 2006
This study was supported by Grant No. R01 DC04789 from the NIDCD. Atal, B. S., Chang, J. J., Mathews, M. V., and Tukey, J. W. 共1978兲. “Inversion of articulatory-to-acoustic transformation in the vocal tract by a computer sorting-sorting technique,” J. Acoust. Soc. Am. 63, 1535–1555. Carré, R. 共2004兲. “From an acoustic tube to speech production,” Speech Commun. 42, 227–240. Dang, J., and Honda, K. 共1997兲. “Acoustic characteristics of the piriform fossa in models and humans,” J. Acoust. Soc. Am. 101共1兲, 456–465. Espy-Wilson, C. Y. 共1992兲. “Acoustic measures for linguistic features distinguishing the semivowels/w j r l/ in American English,” J. Acoust. Soc. Am. 92, 736–757. Fant, G., and Pauli, S. 共1975兲. “Spatial characteristics of vocal tract resonance modes,” in Proceedings of the Speech Comm. Sem. 74., Stockholm, Sweden, August 1–3, pp. 121–132. Makarov, I. S., and Sorokin, V. N. 共2004兲. “Resonances of a branched vocal tract with compliant walls,” Acoust. Phys. 50共3兲, 323–330. Mermelstein, P. 共1967兲. “Determination of the vocal-tract shape from measured formant frequencies,” J. Acoust. Soc. Am. 41共5兲, 1283–1294. Milenkovic, P. 共1984兲. “Vocal tract area functions from two-point acoustic measurements with formant frequency constraints,” IEEE Trans. Acoust., Speech, Signal Process., ASSP-32共6兲, 1122–1135. Schroeder, M. R. 共1967兲. “Determination of the geometry of the human vocal tract by acoustic measurements,” J. Acoust. Soc. Am. 41共4兲, 1002– 1010. Sondhi, M. M., and Resnick, J. R. 共1983兲. “The inverse problem for the vocal tract: Numerical methods, acoustical experiments, and speech synthesis,” J. Acoust. Soc. Am. 73共3兲, 985–1002. Sondhi, M. M., and Schroeter, J. 共1987兲. “A hybrid time-frequency domain articulatory speech synthesizer,” IEEE Trans. Acoust., Speech, Signal Process. ASSP-35共7兲, 955–967. Sorokin, V. N. 共1992兲. “Determination of vocal tract shape for vowels,” Speech Commun. 11, 71–85. Story, B. H., Titze, I. R., and Hoffman, E. A. 共1996兲. “Vocal tract area functions from magnetic resonance imaging,” J. Acoust. Soc. Am. 100共1兲, 537–554. Story, B. H., Laukkanen, A.-M., and Titze, I. R. 共2000兲. “Acoustic impedance of an artificially lengthened and constricted vocal tract,” J. Voice 14共4兲, 455–469. Story, B. H., Titze, I. R., and Hoffman, E. A. 共2001兲. “The relationship of vocal tract shape to three voice qualities,” J. Acoust. Soc. Am. 109, 1651– 1667. Sundberg, J. 共1974兲. “Articulatory interpretation of the singing formant,” J. Acoust. Soc. Am. 55, 838–844. Wakita, H. 共1973兲. “Direct estimation of vocal tract shape by inverse filtering of acoustic speech waveforms,” IEEE Trans. Audio Electroacoust. AU-21共5兲, 417–427.
Brad H Story: Letters to the Editor