Techniques to Synchronize and Align Driving Simulator Data Kari Torkkola, Bob Leivian, Noel Massey, Chris Schreiner, Mike Gardner, and John Summers Motorola Labs, MD DW286 2900 South Diablo Way Tempe, AZ 85282 USA Email:
[email protected]
Abstract We describe techniques used to overcome issues encountered in collecting and aligning driving simulation data recorded from multiple devices. Driving simulators offer the ability to monitor the driver, vehicle, and environment in situations and in detail that are impractical for roadway vehicles, but the data is often collected from various independent asynchronous data recording devices. Even when all subsystems properly collect data there exists a high degree of probability that the various data files will not be time aligned, thus resulting in misinterpretation of the data which then results in faulty conclusions about driving behavior or algorithms. We describe a data synchronization mechanism and a multistage alignment process whereby data from various subsystems is aligned in a two step process: rough alignment and then optimal alignment within milliseconds. Optimal alignment uses a variation of the dynamic time warping (DTW) algorithm resulting in a single data file (plus video). We present results of the alignment process on driving simulator data and also describe an automated data validation technique to ensure the integrity of collected data.
353
DSC 2005 North America - Orlando - November 2005
The Motivation for Driving Simulator Data Driving simulator data is critical to the development of future smart automobile systems. Automotive workload managers and other context aware driver assistance systems need to infer the state of the current traffic or the driving situation and the state of the driver. There are at least two approaches to construct such a system. The first is more or less heuristic; coding rules of thumb that map the car sensor readings into some meaningful driving states. While this may result in a usable system, the scope of such an approach is limited. Covering many situations becomes tedious, and plain common sense is often insufficient to adequately describe the situation. The second approach, which we advocate, is deriving these context aware driver assistance systems directly from collected sensor data using statistical machine learning techniques [1,2]. For example, learning to classify different driving situations requires collecting sensor data of those situations, training or learning models of the situations from the data, and then classifying incoming new sensor data streams using the models. This approach parallels the development of automatic speech recognition systems, which did not become possible until large public databases were collected and data-driven methods were applied to model the speech signal [3]. There are two approaches to collecting large databases of driving sensor data from various driving situations. One can outfit a fleet of cars with sensors and data collection equipment, as done in the NHTSA 100 car study [4]. This has the advantage of being as naturalistic as possible. However, disadvantages are that potentially interesting driving situations will be extremely rare and collected data will be limited to the state of sensor technology at the time. Realistic driving simulators provide much more controlled environments for experimentation. Furthermore, in a driving simulator, it is possible to simulate a large number of potential advanced sensors that would be too expensive or impossible to install in a real car yet. This will also enable us to study what sensors really are necessary for any particular task and what kind of signal processing is needed for those sensors [5]. A further advantage of such a collected database is its potential to produce statistical insight to normal driving. One aim is the discovery of unexpected relationships from the driving data using typical data mining tools. Not only the amount of data, but also the richness of the sensor set will make this feasible. We call this kind of data "hypervariate". This paper concentrates on the issues in collecting the data from a driving simulator. First we describe our simulator environment and its various subsystems. We outline the details and issues in data synchronization and alignment in order to create useful databases. Finally, we briefly describe data annotation, which is a necessary step in making the data useful for machine learning. Driving Simulator as a Data Source We collect data in a driving simulator lab, which is an instrumented car in a surround video virtual world with full visual and audio simulation (although no motion or G-force simulation) of various roads, traffic and pedestrian activity. The driving simulator
354
DSC 2005 North America - Orlando - November 2005
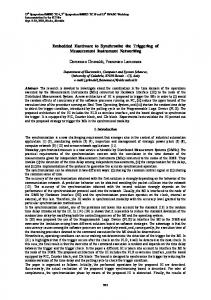
consists of a fixed based car surrounded by five front and three rear screens. All driver controls such as the steering wheel, brake, and accelerator are monitored and affect the motion through the virtual world in real-time. Various hydraulics and motors provide realistic force feedback to driver controls to mimic actual driving. The basic driving simulator software is a commercial product by DriveSafety with a set of simulated sensors that, at the behavioral level, simulate a rich set of current and future onboard sensors in the near future. This set consists of radar for locating other traffic, a GPS system for position information, a camera system for lane positioning and lane marking, and a mapping data base for road names, directions, locations of points of interest, etc. There is also a complete car status system for determining the state of engine parameters (coolant temp, oil pressure, etc.) and driving controls (transmission gear selection, steering angle, window and seat belt status, etc.). An expanded set of sensors is provided by the Driver Advocate (DA) subsystem. DA is a software state machine and a set of virtual sensors that monitor the virtual world of a DriveSafety driving simulator. The DA constantly monitors the environment, car position, traffic situation and gives ‘advice’ to the driver in real-time about ‘problems’ in that environment. This is facilitated through custom software, DA Sensor Protocol, (DASP) which interfaces to the DriveSafety simulator’s virtual world. DASP is an efficient means to gather only the relevant positional and traffic data feedback from the simulator necessary to determine the appropriate DA advice to the driver. This advice is output through another set of customized interface software using audio, visual and/or tactile feedback. The style and presentation of this feedback is based on the individual driver’s preferences and learned habits. It is designed to inform the driver of problem situations and to elicit a desired response. For example, if the driver is too close to the car in front, a ‘virtual brake light’ could be flashed in the virtual conformal Heads Up Display (DA HUD). DA HUD is more custom software that allows the visual alerts of DA to be presented on the DriveSafety simulator screen in the correct visual perspective view of the driver to the virtual world in front. In addition, our simulator setup also has several video cameras, microphones and a SeeingMachines infrared eye/head tracker to record all driver actions during the drive that is synchronized with all the sensor output and simulator tracking variables. Altogether there are 425 separate variables describing an extensive scope of driving data - information about the car, the driver, the environment, traffic, and associated conditions. An additional screen of video is digitally captured in MPEG2 format, consisting of a quad combiner providing four different views of the driver and environment (See Fig. 1). Combined, these produce around 400Mb of data for each 10 minutes of drive time. This allows a complete analysis of virtually everything that occurs during a drive.
355
DSC 2005 North America - Orlando - November 2005
Figure 1. An example of captured video.
Data Alignment and Synchronization Each experiment collects data from the three major subsystems plus video running on separate computers. The subsystems are 1) Driver Advocate, 2) the DriveSafety simulator, and 3) the SeeingMachines eye/head tracker. All these independent data recording devices are running asynchronously. These subsystems may improperly record data due to a variety of reasons, and it is costly in terms of subject time, experimenter time, simulator time, and potentially financial resources to run a series of experiments which result in unusable data. Even when all subsystems properly collect data there exists a real problem that the interpretation of this data depends on the ability to time align the various data files. Thus synchronization and alignment of data is essential. Subsystem Alignment Collecting simulated driving data involves collecting data from many sensors, various systems, and a mixture of real and simulated input at many different sampling rates. This requires a system for converting data to a common format, and a method for time aligning data samples from all three data collection subsystems. The first step in using any collected data is to either write/buy a large set of tools to handle each input source to do all this, or write a single tool set with a set of converters for all input sources. We chose the latter, creating in-house a tool that accomplishes data alignment and synchronization. This requires a common data format. We chose an event stream based format rather than the fixed sampling rate or spreadsheet model to allow more generality and smaller file sizes. With an event stream model (individually time-stamped, above threshold value changes) all information is preserved and it is easy to resample at any given rate if needed. This is particularly helpful in aligning simulated data with real world data which is typically asynchronous with varying propagation delay.
356
DSC 2005 North America - Orlando - November 2005
By sending a ‘sync’ command to all subsystems at various times during the experiment, rough alignment can be achieved during the process of converting the data to a common form. The rough alignment is accomplished by first assuring that the individual data capturing elements are running a clock synchronization utility (such as NTP), then choosing a single element to be the master clock. While this should theoretically provide a high degree of time alignment as long as the real time clock from the data capturing element is in fact synchronized with the master clock, there are several real world issues that limit this capability. Among these issues are the lack of a real time clock or a suitable clock synchronization capability in a data capturing element, network or other propagation delays, and the potential for software elements beyond our control to not use or improperly use the system clocks. We have attempted to mitigate some of these issues by working with the subsystem vendors whenever possible to provide appropriate real time stamping of data files, and by inserting our own timestamps or artifacts into the data files during the ‘sync’ command. The capability to add these ‘sync’ events at the beginning and end of the data capture session, and also periodically during the session provides a reasonable foundation for the finer time alignment procedures discussed next. Dynamic Time Warping (DTW) For many data analysis techniques there is the need to normalize the rate fluctuations of variables in order to synchronize and compare them in a time coherent way. For subsystems that share common variables, such as the Driver Advocate and Simulator both recording vehicle speed, it is occasionally the case that the values of the common variables differ due to varying time delays in the data collection systems. These time delays may be caused by hardware processing limitations (‘real-time’ systems occasionally becoming overburdened thereby producing non-real time results) or network protocols that have various tolerances for information delay. For example, we discovered that the simulator may lose frames in computationally intensive traffic situations and fails to adjust the frame time stamp accordingly. This results in a file shorter in time compared to data collected from other subsystems. Since these lost frames occur in bursts, it is not possible to just linearly adjust the duration of the file. In order to perform a fine-grained non-linear time alignment we resample all data at a common sampling rate and then use the well known technique of Dynamic Time Warping (DTW) [6]. DTW searches the space of mappings from the time sequence of the input stream to that of the reference stream, so that the total distance is minimized. This is illustrated in Figure 2. DTW thus allows the normalization of sequential variable patterns to a common time index, and compensates for both inaccuracies in our rough subsystem alignment, and for delays incurred by the data collection processes. We chose to use the system clock on the Driver Advocate subsystem as the reference stream, because the Driver Advocate system was designed in-house, was the least computationally intensive of the three subsystems and therefore less likely to encounter time delays caused by processing issues, and because Driver Advocate can be used to capture and process data from real-world environments.
357
DSC 2005 North America - Orlando - November 2005
Figure 2. Illustration of the Dynamic Time Warping. Two sequences, test and reference, are aligned so as to minimize the sum of distances along the alignment path.
What makes the alignment possible is the fact that we have some common variables both in DA and Simulator files. The set of those common variables in the DA file becomes the "reference" stream, and the same variables in the Simulator file become the "test" stream that is aligned to the reference. Since collected files may be long in duration, it was necessary to modify the standard DTW for block-by-block operation. The modified DTW aligns a block of fixed length of data first, then backs off a little, aligns the next block, and so on. The same procedure is applied to common variables between SeeingMachines log file and the DA file. This blockwise alignment is illustrated in Figure 3. Scrubbing After the Simulator and Eye-Tracker event streams are aligned to the DA stream by DTW, a heuristic set of scrubbing and ‘sanity checks’ can be preformed to detect and possibly correct various undesired sensor behaviors. Typical undesired behaviors include sensor drifts due to aging or temperature, constant ‘stuck at’ values, oscillatory values, and missing data due to either faulty connection to the sensor or faulty data collection tools. We created a parameter validation table whereby each parameter represents a row and each column represents a validation type (such as maxValue, minStandardDeviation, etc). The validation types are currently simple statistical measures, though it is conceivable that they could be used to specify parameters for more sophisticated models such as those based on clustering or prediction algorithms. If a parameter does not have a meaningful validation value then that cell in the table can be left empty. We created tools
358
DSC 2005 North America - Orlando - November 2005
Figure 3. Blockwise alignment of long data files. Vertical axis (from bottom to up) is time in the reference data (DA), horizontal axis (left to right) is time in the Simulator data. Color code illustrates the Euclidean distance between samples, dark color denotes small distance, and shades from red to yellow to white denote increasing distance. DTW attempts to find an alignment path as "dark" as possible through this distance matrix (Insert in bottom right is enlargement of a single block showing DTW alignment path). to read this table and ensure that any given data set does not violate any of the validation parameters listed in the table. These ‘sanity checks’ can be performed immediately after an experiment has concluded and can provide early alerts of system malfunctions or improper configurations before additional experimenter and subject time is wasted due to inadequate data collection. In addition to the automatic validation of the data we visually inspect the data to ensure its integrity. The visual inspection involves plotting the time series data, looking at histograms of data and possibly inspecting frequency analyses of the data. This step is included in the data collection process since appropriate visualization of the data can lead to rapid detection of gross errors that might be difficult to automatically detect, such as intermittent oscillations.
359
DSC 2005 North America - Orlando - November 2005
Anomaly detection At this point in the process all of the data is now aligned and synchronized. Additionally, we have validated that the values and several statistics of the data are within acceptable ranges. We now can run various physics models and other behavior-based models to validate that the sensors are only giving us changes that are physically possible. These models are typically more complex than the generic data scrubbing techniques and also require specific domain knowledge. These models are built both on an understanding of vehicle dynamics (minimum turning radius, relationship of brake pedal position to deceleration, conservation of momentum) and of human movement (eye position constrained by head angle, normal rates of steering wheel movement). Data annotation The data is now ready to be used, either for data mining or machine learning purposes. We describe now briefly the additional steps necessary to make the data useful for machine learning purposes. We developed a special purpose data annotation tool for the driving domain. This was necessary because available video annotation tools do not provide a view of the sensor data, and tools meant for signals, such as speech, do not allow simultaneous and synchronous playback of the video. The purpose of the data annotation tool is to manually label the sensor data with meaningful classes. Supervised learning and modeling techniques then become available with labeled data [7]. Our annotation tool provides an easy to use interface for annotating the data. The major properties of the tool are 1. Ability to navigate through any portion of the driving sequence. 2. Ability to label (annotate) any portion of the driving sequence with proper time alignment 3. Synchronization between video and other sensor data (note that the earlier alignment and synchronization efforts did not include the video) 4. Ability to playback the video corresponding to the selected segment 5. Ability to visualize any number of sensor variables. 6. Providing persistent storage of the annotations 7. Ability to modify existing annotations Since manual annotation is a tedious process, we are working on automating parts of the process by taking advantage of classifiers trained for various driving maneuvers [8]. Annotation becomes then an instance of active learning [9]. Only if a classifier is not very confident in its decision, its results are presented to the human to manually verify.
Conclusion A description of techniques used to overcome issues encountered in collecting and aligning driving simulation data recorded from multiple devices has been given. Described are a data synchronization mechanism and a multistage alignment process whereby data from various subsystems is aligned in a two step process: rough alignment
360
DSC 2005 North America - Orlando - November 2005
and then optimal alignment within milliseconds. The optimal alignment uses a variation of the dynamic time warping (DTW) algorithm resulting in a single data file (plus video). Presented are the results of the alignment process on driving simulator data and also describe an automated data validation technique to ensure the integrity of collected data. Thus misinterpretation of the data and faulty conclusions about driving behaviour or algorithms can be avoided.
References 1. 2.
3. 4.
5.
6.
7.
8.
9.
T. Mitchell, Machine Learning, McGraw-Hill, Boston, 1997 K. Torkkola, R. M. Gardner, C. Wood, C. Schreiner, N. Massey, B. Leivian, J. Summers, S. Venkatesan, “Toward Modeling and Classification of Naturalistic Driving Data”, 2005 IEEE Intelligent Vehicles Symposium, Las Vegas, NV, U.S.A., June 8, 2005. L. R. Rabiner, “A tutorial on Hidden Markov Models and Selected Applications in Speech Recognition,” Proceedings of the IEEE, 1989. V. L. Neale, S. G. Klauer, R. R. Knipling, T. A. Dingus, G. T. Holbrook, and A. Petersen, " The 100 Car Naturalistic Driving Study: Phase 1- Experimental Design", NHTSA Interim Report, Performed by Virginia Tech Transportation Institute, Contract No: DTNH22-00-C-07007, Washington D.C., November 2002, DOT HS 809 536. K. Torkkola, S. Venkatesan, and H. Liu. Sensor selection for maneuver classification. In Proceedings of the 7th Annual IEEE Conference on Intelligent Transportation Systems (ITSC 2004), Washington, D.C., USA, October 3-6 2004. C. S. Myers and L. R. Rabiner. A comparative study of several dynamic timewarping algorithms for connected word recognition. The Bell System Technical Journal, 60(7):1389-1409, September 1981. K. Torkkola, N. Massey, and C. Wood, Driver inattention detection through intelligent analysis of readily available sensors. In Proceedings of the 7th Annual IEEE Conference on Intelligent Transportation Systems (ITSC 2004), Washington, D.C., USA, October 3-6 2004. K. Torkkola, N. Massey, B. Leivian, C. Wood, J. Summers, and S. Kundalkar. Classification of critical driving events. In Proceedings of the International Conference on Machine Learning and Applications (ICMLA), pages 81–85, Los Angeles, CA, USA, June 23 - 24 2003. D. Cohn, L. Atlas, and R. Ladner. Improving generalization with active learning. Machine Learning, 15(2):201–221, 1994.
361