Decision criteria for technology usage behavior
Technology Adoption vs. Continuous Usage Intention: do Decision Criteria Change when Using a Technology? Full paper
Anna Kupfer University of Bamberg
[email protected] Samuel Schöb University of Bamberg
[email protected]
Liliane Ableitner ETH Zurich
[email protected] Verena Tiefenbeck ETH Zurich
[email protected]
Abstract Various models in Information Systems (IS) research seek to understand why individuals embrace or resist the adoption or use of a technology. Different models analyze the factors shaping user intentions at different stages of technology adoption and use. Yet, less is known how the factors shaping adoption intention subsequently evolve into continuous usage intention as users become (more) familiar with the technology. This paper investigates participants’ (N=549) adoption and continuous usage intention of a smartphone application for energy efficiency twice: at two different stages of experience, but for the same technology, in the same setting, and in particular with the same sample. In both cases, we use the Unified Theory of Acceptance and Use of Technology (UTAUT1&2). While UTAUT explains adoption intention well, we find only moderate support for continuous usage intention. In line with prior research, our data suggests that beliefs are updated from adoption to continuous usage stage. Keywords Green IS, UTAUT, adoption intention, continuous usage intention, decision criteria, smartphone applications, energy efficiency
Introduction and Context IS can inform both management and individual decisions by providing information on a large scale “about causes and effects, and knowledge sharing about what works, what doesn’t, and why” (Melville 2010, p. 2). The success or failure of an IS artefact depends on whether consumers resist to use it or are willing to adopt, and to engage with it (Anda and Temmen 2014). IS research has developed various models to understand the factors that drive consumers either to resist a technology (e.g., Kim and Kankanhalli 2009) or to adopt (e.g., Venkatesh et al. 2003) and continuously use it (e.g., Bhattacherjee and Lin 2015). In particular, research on technology acceptance has become one of the most mature domains of IS research (Venkatesh et al. 2012; Williams et al. 2009). Yet, each of the adoption, resistance, or continuous usage models collects a mere snapshot of consumer perspectives at a particular stage of user exposure to a technology. Existing studies have investigated either adoption or continuous usage behavior – or technology resistance at a particular stage of experience. The results of those snapshots reveal that the barriers and drivers of IS adoption are different from those of continuous usage of a technology (Bhattacherjee and Lin 2015). Yet, relatively little is known about the extent to which the determinants of adoption intention also predict continuous usage of the same technology in the same setting by the same individuals. This article aims to shed light on these questions by evaluating a) adoption intention and b) continuous usage intention of a sustainability smartphone app at two different instances of time: prior and subsequent to the actual usage of the IS. As a theoretical framework, we make use of the two versions of the Unified Theory of Acceptance and Use of Technology – UTAUT1 introduced by (Venkatesh et al. 2003) and its extension UTAUT2 (Venkatesh et al. 2012). While the UTAUT1 has originally been developed to explain adoption intention in an organizational context, its extension UTAUT2 was primarily designed to investigate continuous usage intention on consumer level. We conducted a field study with 637 Dutch households. In
Twenty-second Americas Conference on Information Systems, San Diego, 2016
1
Decision criteria for technology usage behavior
the course of the study, the participants had the possibility to use a sustainability smartphone app that visualizes energy and water consumption over time. Prior to the app release, an online survey briefly introduced the basic functionality of the app and collected participants’ intention to adopt the smartphone app. A second survey conducted one month after the app release assessed participants’ intention to continue using the smartphone app. In both survey waves, participants rated their agreement with statements related to the UTAUT constructs. Our paper expands current research in three ways: First, we evaluate participants’ usage intention at two different stages of experience with the technology: before and after having used it for a month. We apply UTAUT as theoretical framework, as it allows the explanation of both intentions with the same construct. To the best of our knowledge, we are the first scholars to examine both, adoption and continuous usage intention of the same technology in the same setting with the same sample, at least in the domain of green IS. Second, we observe changing patterns in the motivational factors to adopt and continuously use a sustainability app in this context. Third, we collect our data in a large-scale, actual operative setting involving regular users (not a student sample).
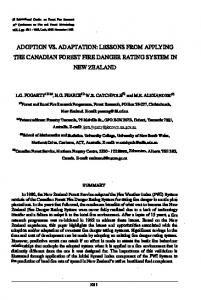
Related Work and Research Questions Most technology acceptance models are based on a simple concept from psychology: beliefs and attitudes about a certain technology largely determine the behavioral intention (BI) to use it, which in turn influences actual usage behavior (Ajzen 1985; Fishbein and Ajzen 1975). IS research distinguishes between adoption intention (first-time usage of an IT innovation) and continuous usage intention (of a previously used and therefore already familiar technology). For both types of intentions, various explanatory models exist. Among the most prominent models, the Technology Acceptance Model (Davis et al. 1989) and the Model of Adoption of Technology in Households (Brown and Venkatesh 2005) predict technology adoption, whereas other theories explain continuous usage intention (Bhattacherjee 2001; Bhattacherjee and Lin 2015; Kim and Malhotra 2005). Most prior studies have investigated either adoption of a new IS or continuous usage behavior of a familiar IS, yet the connection between the two intentions and their motivation are less understood. In fact, dynamics of intentions are evaluated by Kim and Malhotra (2005), yet only for dynamic changes within continuous usage intention. Karahanna et al. (1999) use a sample of potential users and compare the beliefs affecting their adoption intention with the beliefs affecting usage intention among a (different) sample of actual users (early adopters). Yet the study does not reveal whether differences in the importance of those factors are due to individuals updating their beliefs and preferences with experience with the technology or due to differences between the sample of early adopters and the sample of not-so-early/not-yet adopters. So far, we are not aware of studies exploring adoption and continuous usage intention for the same technology at two different stages of experience with the same sample. A model that allows explaining both intentions with same influencing factors is UTAUT: UTAUT1 identifies four determinants of adoption intention, while its extension UTAUT2 explains continuous usage with the help of three additional elements/constructs. Figure 1 visualizes both models (dashed lines for UTAUT1, straight lines for UTAUT2). All constructs are briefly explained in the following: Behavioral Intention (BI) - BI measures user’s self-rated likelihood to perform a particular behavior in the future: the original UTAUT literature measures adoption intention with UTAUT1 and continuous usage intention with UTAUT2. BI is the main predictor of technology usage behavior. Performance Expectancy (PE) - The first key determinant is PE defined as “the degree to which an individual believes that using the system will help him or her to attain gains in job performance” (Venkatesh et al. 2003, p. 447). PE is positively correlated with BI and usually its strongest predictor. Effort Expectancy (EE) - The second predictor of technology acceptance is EE defined as “the degree of ease associated with the use of the system” (Venkatesh et al. 2003, p. 450). In other words, EE can be seen as the individual’s belief about the effort of learning how to use the new technology. EE is negatively correlated with usage intention. Social Influence (SI) - The construct SI is defined as “the degree to which an individual perceives that important others believe he or she should use the new system” (Venkatesh et al. 2003, p. 451). The perceived social pressure or the status conveyed from using a technology can considerably manipulate the individual in using a technology: BI increases with a higher SI.
Twenty-second Americas Conference on Information Systems, San Diego, 2016
2
Decision criteria for technology usage behavior
Facilitating Conditions (FC) - The fourth key determinant FC is defined as “the degree to which an individual believes that an organizational and technical infrastructure exists to support use of the system” (Venkatesh et al. 2003, p. 453) and assistance in using the system (assisting supervisor, external help desk, etc.). FC exert a positive influence on BI.
Figure 1: The Unified Theory of Acceptance and Use Hedonic Motivation (HM) - The first new construct that the UTAUT2 introduces is HM, which is defined as “the fun or pleasure derived from using a technology” (Venkatesh et al. 2012, p. 161). Especially in consumer context the enjoyment of using a technology is crucial, as the individual performs the technology adoption in self-will. Venkatesh et al. (2012) find a strong positive correlation between HM and BI. Price Value (PV) - The UTAUT2 considers the acquisition costs of technology in the consumer context, as users bear the expenses themselves. Venkatesh et al. (2012) propose the additional key determinant PV defined as the “consumers’ cognitive tradeoff between the perceived benefits of the application and the monetary costs for using them” (p. 161) and describe a positive correlation between PV and BI. Habit (HA) - Another construct presented by the authors of UTAUT2 is habit (HA) defined as “the extent to which people tend to perform behaviors automatically because of learning” (Venkatesh et al. 2012, p. 161). HA can directly influence both BI and usage.
Research Gaps and Research Questions A brief literature review of existing UTAUT research shows that many studies focus on hypothetical questions explaining the adoption intention of fictive technologies that are not being used later on (e.g., Lai and Lai 2014). Indeed, this approach is useful to validate the measurement scales; yet, it remains unclear to what extent UTAUT constructs predict actual behavior in the long run. Given that existing studies test adoption and continuous usage intention of different technologies in different settings and with different models, a straight comparison of motivational factors is typically not possible. As “IT acceptance and continuance are conceptually and temporally distinct behaviors” (Bhattacherjee and Lin 2015, p. 364) we conjecture that in an early stage of experience with the technology (e.g. when the individual is completely unfamiliar with the technology), other decision criteria are relevant than in later stages of experience shaping the intent to continue using the technology (Arts et al. 2011; Bhattacherjee and Lin 2015; Kim and Malhotra 2005; Premkumar and Bhattacherjee 2008). This leads us to our principal research question: To what extent do decision criteria for adoption intention differ from those for continuous usage intention at a later stage of experience (for the same individuals)? When directly comparing the two models for adoption and continuous usage, however, one might argue that differences in the results will obviously arise simply from the fact that two different models are being
Twenty-second Americas Conference on Information Systems, San Diego, 2016
3
Decision criteria for technology usage behavior
used. To compare apples with apples, we examine both, adoption intention and continuous usage intention, twice, once using UTAUT1 and once using the UTAUT2. Despite of the fact that both of the intentions are usually tested with one particular version of UTAUT, research practice shows that this boundary is not that strict: While some studies apply UTAUT1 to explain adoption intention (Lai and Lai 2014), others use the model to predict continuous usage intention (Al-Gahtani et al. 2007). Similarly, UTAUT2 is used for both, adoption intention (Oliveira et al. 2014) and continuous usage intention (Lai and Shi 2015). Therefore, we collect user perceptions of all UTAUT constructs before and after experience with the IS artefact. To the best of our knowledge, no study has been conducted so far that evaluates adoption intention and continuous usage intention of an IS artefact at two instances of time, i.e., for the same technology, in the same setting, and with the same sample. That comparison makes it possible to analyze how the impact of the factors influencing adoption and continuous usage decisions evolves as users gain experience with the IS.
Methodology In order to answer these research questions, we conducted a large field experiment with 637 Dutch households starting in August 2015. Participating households were recruited in cooperation with a local utility company. The utility company sent out one-page leaflets to customers and employees inviting them to participate in an energy efficiency study. The leaflet informed them that water heating is the second-largest residential energy end use, accounting for 14-18% of the final energy use in households in the U.S. and in Europe (eia 2013; Prognos 2013). The leaflet further explained that study participants would receive for free a smart shower meter that tracks their energy and water consumption in the shower along with a smartphone app. The smart shower meter by itself displayed the current energy and water use during the shower during three months. In the current study, the hardware was for the first time accompanied by a smartphone app that visualizes summary statistics and time trends. During the last month of the study, the participants were invited to use the app to upload the data recorded by the smart shower meter, to access summary statistics, and visualize their energy and water consumption over time (see Appendix 1). Figure 2 gives an overview on the study timeline. In the online survey prior to the study (survey 1), we described the app functionality and collected participants’ expectations of the app and their intended and anticipated usage of the app. None of the participants was familiar with the technology when they answered survey 1. Survey 2 (at the end of the three-month study) asked the participants if they had used the app; if that was the case, the survey asked about their beliefs and attitudes towards the app and their intention to continue using the app after the study. The survey questions (see Appendix 2) were based on the scales validated by Venkatesh et al. (2012, 2003) and used 7-point Likert scales. Due to the novelty of both, the smart shower meter and of the accompanying app, for some questions, we had to deviate from the original wording and substitute some items (e.g., “I know how to use this technology”) with questions on general dispositions (e.g., “I know how to install apps”). We will return to this point in the analysis of the measurement model.
Figure 2: Study timeline While survey 1 items assessed the UTAUT hypotheses regarding participants’ intent to adopt the app, survey 2 items tested the UTAUT hypotheses on participants’ intent to continue using the app. As mentioned before, in most cases, UTAUT1 is used to examine adoption and UTAUT2 to assess continued usage of a technology. As we calculate both intentions with both models in order to conduct a thorough comparison, we end up with a 2x2 matrix of analysis: (adoption vs. continuous usage intention) x (UTAUT1 vs. UTAUT2). Overall, we test 22 sub-hypotheses. Hypotheses identifiers in the following paragraphs relate to adoption intention (A) or continuous usage intention (C), UTAUT1 (1) or UTAUT2 (2) and the constructs (PE, EE, etc.). For instance, H.A1PE: ex-ante PE has a positive effect on the adoption intention applying UTAUT1; …; H.C2HA: ex-post HA has a positive effect on the continuous usage intention applying UTAUT2. Regarding the comparison of ex-ante and ex-post determinants, we further hypothesize that EE and FC weaken
Twenty-second Americas Conference on Information Systems, San Diego, 2016
4
Decision criteria for technology usage behavior
with advanced stages of experience: once individuals have started using a technology, they have already made the biggest efforts to familiarize themselves with the technology (H1). Regarding the effects of PE and HM, we expect their importance to increase from adoption intention to continuous usage intention: once individuals have gained some experience with a technology, they will mainly continue using it if they derive added value and enjoyment from it (H2).
Data Analysis and Results Altogether, we received 637 answers to survey 1 and 538 answers to survey 2. For data analysis, we used Stata/SE 14.0. Two major reasons induced exclusions from the data set: invalid answers and incomplete data (resulting in 549 responses for survey 1 and 486 for survey 2, respectively). When comparing intention of adoption and of continuous usage, we needed to restrict our sample to those participants who had used the app in its full functionality. This left us with 215 participants who had a) filled out both surveys and b) who had used the app. This subset allowed for a fair comparison of adoption intention and continuous usage intention. Obviously, excluding participants who did not use the app could potentially introduce a selection bias. For that reason, we evaluated the model for adoption intention (based on survey 1) twice: once on the full sample of valid responses to survey 1 (N=549) and once only on the subset of app users (N=215). We will return to this point in the discussion of the results presented in Table 2 and Table 3. UTAUT data is typically analyzed in two separate steps: first, the measurement model tests the data for convergent and discriminant validity to ensure data quality. Second, the structural model analyzes the relationships between the constructs as hypothesized. In the first step regarding the measurement model, we analyzed Cronbach’s alpha values to assure reliability of constructs (see Table 2). With values of .6288 and .3345, SI and HA did not meet the recommended threshold of .7 and therefore had to be dropped in the following (Cronbach 1951; Gefen et al. 2000). All other constructs, however, exceeded the reliability threshold and were further examined. In a next step, we tested for convergent and discriminant validity of items. To that end, we conducted a principal component analysis to identify items that statistically belong together and to pooled them to the latent UTAUT constructs. Table 1 presents cross loadings of items explaining adoption intention in UTAUT2. All items load on the associated components of more than .4, the recommended threshold in IS research (Straub et al. 2004); cross loadings do not exceed this threshold. The Kaiser-Meyer-Olkin index (KMO), which examines whether the data is suitable for this approach at all, reveals a value of .8761. Thus, it scores above the recommended threshold of .5 and can is suitable for principal component analysis (Beavers et al. 2013). The final step of the measurement model tests for discriminant validity. We used Pearson’s correlation tests, in which interdependencies between constructs should not exceed .7 (Dormann et al. 2013). The analysis of our data shows acceptable values for all pairwise correlations. Only PE and HM correlate highly (r=.7803, p < .000); however, as the regression estimation later on will show, multicollinearity issues resulting from this high interdependency do not occur. Conclusively, discriminant validity is assured (the full table cannot be presented here for space constraints and is available upon request). 1
2
3
4
5
6
PE1
-0.0364
-0.0456
0.7041
0.0146
-0.0141
0.0547
PE2 EE1
0.0117
0.0457
0.6832
-0.0084
0.0308
-0.0634
0.0251
0.6566
0.1210
-0.0218
-0.0256
-0.0840
EE2
-0.0115
0.7087
-0.0980
0.0273
0.0013
0.0850
FC1
0.0464
-0.1461
0.0535
0.0075
0.7347
0.0354
FC2
-0.0475
0.1641
-0.0510
-0.0087
0.6766
-0.0250 0.8002
HM1
-0.0371
-0.0131
-0.0275
-0.0027
0.0212
HM2
0.0571
0.0759
0.0693
-0.0081
-0.0241
0.5722
PV1
0.0106
0.0673
0.0124
0.7094
-0.0036
-0.0706
PV2
-0.0103
-0.0575
-0.0054
0.7036
0.0044
0.0641
BI1
0.7280
0.0233
-0.0438
-0.0067
0.0037
-0.0252
BI2
0.6776
-0.0190
0.0238
0.0089
0.0064
0.0054
Table 1: Cross loadings of items explaining adoption intention in UTAUT2 We carried out the same approach for both intentions in both UTAUT models. Overall, the results pass the recommended thresholds. As mentioned above, to verify whether our smaller sample of actual app users is subject to selection bias, we calculated the model for adoption intention both, on the full sample of 549 households (1st column) and on the smaller sample of 215 app users (2nd column). As Table 2 shows, the regression coefficients are almost identical between the two samples; only a single item, HM2, exhibits a
Twenty-second Americas Conference on Information Systems, San Diego, 2016
5
Decision criteria for technology usage behavior
change worth mentioning. The overall model, however, does not change: we can thus infer that our model is robust to the particular sample selection and that the focus on the technology users does not bias the results in any meaningful way. Table 2 presents Cronbach’s alpha values, the main loadings of the principal component analysis, and the KMO index (due to space restrictions, cross loadings and pairwise correlations cannot be displayed). Cronbach’s alpha values are the same ones in UTAUT1 and UTAUT2. The third column of Table 2 displays the results for continuous usage intention. While the principal component analysis delivers good results for UTAUT1, we find that in UTAUT2, HM items load on the same factors as PE (°) and EE (°°). This is somewhat surprising, given that the same items loaded differently prior to the use of the technology. Overall, all constructs apart from SI and HA pass the measurement model’s tests and can be further examined in the structural model. The structural model examines the relationships between constructs.
Sample
ADOPTION INTENTION Main loading Main loading Cronbach's Main loading Main loading Cronbach's in UTAUT1 in UTAUT2 alpha in UTAUT1 in UTAUT2 alpha Full sample (N=549) User sample (N=215)
CONTINUOUS USAGE INTENTION Main loading Main loading Cronbach's in UTAUT1 in UTAUT2 alpha User sample (N=215) 0.5993
0.4762°
0.7570
0.6888°
0.5880
0.8371°
0.8019
0.9562°°
0.7046
0.6864
0.6941
0.7212
PE1
0.7420
0.7041
PE2
0.6581
0.6832
EE1
0.6777
0.6566
EE2
0.7095
0.7087
FC1
0.7354
0.7347
FC2
0.6758
0.6766
HM1
0.8002
HM2
0.5722
PV1
0.7094
PV2
0.7036
BI1
0.7254
0.7280
BI2
0.6853
0.6776
KMO
0.8471
0.8761
0.8700 0.8621 0.8729
0.6985
0.6759
0.7144
0.7143
0.6971
0.7016
0.7105
0.7027
0.7208
0.7169
0.6889
0.6914 0.9410
0.8842
0.3230 0.7049
0.8954 0.9556
0.6993 0.7314
0.7246
0.6790
0.6600
0.8188
0.8521
0.8327 0.8335 0.9455
0.4496°
0.8072
0.4812°° 0.6898
0.9121 0.9427
0.7172 0.7156
0.7270
0.6858
0.6763
0.6821
0.7855
0.8524 0.7491 0.8541 0.8564 0.7791 0.8441
Table 2: Measurement model results In UTAUT context, data analysis techniques of the structural model are diverse and there is no overall unique approach (Gupta et al. 2008). We follow Gupta et al. (2008) in using multiple regressions. Table 3 presents the regression estimation results. For adoption intention as dependent variable, regressions were run on the full sample (1st column) and on the user sample of 215 households (2nd column). Again, we find similar results. Regression results (significances, effect size) are almost identical when including SI and HA (which have failed the measurement model tests) as independent variables in the model.
ADOPTION INTENTION Model Sample R² Performance Expectancy Effort Expectancy Facilitating Conditions Hedonic Motivation Price Value
UTAUT1 UTAUT2 Full sample (N=549) 0.6465 0.5128761 *** -0.2745986 *** 0.2474619 ***
0.6782 0.3190237 *** -0.1896856 *** 0.2222112 *** 0.3135260 *** 0.0097629
UTAUT1 UTAUT2 User sample (N=215) 0.6218 0.3693373 *** -0.2899000 *** 0.3783821 ***
0.6403 0.2716530 *** -0.2177455 *** 0.3553009 *** 0.1993817 *** 0.0114477
CONTINUOUS USAGE INTENTION UTAUT1 UTAUT2 User sample (N=215) 0.2070 0.4660757 *** -0.0195628 0.0593007
0.2249 0.2834603 ** 0.0646276 0.0907068 0.2829456 ** 0.0159642
Table 3: Structural model results (* p