May 14, 1996 - with some development of hematite, while brown glazes occur on red siliceous cooking-pots. Green glazes arejound on pots glazed on both ...
Archoeom~fr?.39,
I (1997). 23-39. Printed in Great Britain
TECHNOLOGY AND COLOUR DEVELOPMENT OF HISPANOMORESQUE LEAD-GLAZED POTTERY* J. MOLERA, M. VENDRELL-SAZ, M. GARCIA-VALLES Depariameni de Crisial.lografra i Mirieralogia, Facultui de Geologia, Universitatde Barcelona, C. de Mariii Franquks, s/n. 08028 Barceloriu. Spain
and T . PRADELL Departatnent de Fisica. ETSAB (Escoln Ticnica Superior d'Agricultura de Barcelona),Universiiai Politicnica de Caialunya. 08036 Barcelona, Spain Lead-glazed pottery from the medieval workshop of Les Olleries Majors (Paterna, Spain) has been studied by Mossbauer spectroscopy, X-ray difraction, X-ray Jluorescence and optical spectroscopy. Yellow, brown and honey-coloured glazes occur on pots glazed on only one surjace. They have virtually identical compositions and transmittance spectra, their apparent differences in colour are due to the colours of the underlying pastes. Yellow glazes occur on cream-coloured calcareous bodies, h0ne.y-coloured glazes occur on less calcareous bodies with some development of hematite, while brown glazes occur on red siliceous cooking-pots. Green glazes arejound on pots glazed on both surfaces; the glazes trapped C 0 2 evolved by decomposing carbonates, resulting in an internal reducing environment. This caused the reduction of iron to the ferrous state which coloured the glaze green b y diffusion. KEYWORDS: SPAIN, PATERNA. LES OLLERIES MAJORS, MEDIEVAL, HISPANO-MORESQUE, MOSSBAUER SPECTROSCOPY, OPTICAL SPECTROSCOPY, X-RAY DIFFRACTION, X-RAY FLUORESCENCE. CERAMICS. GLAZE, COLOUR, OPTICAL PROPERTIES
INTRODUCTION
The decorated Hispano-Moresque tin-glazed pottery (green, brown and lustre) from Paterna and Manises (Spain) was widely exported across the Mediterranean sea during the thirteenth to fifteenth centuries, and was known all over Europe. Archaeological studies of an important medieval workshop in Paterna (Mesquida 1987; Amigues and Mesquida 1987 and 1993; Molera et al. 1996) revealed that large amounts of pottery with transparent lead glaze were also produced for the local market. Several glazed forms with a range of colours were produced for different domestic uses: kitchen ware, pots, bowls, plates, jars, urinals, candle lamps, and so on. Some of the cooking pots from both the thirteenth and fourteenth centuries present an apparently brown glaze on the inner surface. Bowls, plates and table ware produced in the thirteenth century show an apparently yellow glaze applied on one side, while candle lamps, jars and pots to store liquids exhibit a green glaze on both sides. However, in the fourteenth century and later, all domestic pottery shows the same apparently honey-coloured glaze. According to archaeologists (Mesquida pers. comm.), this change of colour from the thirteenth to the fourteenth century may be related to a change in fashion. Lustre pottery produced in this area also changed to reddish * Received 30 October
1995. accepted 14 May 1996.
23
24
J. Molera, M. Vendrell-Saz, M. Garcia-Val& and T. Prude11
colours; copper-like, shining decoration was produced instead of the gold-like decoration of the thirteenth century. Therefore, the change appears to be intentional and may reflect a deliberate change in the technology of manufacture of these ceramics. The green colour of the lead glazes is traditionally related to the presence of Cu2+ or Fe2+ in the glaze, whereas the yellow to brown colours are related to Fe3+ (Weyl 1959,95-7; Parmelee 1973, 71). As no copper has been detected in these glazes, the change of the colour must be related to the degree of oxidation of the iron contained in the glaze (Bamford 1977; Wakamatsu et al. 1987). The green colour is always related to dark and blackish pastes and, therefore, a reductive process has normally been accepted as a part of the firing of these ceramics. However, from the study of the workshop, there is no archaeological evidence that green lead-glazed pottery was produced separately from the other ceramics which are oxidized, either in the thirteenth or in the fourteenth centuries. Green-glazed ceramics have grey to dark brown reduced pastes, while yellow-, honey- and brown-glazed pots have cream and red oxidized pastes. The aims of this paper are: (i) the chemical and physical (colour) characterization of the green, yellow, honey and brown glazes; (ii) to establish the cause of the colour; and (iii) to determine the technology of production responsible for the different glaze colours. As the glazes are transparent, in order to determine how the ceramic body influences the colour, both glazes and pastes have been analysed independently. EXPERIMENTAL
Chemical and mineralogical analyses of the ceramic body were performed by X-ray fluorescence (XRF) and X-ray diffraction (XRD), respectively, after removal of the glaze layer. The state of oxidation of the iron contained in the pastes was also determined by measuring the Mossbauer spectra at room temperature. The study of the morphology and chemical composition of the glazes was performed on the outer surface and on polished sections by scanning electron microscopy (SEM) provided with energy and wavelength dispersive X-ray spectrometers (EDS and WDS). The degree of iron reduction of the glazes cannot be studied by Mossbauer spectroscopy due to the presence of lead. To quantify the colour of the ceramics, optical spectra of diffuse reflectance were measured between 360 and 800 nm, at intervals of 0.5 nm using a spectrophotometer fitted with an integrating sphere. The measurements were performed on the surface of the glaze-over-paste and on the paste alone after removing the glaze. The real colour of the glaze was determined by measuring the optical transmittance from 400 to 700 nm in a microphotometer adapted to a Carl Zeiss Universal microscope, on thin sections (c. 50pm) of four selected samples (from green, yellow, honey and brown pots). From the spectral distribution of reflectance and transmittance the colour coordinates were calculated (Wyszecky and Stiles 1967, 238-321). RESULTS
Pastes The chemical analyses of the pastes are shown in Table 1. No significant differences were observed between the pastes corresponding to the yellow- and green-glazed pottery of the thirteenth century. All of them are more calcareous (> 6.5% CaO) and poorer in iron (< 5% Fe203)than the fourteenth-century honey-glazed pastes, which are less calcareous (< 5% CaO)
25
Hispano-Moresque lead-glazed pottery Table I
Chemical compositions of paste fwt. %, averuge nnd. iri parentheses. standard deviation) for the samples of thirteenth- and fourteenth-centup lead-glazed pottery. I. 2. 3 and 4 identif?.each group in Figure 3
Si02
A1203
CaO
KzO
Fe203
MgO
Ti02
Green glaze (lo)*
60.23 (1.55)
16.08 (1.77)
6.83 (1.86)
4.14 (0.32)
4.74 (0.66)
2.17 (0.24)
0.72 (0.04)
2
Yellow glaze (4)
60.64 (1.66)
16.02 (1.52)
6.74 (0.57)
4.19 (0.10)
4.74 (0.41)
2.16 (0.29)
0.70 (0.02)
14th century
3
Honey-coloured glaze ( I 8)
58.96 (1.11)
18.78 (0.43)
4.72 (1.02)
4.54 (0.23)
5.72 (0.40)
2.30 (0.16)
0.78 (0.01)
13th-14th centuries
4
Brown glaze (25)
69.90 (3.00)
13.76 (1.22)
1.86 ( I .OX)
2.98 (0.27)
4.65 (0.55)
1.27 (0.17)
0.72 (0.06)
1
13th century
* Number of samples of each group analysed. and richer in iron (> 5% Fe203). The cooking pots of both centuries show similar chemical compositions indicating the persistence of the same paste (highly siliceous and below 2% of CaO content). In a previous study (Molera et al. 1996)the use of the same clay with additions of quartz sand or calcite to make the cooking pots and the honey-coloured lead-glazed pastes of the fourteenth century was demonstrated. Therefore, two different clays were mined to obtain the three pastes (the authors' unpublished results): a clay which was used in the production of the yellow- and green-glazed pastes of the thirteenth century; another clay which, with the addition of siliceous temper, was used in the production of the cooking pots during both centuries and, with the addition of calcite, was used in the production of the honey-glazed pottery. The mineralogical analysis of the pastes (Table 2 ) reveals the presence of neoformed phases such as gehlenite and pyroxene (except in the cooking pots which have a very low calcium content and, thus, a very low development of gehlenite). Accordingly, the typical firing temperature may be established between 850 "C and 900 "C. The different contents of hematite Table 2 Mineralogical composition of the pastes (rvt. %. avercige and. in parentheses, stundard deviation) for the samples of thirteenth- and fourteenth-century lead-glazed pottery. I , 2, 3 and 4 identib each group in Figure 3
I 13th century
2
Quartz
Calcite
Hemutite
K-feldspar
Melilite gehl-nker
Ca. Al. Fe pvroxens
1.3
-
Green glaze (lo)*
35.4 (9.1)
1.1
-
(1.0)
2.6 (1.7)
( 1.4)
Yellow glaze (4)
37.8 (9.8)
I .6 (1.7)
2.8 (0.6)
2.8 (0.4)
(1.1)
0.4 (0.1)
1.4 (3.2)
1.2
Cafeldspar I .2 ( 1 .O)
14th century
3
Honey-coloured glaze (18)
22.2 (3.2)
2.6 (2.6)
3.7 (1.7)
3.4 (1.8)
2.5 (3.4)
3.1 (5.7)
3.3 (4.8)
13th-14th centuries
4
Brown glaze (25)
44.2 (93)
1.1 (0.4)
3.4 (1.7)
2.2 (3.9)
0.6 (0.6)
-
4.8 (5.7)
*Number of samples of each group analysed
-
26
J. Molera, M . Vendrell-Saz, M . Garcia-Vallks and T. Pradell
are related to the several paste colours; cooking pots and honey-glazed pastes (red) have 3 to 4% of hematite and the yellow-glazed pastes (creamy) have less than 3%. Green-glazed pastes of the thirteenth century (grey colour) rarely contain hematite, which may be related to a reducing process during the firing inferred from the dark colours of the body. Mossbauer spectra of different pastes were obtained as shown in Figure 1. The hyperfine parameters of the Mossbauer spectra of representative pastes of each group and their association with the several mineral phases developed during firing are shown in Table 3. The degree of reduction is related to the ratio Fe'+/Fe3+ and the phases in which Fe2+ and Fe3+ are present indicate the range of temperatures at which the ceramic was oxidized or reduced. We found that green-glazed pastes of the thirteenth century present several degrees of reduction, although yellow-glazed pots of the thirteenth century and all glazed fourteenth-century samples (honeyglazed) and the cooking pots were made with oxidized pastes. Those pots of the thirteenth century exhibiting a darkish green-glazed surface correspond to the most reduced pastes produced at a temperature over 850 "C (temperature reached while reduction is performed), as indicated by the absence of iron oxides, hematite, maghemite and magnetite, and the presence of well-developed hercynite and Fe2+ in a silicate phase (Pradell et al. 1995). The green-glazed ceramics of the thirteenth century also present a high degree of reduction: iron oxides are related to a maghemite phase, with part of them (about 20% of the total iron) transformed to hercynite and Fe2+ in calcium silicates. These results indicate similar temperatures of reduction in both pastes but a possibly more reducing atmosphereAonger time in those pastes with a deep green glaze. The pastes corresponding to the yellow-glazed pottery of the thirteenth century show no apparent reduction, and the firing temperature was about 900 "C, determined from the Fe3+ hyperfine parameters -QS = 0.97(1)- (Maniatis et al. 1982; Janot and Delcroix 1974). The fourteenth-century honey-glazed pastes and the brown-glazed cooking pots are also well oxidized with a higher presence of hematite than the thirteenth-century yellow-glazed pastes with between 60% and 70% of the total iron of the sample as hematite. A broad distribution of iron oxide grain sizes indicates, most probably, a poorly oxidizing atmosphere during the firing. The variable development of hematite in non-reducing conditions may be related to the incorporation of Fe3+ in Ca-silicates developed during the firing from the reaction of CaO with the clay at temperatures over 700°C. Calcium content is as important as iron content in the final colour of the paste (Maniatis et al. 1983). Moreover, the illitic or kaolinitic character of the clay also contributes to the final mineral composition and colour since kaolinite collapses at lower temperatures than illite (Mackenzie et al. 1987). In the fourteenth-century samples, remains of collapsed illite were observed in the XRD patterns, suggesting a clay richer in illite than in the thirteenth century, in which clay the remains of illite are lower. Glazes All these glazes are transparent, their thickness is fairly broad ranging from 80pm to 140pm depending on the pot and also on the position in the same pot. The glazes are heterogeneous, showing several crystalline phases developed in the glaze-paste interface during the firing and bubbles of gas escaping from the paste surrounded by some of these crystals (Molera et al. 1993). The chemical analyses of the glazes are summarized in Table 4 where the mean and the standard deviation are given for each glaze colour (green and yellow of the thirteenth century,
Hispano-Moresque lead-glazed potter?,
27
A
B
+ -12
-9
-8
-3
0
3
6
9
12
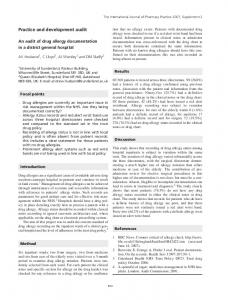
Velocity (mm/s) Figure 1 Mossbauer spectra of pastes corresponding to each of the pottery groups studied. (A) a highly reduced paste with a deep green-glazed apparent colour. (B) a reduced paste o f a green-glazed pot. (C) a paste corresponding to a yellow-glazed pot in which the development of the sextet corresponding to hematite may be seen.
3
4
13th-14th centuries
2
14th century
13th century
1
Brown glaze
Honey-coloured glaze
Yellow glaze
Green glaze
Dark green glaze
Fe3+ Hematite
Fe3+ Hematite
Fe3+ Hematite
~ e ' +-silicate
Fe'+-silicate Fe3+ Iron oxides Fe'+-hercynite
Fe'+ Fe'+-hercynite
0.32 (2) 0.36 (3)
0.32 (2) 0.34 (2)
0.35 (2) 0.38 (2)
0.77 (3) -0.22 (2)
0.93 ( 1 ) -0.18 (3)
0.97 (2) -0.20 (2)
-
2.6 (3)-2 (3) -
48.5 (4)
-
-
-
49.5 (1)
1.8 (l)-l.5 (1)
1.7 ( I )
-
2.3 (2)-1.8 (2)
50.0 (3) 50.0 ( 1 )
-
-
-
-
-
-
-
0.74 (4) 1.39 ( 5 ) 2.4 (3) 2.80 (3) 0.98 (2) -0.10 (5) 1.4 (2) 2.0 (4) 2.4 (4)
0.41 ( 5 ) 0.90 (3) 0.99 (2) 1.12 (2) 0.30 (5) 0.34 (4) 0.94 (3) 1.05 (2) 1.15 (3) -
A13-A23
BHF ( T )
QS ( m d s )
IS ( m d s )
0.45 (3) 0.40 (3)
0.54 (2) 0.40 (3)
0.75 (2) 0.55 (4)
0.5 (3) 0.70 (5) 0.50 (4) 0.30 (4) 0.70 (3) 0.80 (4) 0.50 (2) 0.40 (4)
r (mds)
31 69
30-40 70-60
50 50
30 40 20 10 50 30 10 4 5
at% over total Fe
Table 3 Mossbauer parameters of selected pastes from each of the colour groups studied. 1. 2. 3 and 4 identifi each group in Figure 3
N
3
a
,
2 cis
Hispano-Moresque lead-glazed pottery
29
honey of the fourteenth century and brown of the cooking pots). No great differences may be observed among them, showing a composition in weight per cent of about 55% of PbO, 31% of Si02,5% A1203,2% Fe203.I % K 2 0 , below 1% of MgO and between I-3% CaO depending on the type of paste. The presence of elements such as K, Al, Ca and Fe in the glaze may be partially attributed to the composition of the raw materials used to make the glaze, but also to the diffusion of components from the paste to the glaze during the firing. Some diffusion profiles of K and A1 have been shown in the glazes, but not for Fe or Ca, which show a fairly homogeneous distribution. However, in laboratory reproductions of lead glazes using short firing times, Fe and Ca also show diffusion profiles (the authors' publication in preparation). Some diffuse reflectance spectra of green-. yellow-, honey- and brown-coloured glazed ceramics are shown in Figure 2. From these data, the colour coordinates have been calculated and represented in a CIE (1931) diagram (plain numerals in Fig. 3), where the different groups may be identified by the dominant wavelength (AD), which is nearly the same for each one (578 nm for the green glazes, 585 nm for the yellow ones and 588 nm for the honey, light brown and brown glazes). The dotted lines in Figure 3 represent constant AD. Only AD (the hue of the colour) is considered here because other parameters such as excitation purity and luminosity are influenced by the geometry of the surface illuminated for the measurements. For a better understanding of the colorimetric concepts an Appendix has been added. However, since the glaze is transparent, the apparent colour observed (and measured) is the combination of the real colour of the glaze and the colour of the paste. To improve our approach, both sets of colours (those of the glazes and those of the pastes) were calculated. To this end, transmittance spectra of glazes of the four different colours (Fig. 4) were also measured on thin sections parallel to the surface prepared by removal of the paste, and the colour coordinates were calculated (squares in Fig. 3 ) . The diffuse reflectance spectra of flat surfaces of the pastes prepared by removal of the glaze were also measured (Fig. 5) and the colour coordinates were calculated (circles in Fig. 3 ) . The dominant wavelength of the brown, honey and yellow glazes is the same (579 nmj, which is typically yellow, due to the presence of Fe" in the glaze (Stroud 1971). In contrast, the green glaze has an AD corresponding to green (570 nm), probably associated with the incorporation of Fez+ into the glaze (Bamford 1977). The colour coordinates of the creamy pastes corresponding to yellow-glazed pottery are grouped together and exhibit a nearly common AD (585 nm), which is slightly different to that of the honey- and brown-glazed pottery, which is reddish (AD = 590 nm). This finding agrees with the hematite content of these pastes. The dispersion of the paste colours corresponding to the green pots is due to the several degrees of reduction. which is responsible for the final colour of the paste. Therefore, the colour of the pots is a superimposition of a yellow glaze over a creamy or a red paste which will give the final yellow, honey and brown colours observed. The green pots are the result of superimposing a green glaze over a dark paste (grey or dark brown). In order to obtain a better understanding, the optical behaviour of the system glass/paste has been calculated on the basis of the model presented in Figure 6 by using the data of glass transmittance and the diffuse reflection of the pastes. In this model only normal reflection has been calculated, the interface air-glass has been considered a perfect reflecting surface and the contact glass-paste a diffusor. Let the incident intensity be lo,the air-glass reflection R"" (calculated from the refractive index by Fresnel's equation), so that the transmission of the air-glass interface is ( I - Roir),the
MgO Ti02
PbO
MnO
CUO
* Number of samples of each group analysed.
4 Brown glaze (9) 32.83 (0.75) 5.35 (0.76) 0.90 (0.60) 0.86 (0.10) 2.22 (0.43) 0.66 (0.03) 0.33 (0.02)
13th-14th centuries
55.15 (4.80) 0.00 (0.00) 0.00 (0.00)
3 Honey-coloured 32.84 (1.58) 5.61 (0.82) 1.55 (0.29) 0.63 (0.26) 2.17 (0.56) 0.58 (0.17) 0.42 (0.17) 55.78 (1.69) 0.00 (0.00) 0.00 (0.00) glaze (6)
57.68 (5.12) 0.01 (0.00) 0.00 (0.00)
Fe203
54.62 (5.11) 0.01 (0.00) 0.00 (0.00)
K2 0
1 Green glaze (12) 32.76 (1.53) 5.25 (0.61) 2.59 (0.51) 0.93 (0.37) 2.53 (0.50) 0.49 (0.11) 0.40 (0.04)
CaO
2 Yellow glaze (6) 30.28 (1.16) 5.44 (0.26) 2.41 (0.22) 0.86 (0.23) 1.94 (0.19) 0.43 (0.13) 0.41 (0.06)
A1203
14th century
13th
SiOz
Table 4 Chemical composition of g[a;es (wt. 96,average and, in parmrheseA, srundurd deviurion)for the samples of thirteenth- and fourteenth-century lead glazes. I , 2.3 and 4 identifi each group in Figure 3
N
s.
a
F ro'
0
w
31
Hispatio-Moresque lead-glazed pottery
'I 40
-5
30
20
10
0 1
I 400
I
I
I
I
I
500
600
I 700
I
800
wavelength (nm)
Figure 2 Drffuse rejlectcince ciirws of sotiie .selected glii:ed ceriir1tic.s .fthe differmt co1our.s studied.
internal glass transmittance T, the diffuse reflection of the paste R,, and the intensity reflected by the system I . Following Figure 6, light suffers two reflections on the air-glass interface, one diffuse reflection on the interface glass-paste and is transmitted inside the glass body (which is considered here as an homogeneous transparent medium in which k = 0). Thus, the I value after the first reflection is: 1 = In *( 1 - Rf"'')* T
R,,
*( 1 - R";")
where Itlo = R Only one reflection has been considered for calculating because the intensity of the second reflection is under 0.001% of lo. By using this model, the dispersion of the calculated reflectances show the same shape as that of the experimental curves but the values are slightly lower (about 5%) in the whole spectrum. This fact may be explained because only the normal reflectance has been considered and, additionally, there are some internal reflections on the discontinuities of the glaze such as crystallites and bubbles which, under observation conditions, would increase the amount of reflected light.
DISCUSSION
Although the ceramics under study present four different colours (green, yellow, honey and brown), the glazes are only yellow or green. Among the chemical elements forming the glaze, iron is the only one capable of giving colour to the transparent lead glaze. Therefore, if iron is diffused from the paste as Fe3+ the glaze becomes yellow, but, if Fe2+ is diffused, the colour of the glaze is green. Laboratory experiments made by the authors confirmed that Fe, Al, K, and so
J. Moleru, M. Vendrell-Suz, M. Gar&-Vullks and T. Prude11
32
1.0
,
0.0 0.0 0.1 0.6
0.5 0.4
0.3
0.40 -
0.2
0.1 0.0
0.0
0.1
0.2
0.3
0.4
0.3
0.6
x coordinate
0.7
0.8
0.0
1.0
0.44 -
0.40 X
0.36 -
0.32-
0.32
0.36
0.40
0.44
0.48
Y Figure 3 CIE (1931J diagram showing the chromatici@points of the transmission ojfourglazes (numerals in squares). the diffuse reflectance nj the paste (numerals in circles) and the dlffuffusereflectance of glazed pottery (plain nurnerals). The numerals indicate the type nf potteff: ( I ) green-glazed; ( 2 ) yellow-glazed: (3) honey-glazed; (4) brown-glazed (cooking p c ~ t ~The ) . dotted lines radiating from point (C) represenr constant dominant wavelength hl, (see text and Appendix).
Hispano-Moresque lead-glazed potter?,
0'70
1
33
1
0 60
0 50
0 40
0 30
0 20 400
500
600
700
wavelength (nm)
on, can diffuse from the paste to the glaze during heating (the authors' publication in preparation). The observed colour corresponds to that of the glaze superimposed on the colour of the paste. As may be observed in Figure 3, the colour coordinates corresponding to the yellow pottery (marked as 2 ) fall between those of the yellow glazes (marked as 2 in a square) and those of the creamy pastes (marked with 2 in a circle). The colour coordinates of the honey and brown pots (3 and 4, respectively) are between the yellow glazes (marked as 2 in a square) and the corresponding reddish and red pastes (3 and 4 in circles). The observations for the four groups of pottery here presented may be summarized as follows. ( 1 ) green glaze on a grey paste (colourless of low luminosity). The apparent colour is green. As the degree of reduction of the paste is not uniform different hues of green may be observed. ( 2 ) apparently yellow-glazed pottery: a yellow glaze on a creamy paste (moderate CaO content and low development of hematite). The colour observed is yellow. (3) apparently honey-glazed pottery: a yellow glaze on a reddish paste (moderate CaO content but well-developed hematite). The colour observed is light brown (honey). (4) apparently brown glaze of cooking pots: a yellow glaze on a red paste (very low CaO content and good development of hematite). The colour observed is brown. The glazes and pastes for yellow and green pots have the same chemical compositions but the paste is oxidized or reduced, respectively. However. this cannot be attributed to a different firing process because yellow and green colours, in some cases, are found together in the same pot. But the green colours are always related to glazes applied to both sides, and yellow colours to one side only glazed. And even when both colours are found in different parts of the same pot, the paste below green glaze is grey to brown and the paste below yellow glaze is red. The reason
34
J. Moleru, M. Vendrell-Saz, M. Gurcia-Vallks and T. Pradell 6o
1
2 yellow
1 green
400
500
600
700
800
wavelength (nm) Figure 5 Diffuse reflectance curves of selected pastes obtained on smoothed surfaces after removal of the glaze
may be that a reducing atmosphere is created during firing by the gases produced inside the ceramic body enclosed by glaze on two sides. During firing, reducing and inert gases such as CO, water vapour, COz, and so on are produced by the combustion of the wood which consumes an important part of the oxygen inside the kiln. Thus, the pottery cannot be completely oxidized. As the glaze melts at about 700 "C (Nordyke 1984), when calcite decomposes both sides of the pot are sealed by the glaze and a reducing atmosphere is produced inside the paste by the trapped C 0 2 .Under these conditions Fez+ diffuses from the paste to the glaze which becomes green. If
Figure 6 Schematic path followed by the light in the systeni glaze-paste.
Hispunn-Morrsque leLid-gIu:ed p o t t e p
35
only one side is glazed. the gases produced by decomposition of the calcite may escape through the porosity of the ceramic body by the non-glazed side. The reason for the higher reduction of the pottery of the thirteenth century glazed on both sides (i.e.. higher diffusion of Fe” to the glaze) may be the calcite content of the clay body. The paste used in the fourteenth century was Ca-poorer and probably the calcite was of bigger grain size as indicated by the high development of gehlenite. During the cooling phase, there is no burning, the partial pressure of oxygen is 2076, and the iron of the paste is oxidized while the temperature is relatively high (over 500°C). If both sides are glazed the ceramic body is sealed before the oxidizing atmosphere reaches the paste and, thus, it remains reduced due to the protective action of the glaze covering both sides. When only one side is glazed, the oxygen reaches the paste through the porosity of the ceramic body and the iron is oxidized. Thus, the paste becomes more or less red depending on the iron available as oxides. If most of this iron has incorporated into the silicate’s structure (like gehlenite or pyroxene), less iron remains to form hematite in the cooling stage. The grain size of calcite is also an important factor, as in the honey pottery of the fourteenth century which developed more hematite than the oxidized pottery of the thirteenth century. To support the hypothesis of a single firing there are several examples of pots of the thirteenth century partially glazed on one and both sides. Their colour changes from yellow to green, and the colour of the paste under the glaze from cream to grey, in those parts glazed on one or two sides respectively. All these facts support the hypothesis that the diffusion of iron from the paste to the glaze is in the form of Fe’+ or Fe” while the process that takes place in the paste is oxidizing or reducing and, therefore, the colour of the glazes is yellow or brown. or green, respectively. CONCLUSIONS
From these results the following important points may be made. The real colour of the glaze is produced by iron diffused from the paste. The colour observed is that of the glaze by transmittance (which acts as an optical filter) superimposed to that of the underlying paste by diffuse reflection. Green-glazed pottery is always glazed on both surfaces and, as a consequence, the paste is reduced and the iron is diffused as Fe”. giving the glaze green coloration. In those ceramics glazed on one surface the paste is oxidized and the glaze becomes yellow by the diffusion of Fe”. The difference of the apparent colours in the yellow, honey and brown pottery is due to the different development of hematite in the paste because of a difference in the Ca content of the different groups and the mineralogical nature of the raw materials. Additional to the Ca content, the mineralogical analyses of the paste of yellow pottery (high gehlenite content) seem to indicate a bigger grain size of calcite, which after transformation into CaO reacts with the silicate surrounding to form gehlenite in this Ca-rich environment. The same paste was used to produce green and yellow pottery during the thirteenth century. A change in the paste used in the fourteenth century produces a reddish colour (honey) probably because of the smaller grain size of the calcite grains. When the CaO content is under 2% (as in the cooking pots) the paste becomes red and the observed colour through the glaze is brown.
36
J. Molera, M . Vendrell-Suz, M . Gurcia-Vullks uncl T. Prude11
There are no differences between cooking pots produced in the thirteenth and the fourteenth centuries, either in the paste or in the colour. The change from green and yellow pottery (thirteenth century) to honey (fourteenth century) is parallel to the change from green- and black-decorated tin-glazed pottery of the thirteenth century to the lustre pottery of the fourteenth century (M. Mesquida pers. comm.). Thus, if the honey colour is a voluntary decision of the potters to follow a fashion, they appear to have had good knowledge of the behaviour of the raw materials and, perhaps, undertook empirical tests to check how different clays change under firing. No changes have been detected in the cooking pots in which the most important property is their thermal behaviour instead of their colour. This fact reflects a high development in the ceramic industry and in the empirical knowledge of the ceramic process by the Hispano-Moresque potters. ACKNOWLEDGEMENTS The authors want to thank Dr Merci Mesquida. archaeologist of the Paterna Council. for her collaboration in supplying the materials for analysis and giving her time to discuss the results in the historical framework.
REFERENCES Amigues, F.. and Mesquida, M.. 1987, (111 honlo r w d i e w l d i e ceriimiccr. El Te.s/rrr ilel Mali. Paterrirr (Vrrlhciii). Publicationes de la Casa de Velazquez. Madrid. Amigues. F., and Mesquida. M.. 1993. Les iztc4iers ef kr cercrr11ique tke Pirtenirr ( X l l l e - X I V e si?clrJ.Musk Saint-Jacques. Beziers. Bamford. C. R.. 1977. Color generation and control in glass. Gluss scierrce rrnd feclrnology 2. Elsevier. Amsterdam. CIE (Commission Internationale pour I’Eclairage). 193I , Cambridge University Press, Cambridge. Janot. C.. and Delcroix. P., 1974. Currrcterisutiorl de rnuteriau.r arckhnlogique.s pur .spectromerrie Miissbuuer. Centre de Recherches Archtologiques Notes et Monographies Techniques. 4. Centre National de la Recherche Scientifique. Paris. Mackenzie. R. A,. Rahnian. A. A,. and Moir. H. M.. 1987. Interaction of kaolinite with calcite on heating. 11. Mixtures with one kaolinite in carbon dioxide, Therrnrichirn. Actu, 124. 119-27. Maniatis. Y., Simopoulos. A,. and Kostikas. A,. 1982. The investigation of ancient ceramic technology by Miissbauer spectroscopy. in Archrreologicnl cerurnics (eds. J. S . Olin and A. D. Franklin). 97- 108. Smithsonian Institution. Washington, DC. Maniatis, Y., Simopoulos. A,. Kostikas. A,, and Perdikatsis. V.. 1983. Effect ofreducing atmosphere on minerals and iron oxides developed in fired clays: the role of calcium, J. Am. Ci,rum Soc., 66 ( I I ), 773-8 I , Mesquida, M.. 1987. Uiitr terrisserirr dels segles X I / / i XIV. Publicacions del Ajuntament de Paterna. Paterna. Molera. J., Pradell, T.. Martinez-Manent. S.. and Vendrell-Saz, M.. 1993, The growth of sanidine crystals in the lead glaze of Hispano-Moresque potttery. Applied Cloy Sci., 7. 483-91. Molera, J., Garcia-VaIICs, M.. Pradell. T., and Vendrell-Saz, M., 1996, Hispano-Moresque pottery production of the 38 ( I ) . 67-80. fourteenth-century workshop of Testar del Moli (Paterna. Spain). At-chrrromrt~. Nordyke. J. S.. 1984. Lucid in the btorld ofcrrumics. Am. Ceram. Soc.. Columbus. Ohio. Parmalee, C. W., 1973, Cermnic glozes. Cahners Publ. Co., Boston, MA. Pradell, T.. Molera. J.. Garcia-VallCs. M.. and Vendrell-Saz. M., 1995. Study and characterization of reduced ceramics. i n Proceedings Eurnpeari meeting on rrrrcierrt cernmics (eds. M. Vendrell, J. Molera, M. Garcia and T. Pradell). 417-30, Publicacions de la Generalitat de Catalunya. Barcelona. Stroud. J. S.. 1971, Optical absorption and color caused by selected cations in high-density lead silicate glass. J. Am. Cerum. Soc., 54 (8). 401 -6. Wakamatsu. M.. Takeuchi, N.. and Ishida, S., 1987. Effect of furnace atmosphere on color i n iron glaze, J. NotiCri.sttrl/irre Solids, 95/96. 733-40. Weyl. W. A,, 1959. Coloured ~ l u s s e Dawson’s ~. of Pall Mall. London. Wyszechy, G.. and Stiles, W. S.. 1967, Color science. John Wiley and Sons. New York, London. Sidney.
37 APPENDIX
In order to clarify some of the aspects presented in this paper concerning the colour measurements. the authors prepared this Appendix which should not he conhidered as a text on colorimetry hut only ;in aid to following the graphics and calculations presented. Colour is a psychological perception caused by the stimulus produced by the visihle light in the eye, that is to say. when a particular combination of wavelengths reaches the eye it is detected by the brain a s a particular colour. Although each wavelength has its characteristic colour response. the range of pure colours given by each wavelength does not represent the total range of available colours. Each colour has three attributes. namely luminosity (the quantity of light). hue (which allows us to differentiate between red. green. blue. and so on) and excitation purity (thc quantity of white that, mixed with a pure colour. reproduces a particular colour). As the response ofthe eye depends on the stimulus. it is obvious that the illuminant Hux has to be considered when quantitative nieasureineiits of the colour ;ire carried out. The Commission Internationale pour I'Eclairage (CIE)established some standard illurninants one of which is known as C (which corresponds to the north sky light) and is one of the most widely used. Leonard0 d a Vinci said that almost all the colours niay be made by mixtures of three 'well selected' colours. If we draw a triangle whose corners are pure green, red and blue (Fig. 7), avoiding the mathematical development which is beyond the scope ofthis text. we may establish a colour C, as the w m o f a certain amount of green ,yI. blue hl and red r l . then: Cl = r I R + ~ I G f h l t l This is the basis of the algebra of the colours which allows us to establish that a mixture of two colours C, and Cz may he determined as follows:
+
+ + ,gz)G + ( b , + h:)B
2'Ci = 0'1 r ? ) R (gl
However. the pure spectral colours (monochromatic light) cannot be obtained by mixing other spectral colours, so that the locus of all the spectral colours falls outside the triangle. Accordingly. there are some colours that cannot be obtained by additions of green, blue and red lights previously chosen (those points lying between the triangle and the locus line). But all the possible colours lie inside the lociis of the pure spectral colours and the purple line between blue and red. It is for this reason that Leonardo's statement includes the term 'well selected'. By mixing three spectral colours limiting a small triangle only a limited variety of colours could be obtained. So, if we want to mix three 'colours' to obtain m y of the posbible colours. we must choose three points outside the curve. These points will he 'non-existent' colours hut from the mathematical point of view this does not present a
3 B
R Figure 7
38
J. Moleru, M. Vendrell-Suz, M. Gurciu- Valle's and T. Prude11
problem. After experiments with hundreds of observers the CIE established the spectral distribution of three standard disrribittiori cweJrcirrits (xh. and :A) and developed a representation system (CIE 193 I ) in which all the coordinates are positive (Fig. 8).
Colour culculution The radiant flux reflected or transmitted by an object has to be specitied by its spectral distribution RhLhAhor ThLhAh. where R, is the spectral reflectance. T i the spectral transmittance and LA the spectral distribution of the Rux illuminating the object. The tristiniulus values X . Y and Z of a reflecting object are given by (and similarly for a transparent body):
x = kCRhLhA-hAA;
Y = kCRhLh>jhAh: and
z z kCRALhzhAh
where .rh. F~ and zh are the distribution coefficients, and the normalizing factor k takes the value k = lOO/CLhyhAh so that. for a perfect reflecting or transmitting object ( R h or Th equals one for all wavelength) Y = 100. Then. the value of Y represents the Iumiriosiiv of the colour of this object. The chromaticity coordinates are calculated from the tristimulus X , Y and Z
.r=X/(XiY+Z);
y= YI(X+Y+Z)
and
:=Z/(X+Y+Z)
The colour coordinates of the illurninant may also be calculated from its spectral distribution and it represents the achromatic point ( C in our case).
Donzinanf wavelength and excitation purity The dominant wavelength. AD. o f a particular colour is the wavelength of the spectrum which, mixed with the achromatic stimulus. matches the given colour. So that, it represents the h e ofthis colour. In the CIE ( 193 I ) diagram it is represented 1.o 0.9
0.8
0.7
4
520
jfi
550
0.6
0.5 0.4
9700
0.3 0.2 0.1
0.0
1480L /
ti 0.0 0.1
0.2
0.3
0.4
0.5
0.6
x coordinate Figure 8
0.7
0.8
0.9
1.0
Hispuno-Moresque lead-glazed pottery
39
by a straight line from the point C to the locus passing through the point representing the given colour: the corresponding wavelength in the spectral locus is. thus. the dominant wavelength of this colour (Fig. 8). It represents the hue of this colour because the pure spectral colour corresponding to Xo mixed with white produces this colour. For the colours lying in the purple area the dominant wavelength cannot be determined. then the complementary wavelength X , is normally used. As it is shown in Figure 8, it represents which pure colour may be added to the given purple colour to obtain the achromatic point. In practical studies the slope of each line linking the achromatic point with each wavelength of the locus is given in tables for selected illuminants. The excitarion purity of a colour having a dominant wavelength X,I is given by the ratio of the distances CP/CAD(see Fig. 8).The closer the chromaticity point is to the locus. the ‘purer’ is the colour. Obviously, all the spectral colours have an excitation purity equal to one. This attribute is calculated by the expression: pe = (x - xc)/(x,,
- xc)
where x is the first coordinate of the given colour. xc is that of the achromatic point C. and xD is the coordinate of the spectral colour corresponding to the dominant wavelength.