590
IEEE TRANSACTIONS ON ELECTRON DEVICES, VOL. 49, NO. 4, APRIL 2002
Technology and Reliability Constrained Future Copper Interconnects—Part I: Resistance Modeling Pawan Kapur, James P. McVittie, Senior Member, IEEE, and Krishna C. Saraswat, Fellow, IEEE
Abstract—A realistic assessment of future interconnect performance is addressed, specifically, by modeling copper (Cu) wire effective resistivity in the light of technological and reliability constraints. The scaling-induced rise in resistance in the future may be significantly exacerbated due to an increase in Cu resistivity itself, through both electron surface scattering and diffusion barrier effect. The impact of these effects on resistivity is modeled under various technological conditions and constraints. These constraints include the interconnect operation temperature, the effect of copper-diffusion barrier thickness and its deposition technology, and the quality of interconnect/barrier interface. Reliable effective resistivity trends are established at various tiers of interconnects, namely, at the local, semiglobal, and global levels. Detailed implications of the effect of resistivity trends on performance are addressed in the second part of this work. Index Terms—Copper-diffusion barrier, copper resistance, copper resistivity, electron surface scattering, interconnect performance, interconnect temperature.
I. INTRODUCTION
T
HE GROWING demand for higher performance through greater functionality in integrated circuits (ICs) has resulted in an aggressive shrinking of devices coupled with a continuous increase in chip size. The scaling incentive has been further fortified by an added bonus of increased device speeds resulting from smaller channel lengths. However, not all trends are rendered conducive by the miniaturization paradigm. Interconnect speed, which was formerly insignificant, is rapidly becoming a performance bottleneck because of its tendency to follow degrading trends with scaling [1], [2]. Longer wires due to a larger chip size, coupled with smaller and more closely packed interconnects (smaller pitch) is leading to a continuous increase in resistance and capacitance, forcing longer RC interconnect delays with each generation. Several mitigating solutions, with varying degrees of effectiveness and penalties, have been proposed at the physical design, circuit, and materials level. The physical design level approach is to progressively increase the number of wiring levels in the future. This leads to more relaxed dimensions for longer wires at the top metal levels. However, an excessive growth in metal levels increases process complexity and cost. At the circuits’ level, among other solutions, inserting periodic repeaters serves as a powerful tool to mitigate the increase in line delays [3]. However, repeaters have the penalty of increasing area and power consumption. Manuscript received June 4, 2001; revised December 19, 2001. This work was supported by the MARCO Interconnect Focus Center and DARPA AME Program. The review of this paper was arranged by Editor C. McAndrew. The authors are with the Department of Electrical Engineering, Stanford University, Stanford, CA 94305 USA (e-mail:
[email protected]). Publisher Item Identifier S 0018-9383(02)03037-X.
Finally, the materials-based solution constitutes replacing aluminum and silicon–dioxide (SiO ) with copper and low dielectric constant (low- ) materials, respectively. This material set replacement helps increase the speed of interconnects by reducing resistance and capacitance per unit length, with Cu having an added benefit of better electromigration properties to handle increasing current densities. However, because these solutions only partially solve the interconnect problem and have penalties, they are likely to only extend the life of the existing paradigm by a few years. It is critical to accurately assess both the efficacy of these solutions as well as evaluate their penalties. This assessment will help determine the need and the required time frame for alternative solutions (such as asynchronous timing and three-dimensional [3-D] technology) in order to keep up with the Moore’s law. In the past, various attempts to estimate the performance gains arising from new solutions have been made [4]. However, a realistic assessment on the prowess, limitations, and life of these innovations, which accounts for technological and reliability-induced practical constraints, has thus far not been adequately addressed. The primary goal of this work is to estimate the impact of both technology and certain reliability dependent factors on interconnect resistance. The only aspect of reliability relevant in this work is copper diffusion into neighboring dielectric. The interconnect effective resistivity is a critical parameter in evaluating the performance and penalties in the light of aforementioned innovations. Falsely exaggerated performance can be predicted using ideal Cu resistivity. Various levels of technological achievements are assumed to evaluate future resistivity and resistance trends. The realistic copper resistivity is also compared with realistic aluminum resistivity to evaluate true Cu performance advantage. We have organized the rest of the paper as follows. In Section II, we discuss the motivation for practical resistivity modeling. Sections III and IV discuss the underlying theory for such modeling and the simulation methodology, respectively, and Section V addresses results in the form of effective copper and aluminum resistivity trends in the future. The results are obtained, compared and discussed for global, semiglobal as well as local tiers. Finally, we summarize and conclude in Section VI. II. MOTIVATION
FOR MODELING CONSTRAINTS
WITH PRACTICAL
With the advent of copper technology, there is a danger of a simplistic, ideal, interconnect resistivity assumption of -cm for performance and design constraint deter1.7 mination. Even the international technology roadmap for
0018-9383/02$17.00 © 2002 IEEE
KAPUR et al.: TECHNOLOGY AND RELIABILITY CONSTRAINED FUTURE COPPER INTERCONNECTS—PART I
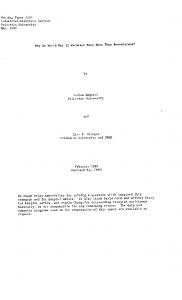
semiconductors ITRS’99 assumes the effective resistivity of -cm [5] with scaling in copper to be relatively constant at 2.2 the future. In fact, it assumes that technological solutions will -cm after be found to bring this value back down to about 1.8 year 2008 [5]. In reality, interconnect stacks are complex structures, and hence, lead to nontrivial resistivity values that are not only different from simplistic room temperature values but are highly variable depending on the dimensions, technology, and reliability criteria. A systematic quantification, inclusive of these practical constraints, thus becomes imperative to predict accurate future resistivity trends. With aggressive scaling suggested in ITRS ’99 (Fig. 1), dimension-dependent effects begin dramatically influencing interconnect resistivity. The extent of the dimensional role in resistivity is dictated by technological constraints. Among the dimensional effects, two that have the most impact in increasing effective resistivity are the effects of current-carrying electrons getting scattered from interfaces [6], [7] and grain boundaries [8] and the fractional reduction in the copper cross-section area owing to a nonnegligible area consumed by the highly resistive diffusion barrier. The effective resistivity is defined as the resistivity that would enable calculations assuming a consummate occupation of the designated interconnect cross-section area by copper and can be trivially used in performance/circuit/design calculations without concerns of barrier. Aforementioned effects are heavily controlled by certain technology and reliability dictated parameters, specifically, 1) the interconnect operation temperature, 2) the interface quality between the barrier and copper, 3) minimum barrier thickness requirement, and 4) the cross sectional barrier profile in the interconnect. Interconnect temperature will be determined by the advances in the low thermal resistance packaging technology and the ability to technologically engineer a low dielectric constant material with good heat conduction properties. Interface quality, on the other hand, could be determined by technological factors such as predeposition surface treatments [6] as well as deposition process conditions which may dictate the extent of monolayer wetting, consequently, the surface roughness at the interface [9]. Minimum barrier thickness requirement is dependent on technologically engineered, barrier integrity and reliability. This usual case of dual-damascene integration is determined at the via level. However, in this work, we assume this to be optimistically determined at the metal level. Finally, the barrier profile is influenced by the choice of deposition technology. The various possibilities include atomic layer deposition (ALD), collimated physical vapor deposition (cPVD), and ionized physical vapor deposition (IPVD). The barrier and the surface scattering effects would become increasingly dominant in the future. The barrier does not scale as rapidly as the interconnect dimensions because of reliability constraint. This will lead to a progressively larger fraction of the cross section area being occupied by the high resistivity barrier, thus, an increase in effective resistivity of the interconnect stack. On the other hand, with dimensional shrinkage, the bulk mean free path of electrons will become comparable to the wire dimensions, leading to a nonnegligible scattering rate from the interface. To compound the problem, the operational tempera-
591
Fig. 1. ITRS ’99 dictated dimensions for local, semiglobal and global interconnects.
ture is also likely to rise owing to a larger chip power density in the future. The interconnect temperature may further rise because of an increase in self-heating of interconnects [10] arising from both a higher current density and use of poor heat conducting, lower dielectric constant materials. It is instructive to note that each of the above two effects could act uniquely/differently on aluminum and copper and may rescind the advantages of copper in the future. The remaining part of the paper focuses on modeling above effects and establishing reliable resistivity future trends as a function of different barrier deposition technologies and thickness, operational temperatures, and barrier/copper interface quality. In modeling the electrons scattering effect, grain boundary scattering is not included in this work. It will only serve to further increase effective resistivity and degrade interconnect performance. III. THEORETICAL BACKGROUND The rapidity of increase in resistivity with dimensional shrinking because of electron surface scattering effect depends specifically on the interconnect operation temperature and on the copper–barrier interface quality. Operational temperature not only directly impacts resistivity by dictating phonon density, thus, the electron collision probability with phonons, it also, in so doing, dictates the relative importance of electron collision with surface compared to bulk phonons. At a high temperature for same dimensions, the surface scattering effect will be less. However, the bulk resistivity would be higher. Interface quality, on the other hand, determines resistivity by dictating the extent of elastic collisions suffered by electrons at the interface. Elastically scattered electrons do not contribute to increase in resistivity since, upon collision, they conserve momentum in the direction of the current flow. The fraction of electrons, which suffer elastic collisions at the interface resulting in specular scattering, is modeled by an empirical value of parameter, , which varies between 0 and 1. A value of 0, 1 does not change copper resistivity, whereas signifying complete diffuse scattering, has the most detrimental
592
IEEE TRANSACTIONS ON ELECTRON DEVICES, VOL. 49, NO. 4, APRIL 2002
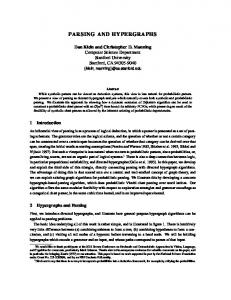
Fig. 4. Flow chart showing the methodology used to extract the resistivity trends for different barrier technologies, temperature, and interface characteristics.
Fig. 2. Schematic showing electron surface scattering and the parameter used to characterize the interface quality.
P,
Fig. 5. Sample SPEEDIE profile for the year 2004 interconnect geometries clearly showing the effect of barrier deposition technology on its profile. Fig. 3. Schematic interconnect cross section, depicting the effect of barrier deposition technology on profile.
effect on resistivity. This effect is schematically depicted in Fig. 2. The mathematical formulation governing the theory of scattering from the surface/interface has been comprehensively dealt with before [11]–[13], and results in the following equation for surface scattering dependent resistivity : (1) is the bulk resistivity at a given temperature, is Here, is the mean free path in the bulk the integration variable, film at a given temperature, is the smallest film thickness, and is the ratio of thickness to bulk mean free path ( ). As is greater than 1. is a critexpected, (1) indicates that ical parameter, which brings in both dimensional and an implicit temperature dependence. Equation (1) indicates that a smaller value would lead to a larger surface dominated resistivity. At higher temperatures, bulk mean free path will be smaller, value. Howhence, will be larger, leading to a smaller ever, is larger to begin with at higher temperatures. An interesting observation with regards to a comparison between copper and aluminum is that for materials with higher intrinsic resistivity, hence, smaller mean free path, the effect of dimensional shrinking will be subdued owing to a larger value of . Consequently, copper with a smaller intrinsic resistivity would be more heavily influenced by surface scattering than aluminum. The barrier dictated increase in resistivity would be directly dependent on the area occupied by it. The extent of fractional
area consumed by the barrier for a given interconnect dimension would be determined by both the minimum barrier thickness requirement and the barrier profile. The minimum barrier thickness will depend on the effectiveness of the barrier to stop copper diffusion, whereas, the barrier profile will be dictated by the barrier deposition technology. A highly conformal barrier technology such as ALD, would minimize the barrier area, whereas, less conformal PVD based technologies would require thicker barrier at most points to ensure minimum thickness at the least coverage points, leading to a larger cross-sectional barrier area. This effect is illustrated in Fig. 3. The less conformal technologies will become increasingly unsuitable in the future as their ability to ensure minimum coverage on higher aspect ratio wires will steadily deteriorate [14]. The equation governing the barrier dictated resistivity is (2) Here, is the effective resistivity because of barrier, is the is the area occupied bulk resistivity at a given temperature, is the aspect ratio, and is the width of by the barrier, the interconnect. Equation (2) assumes no conduction through the barrier. This is a reasonable assumption since the barrier -cm compared to resistivities can be of the order of 100s of single digit copper resistivity numbers. From (2) it is obvious increases, increases. As far as comparison between that as copper and Aluminum is concerned, since Al does not need a four-sided barrier, this effect would degrade Cu resistivity a lot more.
KAPUR et al.: TECHNOLOGY AND RELIABILITY CONSTRAINED FUTURE COPPER INTERCONNECTS—PART I
(a)
(a)
(b)
(b)
Fig. 6. Effect of barrier technology and P value on Cu resistivity of global wires. Barrier thickness (BT) 10 nm, temp. 100 C. (a) P 0.5 and (b) P 1. Al resistivity trend superimposed for different P values.
=
=
593
=
=
IV. RESISTIVITY SIMULATION METHODOLOGY Resistivity trends were evaluated using ITRS ’99 dictated future interconnect dimensions. The calculation methodology is depicted by means of a flow chart in Fig. 4. For estimating the barrier effect on effective Cu resistivity, we started with simulating barrier profile as a function of different technologies using our process simulator Stanford Profile Emulator for Etching and Deposition in IC Engineering (SPEEDIE) [14]. SPEEDIE is an analytical full 3-D flux calculation based process simulator, which is capable of simulating deposition profiles arising from diverse deposition technologies. In this work, profiles using PVD, c-PVD, IPVD and ALD were simulated on ITRS-dictated dimensions from year 1999 (180 nm node) to the year 2011 (50 nm node) at local, semiglobal and global tiers. The deposition time was varied for each of the simulated geometries until the required minimum barrier thickness was obtained inside a given geometry. Two different minimum thicknesses of 5 and 10 nm were used. Various
Fig. 7. Future Cu and Al resistivity trend for different barrier technologies. For Cu, P 0.5, BT 10 nm, temp. 100 C. (a) Local wires and (b) semiglobal wires.
=
=
=
input parameters for SPEEDIE corresponding to various deposition conditions were estimated based on the knowledge of the physical mechanism of the processes and the literature documented values of the parameters. For example, for all the deposition processes, the sticking probability of neutrals atoms (barrier material) on the surface was taken to be 1 [15], [16]. The distribution of neutrals was assumed to be slightly more directional than isotropic and was modeled by a cosine to the third power (cosine being perfect isotropic). If ions were present in a process they were assumed to be completely directional. The yield curve which quantifies the number atoms sputtered per incoming ion was obtained using previously done modeling [17]. The ionization fraction for IPVD was assumed to be about 85%, which is reasonably common in current plasma-based IPVD systems. Using the SPEEDIE-generated barrier profiles coordinates, the actual area consumed by the barrier was obtained for each technology node and tier. Subsequently, (2) was used to calculate the barrier-dictated resistivity. The last two steps were done by
594
IEEE TRANSACTIONS ON ELECTRON DEVICES, VOL. 49, NO. 4, APRIL 2002
(a) Fig. 8. Cu resistivity trends at 77 K temperature, global wires, P 10 nm.
=
= 0.5, BT
using commercial numerical software package, MATLAB. PERL script was used to interface SPEEDIE with MATLAB. For aluminum interconnects, only a 5 nm barrier at the bottom is considered in these simulations, as is commonly used for aluminum texture development. The methodology used here is independent of the barrier material as the barrier is assumed to support no current. Also, the deposition profile is believed to be independent of the material to the first order, because of relatively similar deposition parameters encountered for various barrier materials. The surface scattering-governed resistivity (1) was numerically solved. The resistivity was evaluated for values varying from 0 to 1 in steps of 0.25. Two different temperatures were used, namely room temperature and 100 C. The temperaturedictated mean free path in copper and aluminum was used from [6], [18]. Finally, the future resistivity trends were established at all tiers by combining both (1) and (2) and were plotted as a function of barrier deposition technology, barrier thickness, interface quality ( value), and temperature. The effect of barrier thickness on interface scattering was found to be negligible, i.e., the dimensions for surface scattering were assumed to be the dimensions of the interconnect, neglecting the barrier thickness. V. RESULTS AND DISCUSSIONS Sample SPEEDIE profiles for a 10 nm minimum barrier thickness, IPVD, c-PVD, PVD, and ALD on a year 2004 geometry for local and global interconnects are shown in Fig. 5. As seen from these typical profiles, PVD and the ALD barrier consumed the largest and the least area, respectively. ALD technology was assumed to a give complete conformality with a 100% step coverage. Fig. 6(a) and (b) shows Cu and Al effective resistivity for global interconnects at 100 C with 0.5 and 1, revarious, 10 nm, barrier technologies for spectively. Fig. 7 shows similar trends for local and semiglobal 0.5 and a temperature of 100 C. From interconnects with Figs. 6 and 7, it is seen that global wire resistivity rises most
(b) Fig. 9. Cu resistivity future trends for minimum 5 nm BT, and no barrier at 100 C, P 0.5. (a) Local wires, (b) global wires.
=
slowly with years. This occurs because the larger dimensions of global wire results in both a lesser fraction of cross sectional area consumption by the barrier and in lesser electron surface scattering. Further, it is also observed that the effective resistivity depicts least variation with the ALD deposition technology in the future due to its conformal properties. A very low temperature (77 K) Cu effective resistivity trend for different barrier deposition technologies is shown in Fig. 8. The resistivity, in general, is found to be much higher for lower and higher temperature. Similar effective resistivity trends for an aggressively reduced minimum barrier thickness of 5 nm at 100 C are shown in Fig. 9. Al resistivity rises slower than Cu because of reasons discussed earlier. This may lead to a higher copper effective resistivity than that of aluminum in the future. The cross over, where copper effective resistivity is higher occurs faster for 1 local and semiglobal interconnects. For instance, with for aluminum and 0.5 for Cu, local interconnects with a 10 nm minimum thickness barrier, will exhibit a cross over in
KAPUR et al.: TECHNOLOGY AND RELIABILITY CONSTRAINED FUTURE COPPER INTERCONNECTS—PART I
(a)
595
(a)
(b) Fig. 10. Effect of P and temperature on Cu resistivity for ALD barrier deposition technology; BT 10 nm, (a) global wires and (b) semiglobal wires.
=
2009 with ALD barrier. With less conformal barrier deposition technologies, this cross over can occur as early as year 2004 (Fig. 7). Even with the best barrier deposition technology of ALD, under conservative operation temperatures of 100 C and for a reasonable copper value of approximately 0.5 [7], in year 2011, the effective resistivity rises to 2.9, 3.45, and -cm, for global, semiglobal, and local interconnects, 3.95 respectively (Fig. 10). The large increase in resistivity with temperature is quantified in Fig. 10, which depicts resistivity versus year at room temperature and at 100 C. Since in the future, the exact temperature of the interconnects would highly depend on the thermal conductivity of the packaging and the low dielectric constant materials, these technologies can play a pivotal role in dictating performance. The resistance per unit length was evaluated by dividing the effective resistivity by the appropriate roadmap-suggested cross-section area. Since the concept of effective resistivity already considers the barrier, it enabled us to use the aforementioned simple division. Fig. 11 shows the resistance per unit length under different scenarios for semiglobal and
(b) Fig. 11. Cu wire resistance per unit length for ALD barrier under different P and BT. Temp. 100 C, (a) global interconnects and (b) semiglobal interconnects.
=
global interconnects. As expected, semiglobal lines suffer a larger impact. However, impact on global wires, which are of most significance from delay perspective, was substantial as well. For global wires, starting from the year 1999 (180 nm technology node), values of 30 /mm, resistance per unit length value reaches 528 /mm in year 2011 (50 nm technology node) under a realistic scenario. This scenario takes value of 0.5, temperature of 100 C and uses the best a available, ALD, technology with barrier thickness (BT) of 10 -cm, yielded nm. In comparison, the ideal resistivity of 1.7 an underestimated resistance per unit length value of 310 /mm in year 2011. Table I shows the impact of technology on resistance per unit length values for global, semiglobal and local wires in year 2011 and 2014. It only depicts a subset of possible scenarios originating from practical constraints. In Table I the wire temperature of 100 C and the barrier deposition technology of ALD was assumed. It seems likely that ALD barrier technology would be fully commercial by that time. If a different technology is used the resistance values
596
IEEE TRANSACTIONS ON ELECTRON DEVICES, VOL. 49, NO. 4, APRIL 2002
TABLE I INTERCONNECT RESISTANCE PER UNIT LENGTH AT 100 C WITH ALD BARRIER AT FUTURE TECHNOLOGY NODES
would be much higher consistent with the resistivity trends. It is obvious from Table I that in comparison with a nominal barrier 0.5, a barrierless technology thickness of 10 nm and value of 0.5 would give a much bigger resistance with a 1 with a 10 improvement as apposed to an interface with nm barrier thickness. VI. SUMMARY In this work, we have modeled resistivity of copper interconnects and described how it will vary as the interconnect dimensions are aggressively scaled in the future. In particular, the modeling is done in the light of technology and reliability governed barrier and the surface scattering effects, which will become progressively dominant and negatively impact the effective copper resistivity in the future. The technological and reliability constraints considered in this work are barrier thickness, barrier profile, interconnect operation temperature, and the barrier–copper interface quality. The resistivity trends are obtained at all three tiers of interconnects, and comparisons are made with aluminum interconnects. Resistance per unit length values, at the 35 nm technology node, using reasonable technological constraints, were found to be 90%, 145%, and 192% greater than that obtained using ideal copper resistivity for global, semiglobal and local wires, respectively. These trends will further degrade at higher temperatures. Although a temperature of 100 C is assumed for the aforementioned values, the interconnect temperature in the future could be higher. Electron scattering through grain boundaries, although not considered in this work, will further increase interconnect resistance. A barrierless technology is found to improve effective copper resistivity more significantly as opposed to 1. improvement obtained by developing an interface with The resistance per unit length is found to be much worse for any barrier deposition technology less conformal than ALD. It is also shown that because these effects are less dominant in aluminum, at some point copper-effective resistivity will become higher than that of aluminum. This crossover will happen faster for smaller dimensioned local and semiglobal wires. REFERENCES [1] M. T. Bohr, “Interconnect scaling-the real limiter to high performance ULSI,” in IEDM Tech. Dig., 1995, pp. 241–244. [2] K. C. Saraswat and F. Mohammadi, “Effect of interconnection scaling on time delay of VLSI circuits,” IEEE Trans. Electron Devices, vol. ED-29, pp. 645–650, 1982.
[3] H. Bakoglu, Circuits, Interconnections and Packaging for VLSI. Reading, MA: Addision-Wesley, 1990. [4] S. Takahashi, M. Edahiro, and Y. Hayashi, “A new LSI performance prediction model for interconnection analysis of future LSIs,” in Proc. Asia and South Pacific Design Automation Conf., Yokohama, Japan, Feb. 10–13th, 1998, pp. 51–56. [5] The International Technology Roadmap for Semiconductors (ITRS), 1999. [6] L. I. Maissel and R. Glang, Eds., Handbook of Thin Film Technology. New York: McGraw-Hill, 1970, ch. 13. [7] F. Chen and D. Gardner, “Influence of line dimensions on the resistance of Cu Interconnections,” IEEE Electron Device Lett., vol. 19, pp. 508–510, Dec. 1998. [8] A. F. Mayadas, M. Shatzkes, and J. F. Janak, “Electrical resistivity model for polycrystalline films: The case of specular reflection at external surfaces,” Appl. Phys. Lett., vol. 14, p. 345, 1969. [9] P. Kapur, J. P. McVittie, M. Deal, and K. C. Saraswat, “Surface morphology of metallo–organic chemical vapor deposition copper films for seed layers in integrated circuit interconnects,” in Proc. 1st Int. Conf. Advanced Materials and Processes for Microelectronics, San Jose, CA, 1999. [10] K. Banerjee, A. Mehrotra, A. Sangiovanni-Vincentelli, and C. Hu, “On thermal effects in deep sub-micron VLSI interconnects,” in Proc. 36th ACM Design Automation Conf., San Francisco, CA, 1999, pp. 885–891. [11] K. Fuchs, “Conduction electrons in thin metallic films,” Proc. Cambridge Phil. Soc., vol. 34, p. 100, 1938. [12] E. H. Sondheimer, “The mean free path of electrons in new metals,” Adv. Phys., vol. 1, p. 1, 1952. [13] D. S. Campbell, The Use of Thin Films in Physical Investigations. New York: Academic, 1966, p. 299. [14] J. P. McVittie, D. S. Bang, J. S. Han, K. Hsiau, J. Li, J. Zheng, and K. C. Saraswat, SPEEDIE 3.0 Manual. Stanford, CA: Stanford Univ., 1995. [15] D. S. Bang, J. P. McVittie, M. M. IslamRaja, K. C. Saraswat, Z. Kirvokapic, S. Ramaswami, and R. Cheung, “Profile modeling of collimated Ti physical vapor deposition,” in Proc. 10th Symp. Plasma Processing, ECS Proc., vol. 94-20, San Francisco, CA, 1994, p. 557. [16] D. S. Bang, J. P. McVittie, K. C. Saraswat, J. A. Iacponi, J. Gray, Z. Krivokapic, and K. Littau, “Simulation studies of TiN PVD and CVD thin films for contact/via liners,” in Modeling and Simulation of Thin-Film Processing, Proc. Mat. Res. Soc. Symp., Littau and D. J. Srolovitz, Eds., Apr. 1995, vol. 389, pp. 173–179. [17] P. Kapur, D. S. Bang, J. P. McVittie, and K. C. Saraswat, “Method for angular sputter yield extraction for high-density plasma chemical vapor deposition simulators,” J. Vac. Sci. Technol. B, vol. 16, no. 3, 1998. [18] N. W. Ashcroft and N. D. Mermin, Solid-State Phys.. Philadelphia, PA: Saunders, 1976.
Pawan Kapur was born and raised in Kanpur, India. He received the B.S. degree in physics and mathematics from Moravian College, Bethlehem, PA, in 1995, where he graduated summa cum laude, and the M.S. and Ph.D. degrees in electrical engineering from Stanford University, Stanford, CA, in 1998 and 2002, respectively. The focus of his current research is on interconnect modeling for integrated circuits, which includes exploring limitations of both electrical interconnects and assessing the advantages of alternate technologies such as optical interconnects.
KAPUR et al.: TECHNOLOGY AND RELIABILITY CONSTRAINED FUTURE COPPER INTERCONNECTS—PART I
James P. McVittie (M’75–SM’81) received the B.S.E.E. degree from the University of Illinois, Urbana, in 1967, and the M.S.E.E. and Ph.D. degrees in 1968 and 1972, respectively, from Stanford University, Stanford, CA. From 1972 to 1974, he was Member of Technical Staff with the Lincoln Laboratory, Massachusetts Institute of Technology, Lexington, where he worked on IV-VI materials for lasers and detectors. In 1974, he joined the Xerox Palo Alto Research Center, Palo Alto, CA, where he worked on MOS interfaces and CCDs. He became a permanent Member of Research Staff of Stanford’s Integrated Circuit Laboratory research staff in 1981, where he worked on CMOS process development. Since 1985, he has headed a research group responsible for process development and modeling in CVD and plasma etch processes. His present research interests include plasma etching, CVD, metallization, oxidation, and semiconductor devices. He has co-authored more than 150 technical papers. Dr. McVittie was a Chairman of the Northern California Chapter of the American Vacuum Society in 1991. He was also Chairman of the Bay Area Plasma Etch User’s Group in 1989–1990, and the Northern California Electronic Materials Symposium in 1987. He is a past member of the Program Committees for the International Electron Device Meeting, International Reliability Physics Symposium, the International Symposium on Plasma Process-Induced Damage (P2ID), and various American Vacuum Society conferences. He is the 1996 recipient of the Tegal Thinker Award for outstanding work in the area of plasma etching and the 1998 recipient of the International Symposium on Plasma Process-Induced Damage Award.
597
Krishna C. Saraswat (M’70–S’71–SM’85–F’89) received the B.E. degree in electronics and telecommunications from Birla Institute of Technology and Science, Pilani, India, in 1968, and the M.S. and Ph.D. degrees in electrical engineering from Stanford University, Stanford, CA, in 1969 and 1974, respectively. During 1969–1970, he worked on microwave transistors at Texas Instruments, Dallas, TX, and since 1971, he has been with Stanford University, where he is currently a Professor of Electrical Engineering and Associate Director of the NSF/SRC Engineering Research Center for Environmentally Benign Semiconductor Manufacturing. During 1996–1997, he was the Director of the Integrated Circuits Laboratory, Stanford University. He is working on a variety of problems related to new and innovative materials, device structures, and process technology of silicon devices and integrated circuits. Special areas of his interest are: new device structures for scaling MOS transistors to nm range; 3-D ICs with multiple layers of heterogeneous devices; thin-film technology for VLSI interconnections and contacts; ultrathin MOS gate dielectrics; and development of tools and methodology for simulation and control of etching, deposition, and rapid thermal process technologies. His group has developed several simulators for process, equipment, and factory performance simulations such as SPEEDIE for etch and deposition simulation, SCOPE for IC factory performance simulations, and a thermal simulator for RTP equipment design. Prof. Saraswat is a member of The Electrochemical Society and The Materials Research Society. He was given the Thomas D. Callinan Award by The Electrochemical Society in May 2000 for his contributions to dielectric science and technology. He was co-editor of the IEEE TRANSACTIONS ON ELECTRON DEVICES during 1988–1990. He has authored or co-authored over 370 technical papers.