TECHNOLOGY MANAGEMENT PROCESS OF THE PART AND COMPONENT SUPPLIERS IN THE TURKISH AUTOMOTIVE INDUSTRY Gündüz Ulusoy, Ahmet Özgür, Taner Bilgiç, Erbil Payzin, Ali Riza Kaylan Department of Industrial Engineering, Bogaziçi University, Bebek, TR-80815 Istanbul, Turkey Tel. 90 212 2631540 (ext. 2079); Fax 90 212 2651800; e-mails:
[email protected],
[email protected],
[email protected] ABSTRACT The first objective of this study is to describe and evaluate technology management practices in the Turkish automotive suppliers industry. The second objective is to propose practices, techniques, and approaches to improve the level of technology management and thus turn technology into a competitive weapon. The investigation is organized within the framework of a process model for technology management that consists of technology identification, selection, acquisition, exploitation, protection, and abandonment. A comprehensive questionnaire addressing all phases of this process is developed and the results of 21 companies are presented. INTRODUCTION This paper is a summary of parts of an empirical study on technology management practices in the Turkish auto parts industry [1]. The study has been sponsored by the Association of Turkish Industrialists and Businessmen (TUSIAD) and carried out with the cooperation of the Association of Automotive Part and Component Suppliers (TAYSAD). Automotive industry is a global industry constituting a significant proportion of global industrial production and international trade. In 1997, the worldwide production amounted to 54.4 million motor vehicles comprised of 37.7 million automobiles and 15.3 commercial vehicles. In 1997, the global exports of motor vehicles reached 20.3 million representing an annual increase of 11.7% over the previous year. In monetary terms, this equals to an amount of 500 billion USD and represents 10.5% of global exports. It is estimated that the exports of vehicle components amounts to 500 billion USD. Automotive industry is in a specific phase of its evolution. It is possible to observe the dominant design of car among the offerings of various manufacturers. There exist minor differences among the vehicles of the same category. Ealey and Bermudez [2] suggest strategies that can be used to build brand image and perceived value and to avoid the transformation of automobiles into a commodity. Price is the principal basis of competition in the majority of market segments. The recent mergers in the industry lead to a decline in the number of manufacturers. This trend is expected to continue. Most of the manufacturers start to develop global manufacturing and distribution strategies. One such strategy is to dedicate a certain plant to the manufacturing of a particular model. This creates the opportunity to maximize the productivity and efficiency of these plants through specialized equipment and long production runs. These developments have obvious implications on suppliers. The number of suppliers declines, too. There were 30,000 parts suppliers through the world in 1988 and only 4,060 survive today. Within the next five years, it is expected that 26 truly global supplier companies will dominate the industry [3]. Vehicle manufacturers give larger contracts to fewer suppliers. This allows the suppliers to make volume savings and to install specialized equipment, the cost of which can only be justified over a long production run. Despite the higher costs incurred in both R&D and in the manufacturing of better quality components, the suppliers are forced continually to reduce their prices. Most contracts issued by the vehicle manufacturers for components incorporate price reduction clauses [4]. 1
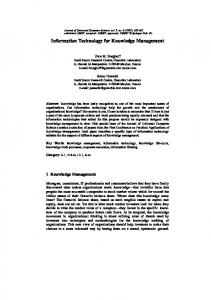
In Turkey, the automotive industry is the third biggest manufacturing sector. Twenty one companies operate in the sector. Except for one tractor manufacturer all other companies manufacture under foreign licenses. In 1997, the total amount of sales was 5.6 billion USD equaling a total of 400,000 vehicles. The total number of employees is about 30,000. Automotive suppliers sector is an integral part of the automotive industry. At present, there are approximately 1300 Turkish automotive supplier companies employing approximately 50,000 people. The total amount of sales for 1997 was 3.9 billion USD. TAYSAD is the principal representative of the sector. It has around 170 member companies that employ 35,000 people. In relatively short time and at a high pace, Turkey found herself in global competition. The requirements of global competition on the industry have been quite challenging and they are guiding the business strategies of the companies. Developing competence in product and production technologies stands out as a candidate for being a major competitive advantage. Hence the management of technology is a field that attracts increasing attention in the last years in Turkey. In the literature, numerous approaches for the management of technology are discussed. These models aim to provide a structure positioning technology strategy into the overall framework of competitive strategy. Probert and Gregory [5] propose a process model for organizing technology management activities. It is indeed appealing to employ a process model since it is expected that in the future, process-based organizations will become widespread [6]. The model considers technology management as a process including the subprocesses of identifying, selecting, acquiring, protecting, and exploiting technologies. METHODOLOGY The first objective of this study is to describe and evaluate technology management practices in the Turkish automotive suppliers industry. The second objective is to propose practices, techniques, and approaches to improve the level of technology management and thus turn technology into a competitive weapon. The investigation is organized within the framework of a process model including the processes of technology identification, technology selection, technology acquisition, technology exploitation, technology protection, and technology abandonment (cf. Figure 1). A comprehensive questionnaire addressing all phases of the technology management process is developed.
Technology Identification
Technology Selection
Technology Acquisition
Technology Stock
Technology Abandonment
Figure 1. Technology Management Process Model The study encompasses a sample of 25 companies that are selected jointly with TAYSAD. The association has 170 members in total. The companies were chosen by considering their subsectors and annual turnover. The subsectors are electrical components, metal removing, casting, forging, seating and instrumentation. In each subsector, the first four or five companies with the highest turnover were selected. Firstly, the selected companies were contacted and given information about the objectives and methodology of the study. Of the companies contacted only one refused to participate. Site visits were arranged with the remaining 24 companies. The agenda of site visits consisted of a brief explanation of scope and objectives of the study, followed by information about the
2
content of the questionnaire and a plant tour. Then, the questionnaire was left to be filled in and sent back to the project team. Return of the questionnaires took about 20 days on the average and 21 questionnaires have been returned. Initial analysis of the results has provided the basis for the development of another questionnaire to be employed in the structured interviews to follow. Interviews have been conducted with the top management in 16 of the 21 companies. Of the companies surveyed, 52% are independent Turkish suppliers. These are the companies most challenged by the transformation in the industry and the recent developments in the Turkish automotive market. Thirty nine per cent are joint-ventures with proportion of foreign participation ranging between 4% and 80%. The remaining 9% of the companies are wholly owned subsidiaries of multinational supplier companies. It is expected that foreign capital presence in the Turkish suppliers sector will gradually increase. Recent developments foster this process. The sales of the companies surveyed range from 4m USD to 140m USD. The average is 41m USD. Between 1995 and 1997 the average annual sales growth is 7%. In the period examined the companies exhibited a moderate performance increasing their exports, on the average, by 5% annually. Majority of the companies (66%) are SME’s with an average number of employees 610 in 1997. Within the period from 1995 to 1997 the increase in the average number of workers is 10%. This means that the increase in the number of employees was higher than the sales increase which might indicate decreasing labor productivity. BUSINESS STRATEGY AND TECHNOLOGY STRATEGY Impact of competitive priorities on technology strategy Business strategy constitutes the reference point for all company activities. Business strategy identifies the products and markets that will be exploited in the achievement of business objectives. It also defines the competitive advantages that will be pursued. Technology strategy identifies the contribution of technology to the competitive advantages pursued, and the means to increase that contribution. Different technologies offer different benefits with regard to productivity, quality, flexibility and timeliness. Importance attributed to different competitive priorities by the supplier firms is summarized in Table 1. Dependability arises as the factor with the greatest importance for the suppliers. It is closely followed by aspects of quality such as conformance, reliability and durability. Dependability and quality are areas where much progress has been recorded in the last five to ten years. Recently these factors have turned into qualifying criteria. All technological choices should comply with the requirements of these criteria. Other two aspects of quality; design quality and image / brand are not much emphasized because some of the firms do not posses design capabilities. Product flexibility encompasses product innovativeness which is the ability to produce new or modified products cheaply and quickly, and customer responsiveness which refers to the ability to respond to customers’ desires quickly regarding the characteristics of the product [7]. Product flexibility is emphasized by 75% of the companies. This reflects of the effect of the accelerating pace of product innovation in the automotive industry. Product flexibility is especially important for suppliers that manufacture parts and components which affect the perception of consumer, because these components are redesigned for each new model. Along with organizational arrangements, product flexibility has clear technological implications. The ability to manufacture products quickly in different mixes and volumes, that is, process flexibility is of special significance for Turkish automotive suppliers. The diversity of customer base and limited sales volumes make flexibility a prerequisite for manufacturing technologies. On the other hand, flexibility has a cost, and this cost is an additional factor to
3
overcome when competing on low prices. The ratio of companies that strongly emphasize low price is 15%. Competitive Priorities Low price Product quality Design quality Conformance to specifications Durability Reliability Image / brand Dependability Ability to deliver at the required place Ability to deliver at the required time Ability to deliver at the required quantity Flexibility Product flexibility Process flexibility Customer services
Do not agree 10
Partly agree 75
Strongly agree 15
5 0 10 5 14
45 14 19 14 24
50 86 71 81 62
0 0 0
25 14 10
75 86 90
0 10 5
25 29 35
75 62 60
*Answers to the question “Please indicate the importance devoted to the cited factors.”
Table 1.
Importance of Competitive Priorities (%)
There exists a dilemma for the Turkish suppliers. They are forced to remain flexible while supplying parts at decreasing prices and volumes. Increased flexibility seems to be a viable solution for this problem. However, the cost incurred for achieving flexibility is very hard to measure and is usually overlooked. Another solution would be, reducing the need for flexibility by keeping a limited customer portfolio and product range. Some good practices for developing and executing technology strategy Business strategy provides the basis for the development of functional strategies. These strategies must all support and contribute to the business strategy of the company in order for a firm to compete successfully. Intense competition and technological advances make technology an essential component of strategic management. Development of a technology strategy is the first step of the incorporation of technological aspect into the business strategy. It is identified that companies that succeeded in using technology for strategic advantage exhibit consistent and stable strategic management [8]. Among the Turkish suppliers that were surveyed, 48% strongly emphasized that they have consistent and stable strategic management. The proportion of companies reporting that they have a systematic process for technology planning and strategy development is even lower, only 33%. This fact illustrates a major weakness. Having a systematic strategic planning process is found as having a significant impact on the company performance. Frohman [9] indicates that in the companies where technology is a high priority, the planning systems incorporate the technology plan as an integral part of the business plan. On the other hand, the development and use of formal technology planning and strategy development strongly relate to R&D performance [10]. One of the practices that are recommended for the alignment of business strategy and technology strategy is the participation of senior marketing and technology managers to strategic planning activities [10] [11]. Additionally, in the formulation of technology strategy it is important to utilize customer feedback [10]. It was found that these good practices are not widespread among the Turkish supplier companies.
4
Having a chief technology officer near the top of the organizational ladder is another factor that facilitates the incorporation of technological issues into strategic decision-making. In Japan, 95% of the chief technology officers are members of boards of directors [10]. The representation of “voice of technology” at the top through direct face-to-face linkages is of critical importance. Of the Turkish supplier companies surveyed, 85% indicated that the highest position in charge of product and process technologies reports directly to the general manager. Furthermore, 55% of top level managers have an engineering background. The successful management of technology requires a willingness to take a long-term view for technology accumulation within the company [12]. The development and diffusion of product and process technologies may require years. This fact makes long-term technology planning a prerequisite for a successful technology strategy. The companies that participated to the survey were asked to state the general planning horizon of their company. The average planning horizon is found to be 3.3 years. This is quite a short planning horizon. The major reason that inhibits long-term planning is the unstable macroeconomic environment in Turkey. Short planning horizon is a barrier especially for independent Turkish companies that strive to develop their own technological base. TECHNOLOGY IDENTIFICATION Technology identification is the first sub-process of the technology management process. Identification and evaluation of the technologies that may have a significant influence on the firm’s current and future activities is the primary objective of technology intelligence activities. Technology intelligence activities of the companies surveyed were evaluated in terms of formulation of information needs, selection of information sources, data collection, and evaluation, storage and communication of information. Since the effectiveness of technology intelligence activities is strongly dependent upon the underlying organizational structure, practices related to organization of technology intelligence activities among the surveyed companies was also a subject of interest in our study. Formulation of Needs for Technology Monitoring Among the companies that have been surveyed, 57% strongly emphasize that they monitor the developments in the field of their existing technologies and 52% strongly emphasize that they monitor technologies planned for future. The ratio of companies that monitor the technologies of competitors is substantially lower, at 29%. These findings reveal that about half of the companies either do not monitor technological developments in the relevant fields or do it in an ad hoc manner. However, informal information gathering may give a false sense of safety. About half of the companies surveyed (52%) emphasize the availability of personnel in charge of technological monitoring. On the other hand, the use of consulting firms for technological monitoring is almost non existent. Selection of Information Sources Table 2 ranks the various different sources of technological information used by the companies surveyed, in terms of relative frequency of usage and the relative benefit provided from the information obtained through that source type. The most frequently used sources of information on technology includes trade fairs, customers, equipment suppliers, scientific and technical publications, affiliated companies, and product benchmarking. Sources such as equipment suppliers and customers (i.e. vehicle manufacturers) can provide information regarding new and emerging technologies in addition to existing technologies. Trade fairs and product benchmarking on the other hand, are sources of information about commercialized product and production technologies. Hence, information obtained from these sources will be of higher value to companies pursuing a 5
technology follower strategy, such being the case for majority of the companies operating in the sector in Turkey. Disclosed patents seem to be the least frequently used source of information. With to the recent availability of world wide patent search facilities over the Internet such as the European Patent Organization’s new esp@cenet patent search facility (available at http://ep.dips.org), we may expect the industry to resort this valuable information source more frequently in the future. As to the relative benefit derived from information obtained through different types of sources, product benchmarking is rated highest among those companies that practice it, followed by information obtained from customers and equipment suppliers. It is notable that, reverse engineering, a practice that does not seem to be widely popular within the sector is found to provide beneficial information by those companies who practice it. Information Source Customers Equipment suppliers Trade fairs Related companies Scientific and technical publications Product benchmarking Material suppliers Dealers Scientific and professional meetings Reverse engineering Chambers of commerce / industry Companies from other sectors Universities Professional associations Consulting companies Disclosed patents Table 2.
Frequency Never Sometimes 10 43 0 57 5 52 14 43
Often 48 43 43 43
Little 16 10 15 22
Contribution Moderate Great 26 58 43 48 40 45 28 50
14
48
38
22
50
28
29 14 38
33 62 38
38 24 24
0 6 23
40 67 38
60 28 38
10
71
19
26
47
26
57
29
14
11
56
33
52
38
10
56
33
11
48
48
5
18
73
9
48 67 52 75
48 29 48 25
5 5 0 0
36 14 11 20
55 71 67 60
9 14 22 20
Sources of information used for technology intelligence
Evaluation, Storage and Communication of Information Of the companies participating in the survey, 38% strongly emphasized that they evaluate the impact of new and emerging technologies on the sector and on their company. The ratio of companies that evaluate the commercial potential of new and emerging technologies is 43%. These results indicate the high vulnerability of the remaining companies against new and emerging technologies. Fourteen per cent of the companies participating to the survey indicated that they have procedures that define the information analysis process. Compiled information is reported and sent to relevant personnel in 48% of the companies. The proportion of companies that use computer systems for storage of gathered information was found to be a rather low figure of 24%.
6
Technology Intelligence Organization The organizational arrangements aiming systematic technology intelligence are not widespread among the surveyed companies (Table 3). This somewhat unstructured and ad hoc approach to technology identification is expected to have a negative impact on the overall technology management process in these companies. In fact, 57% of the companies surveyed indicated the absence of or deficiency in their technology intelligence organization as a major obstacle to successful technology selection. Practice Important information is periodically reviewed and if necessary follow up activities are initiated. Technology intelligence function is explicitly defined and included in the job description of the related personnel The services provided by the technology intelligence function are known by the other functions Technology intelligence function has clearly defined objectives Technology intelligence activities are budgeted The performance of technology intelligence function is regularly revised Table 3.
Do not Partly agree agree 19 57
Strongly agree 24
43
33
24
43
33
24
57
29
14
57 57
33 38
10 5
Practices related to technology intelligence organization (%)
TECHNOLOGY SELECTION Technology selection involves selection among technological alternatives identified through technology identification process. It is a multifaceted and complex process. Technology selection becomes especially complex in the choice of technologies requiring large and long-term investments. Economic analysis also plays an important role in technology selection. The principal factors of technology selection are business and technology strategy, company infrastructure and environmental factors. The effect of business and technology strategy Business strategy should be the starting point of all company activities. All major decisions should comply with the business strategy and serve to the business objectives set. The lack of a long term business strategy and of a formal strategic planning process is identified as a differentiating factor between successful and less successful companies [13][14]. Undefined technology strategy is a barrier to successful technology selection because it establishes the connection between technology choice and business strategy. Technologies selected by a company need to be consistent with its technology strategy. Furthermore, the alignment of business strategy and technology strategy is a major research area. Business strategy affects the strength of the relation between company performance and particular technology strategies [15][16].
Factor Short planning horizon Undefined business strategy
Does not Constitutes Constitutes constitute a a great a barrier barrier barrier 25 55 20 25 65 10 7
Undefined technology strategy Poor alignment of business and technology strategy Table 4.
35
50
15
35
55
10
Barriers to successful technology selection
The assessment of the barriers to successful technology selection gives clear insights (Table 4). Undefined business strategy and short planning horizon are considered by 75% of the companies as a barrier or a great barrier. The respective proportion for undefined technology strategy is 65%. The companies studied also face difficulties in the process of alignment of business and technology strategies. Sixty five percent of them view it as a barrier or a great barrier to successful technology selection. The effect of product and market characteristics The choice of process technology depends on the characteristics of the product and its market [17]. The impact of following factors is evaluated. Lot Sizes and Product Line Breadth. Lot sizes significantly influence the choice of process technologies. Lot sizes determine the level of flexibility that is required from the manufacturing system. Majority of the participating companies (60%) emphasize the great impact of lot sizes on their technology choices. Of these companies, 60% describe the reason as the need to produce in small lots. Product line breadth is another factor that influences the choice among technological alternatives. Broad product line increases the need for flexible manufacturing operations. It also increases the administrative costs. The companies participating to the survey are aware of the significant impact that product line breadth has on their choices of manufacturing technology. The proportion of companies that indicate great impact is 65%. Furthermore, the major reason for this effect is the wide product line they carry. Customer Relationships and Product Innovation Rate. The stability and duration of company-customer relationships are key elements that determine the choice of manufacturing technology [18]. This finding is also confirmed by the results of the survey among Turkish automotive suppliers. Eighty five percent of the companies indicates that customer relationships have great impact on their technology choices. In most companies (70%), customer demands influence the selection process. Long-term agreements with customers are another factor that affects the decision of a number of companies (20%). Market Characteristics. The demand for automotive products is highly elastic in Turkey. Political and macroeconomic developments directly affect the demand. Sixty five per cent of the companies indicate that demand stability plays a major role in their decisions regarding technology. Unstable demand arises as a major inhibitor for all company activities including technology selection. Market growth is another important factor affecting selection. Some sub-sectors experience stagnating or shrinking market. The proportion of companies indicating this kind of unfavorable market condition is 56%. Political and economic conditions influence particularly the companies that supply domestic vehicle manufacturers. Instability in these conditions leads to considerable fluctuations in demand. These findings are confirmed by the opinions expressed regarding market related barriers to successful technology selection. Political instability is a major cause of the fluctuations in the demand for motor vehicles in Turkey. These factors are strongly emphasized as constituting a barrier to successful technology choice decisions. Inadequate market information and poor analysis of market conditions are not conceived as significant barriers.
8
The effect of company resources A company’s resources define the strategy it can pursue [19]. Therefore, capital and human resources are expected to impact technology selection decisions. Factor Financing requirements Cash flow The level of workers’capabilities The level of engineering capabilities The level of management capabilities The level of quality infrastructure Company culture Table 5.
No Impact 10 15 40 35 30 35 25
Little Impact 35 40 45 20 50 25 20
Great Impact 55 45 15 45 20 40 55
The effect of company resources
Financing requirements are identified as having great impact, by 55% of the companies. Taking into account the high interest rates of financing, this ratio is not very high. The reason for this may be that companies do not refer to external financing and try to meet investment expenditures from internal sources. The level of workers’ capabilities and the level of management capabilities do not appear to have a significant impact on the selection among technological alternatives. On the other hand, engineering capabilities are more emphasized as a factor affecting technology selection decisions. This fact also makes clear the need for continuously upgrading the engineering skills through training. Company culture is a factor with highly emphasized influence on technology choice. One of the elements of company culture is the attitude of management towards technology. In some cases that attitude becomes the deciding factor in technology selection. The impact of quality infrastructure is moderate. A strong quality infrastructure may support more advanced technologies. Role of economic analysis in technology selection The use of economic analysis methods is found to be not widespread among the surveyed companies. The most frequently used method is pay back period analysis. It is followed by net present value analysis and internal rate of return analysis. Approximately one third of the companies reported that they never use these techniques. Of the qualitative factors that need to be included in the evaluation of the technological alternatives, the increase in quality is the most emphasized. This is an expected result since quality is one of the dominating competitive priorities and quality improvement is the principal objectives of many technological investments. Customer satisfaction is the second most frequently evaluated factor in the selection of technologies. This is partly a result of the explicit technological demands of customers. The low utilization of the economic analysis methods can be explained by fact that strategic considerations dominate such decisions. The proportion of companies that emphasize strategic issues in the selection of technologies requiring large investment is 50%. In the unstable macro-economic environment in Turkey, accurate identification of economic benefits of a given technology investment is even more difficult. Therefore, strategic analysis is more appropriate for this type of technology selection decisions. TECHNOLOGY ACQUISITION The balance between internal technology development and external acquisition, the emphasis on R&D activities, and relative technological standing are principal ingredients of technology strategy. In general, within a company the two major sources of technology are 9
R&D/Engineering and the production unit. Mostly, R&D organization concentrates on product technologies, while production technologies are the primary responsibility of the production unit. On the other hand, since no company can develop all the technologies it uses, external technology acquisition is also as important. There could be diverse sources for external acquisition of technology. Internal Sources for Technology Acquisition The companies in the sector mostly acquire technologies by internal development or purchase of technology embedded in products, materials, equipment, and processes. Although R&D/Engineering is utilized at a slightly lower rate (86%, compared to 90% Production use), it is deemed very efficient by the majority (63%, compared to 42% of production). The principal reason for internal development is the willingness to gain expertise in a particular technology (Table 6). Reason The company wishes to gain expertise in a particular technology R&D area is close to existing technical capabilities Internal R&D is less expensive than acquisition from external sources The company wishes to keep its technological thrust confidential The company culture fosters the belief that the only good technology is developed internally Table 6.
No impact
Little impact
Great impact
0
18
82
6
35
59
18
35
47
18
35
47
59
41
0
Reasons for acquiring technology from internal sources (%)
Despite the fact that internal development is practised by 62% of the companies R&D expenditures are quite low (Table 7). In 1997, 64% of the companies reported R&D expenditures lower that 0.5 per cent of that year’s sales. Only 12% of the companies reported R&D expenditures greater than 1%. The change over the past three years in negligible. The average annual increase is three per cent. Table 7 depicts R&D expenditures to total sales ratio of the surveyed companies in three groups. In the first group there are companies with number of employees less than 250, the second group contains companies with 251 and 500 employees and group three contains companies with more than 500 employees. In each group there are seven companies. The same ratio is distinctively higher in larger companies. Group Group I Group II Group III Total Table 7.
1995 0.5 (1.3) 0.1 (6.8) 1,3 (9.3) 0.7 (6.1)
1996 0.5 (2.1) 0.1 (9.1) 1.2 (11.0) 0.6 (7.7)
1997 0.3 (3.9) 0.3 (9.3) 1.0 (10.9) 0.5 (8.3)
R&D expenditures (Equipment purchase costs) to total sales
The comparison of R&D expenditures with external equipment and technology acquisition expenditures reveals a great dependence on external technology.
10
External Sources for Technology Acquisition While trade fairs and conferences stand out as the major technology source, University laboratories and R&D institutions are distinctively not utilized (Table 8). Per cent of usage
Source Trade fairs, conferences Publications Customer companies Related companies Supplier companies Consulting companies Other companies University laboratories R&D institutions Table 8.
95 86 80 76 70 45 38 14 10
Efficiency (per cent) Not Moderately Very efficient efficient efficient 16 47 37 6 76 18 0 63 38 0 44 56 14 57 29 11 89 0 13 75 13 0 100 0 0 50 50
Use and efficiency of external technology sources
Lack of skills, over occupation of R&D function with incremental improvements, and the need to reduce the uncertainties in the performance of new technology, are the factors leading to acquisition of externally developed technologies. TECHNOLOGY EXPLOITATION, PROTECTION, AND ABANDONEMENT Exploitation One might consider four major ways of technology exploitation: employing in its own processes or products; contracted-out manufacture or marketing; joint-venture; and licenseout. A company’s relative self-confidence and competence in the technology development process influence the exploitation decisions. With lower competence and confidence, the external exploitation of technology decreases. The study shows that, to a great extent, Turkish companies exploit the technologies available in their stock internally and although many companies have developed their own technological competencies, they lack experience in the external exploitation of these. Operational result
No change
Increase in conformance quality Reduction in production lead time Increase in manufacturing capacity Increase in production precision Increase in the time for new product development Cost reduction Increase in flexibility Decrease in setup times Increase in safety Decrease in lot sizes Table 9.
0 10 0 15 20 10 20 10 15 45
Moderate improvement 35 30 48 40 40 52 45 57 60 35
Results of new technology use - quantitative (%)
11
Major improvement 65 60 52 45 40 38 35 33 25 20
It appears that the greatest impact of new technology on operational results come from production technologies and mostly as reduction in the production cycle time and as increase in the manufacturing capacity and flexibility (Table 9). Protection The technology can diffuse very fast and in so many different ways that one needs to slow down this process not to loose competitive edge in the market. The study shows that companies in the sector do not utilize legal protection methods such as patenting and design registration. Furthermore, other protection mechanisms such as confidentiality assurance, lead time advantage due to early introduction, and keeping the related personnel in the company are considered as “moderately efficient”. Lack of distinctive technological competencies and proprietary technologies appears to be the reason for not utilizing legal protection methods. With the creation of proprietary technologies the emphasis on protection methods will inevitably increase. Abandonment The stimulus for phasing out a technology can be classified into two groups: technology push–the emergence of new and better technologies, and market pull–market demand for new technological solutions. Market pull and technology push are interdependent. Market demand triggers new technological endeavors, while technological innovations raise new demands. The findings are: the cases of technology abandonment are not widespread. The small number of cases reveal the explicit demands of customers and the decrease in the demand of particular products as the two major market-driven factors for phasing-out. Among the technology driven factors for abandonment, the shift to technologies providing cost advantage is the principal one. Legal and contractual requirements impact the abandonment of product technologies. Inability to identify technological alternatives is the most emphasized barrier to successful technology abandonment. Table 10 lists major factors for the abandonment of product technologies due to market pull. Two outstanding factors are decrease in the demand for products containing the technology and explicit demands of institutional customers to shift to new technologies. Importance (per cent) Constitutes a reason Less Very Important (per cent) important important
Factor Decrease in the demand for products containing the technology Explicit demands of institutional customers to shift to new technologies Shift of competitors to new technologies Abandonment of existing technologies due to becoming: Inadequate in regard to technical specifications Cost disadvantageous Inadequate in regard to environmental regulations Inadequate in regard to occupational safety Inadequate in regard to consumer safety
86
0
33
67
71
0
40
60
43
0
100
0
63
0
40
60
63
0
80
20
33
100
0
0
25
0
50
50
14
0
0
100
Table 10. Abandonment of product technologies - market pull 12
Shift to technologies providing cost advantage is the prevalent reason for phasing-out of product technologies (Table 11). Cost reduction is the focal point of new product technologies in the automotive industry. This factor is identified as very important in the abandonment decisions of two thirds of the companies. Technologies providing advantages in quality and flexibility (both in new product development and in production) are also favored as reasons to abandon a product technology. Importance (per cent) Constitutes a reason Very Less Important (per cent) important important
Factor Shift to technologies providing cost advantage Shift to technologies providing advantages in various aspects of quality Shift to technologies providing flexibility in new product development Shift to technologies providing flexibility in manufacturing
75
0
33
67
57
0
50
50
57
0
75
25
57
0
75
25
Table 11. Abandonment of product technologies - technology push CONCLUSIONS Conclusions are summarized below. These conclusions carry some managerial implications. Process model for technology management. The investigation of the current technology management practices has been well accepted by the firms. The questionnaire based on the process model for technology management and several best practices has proven itself as a useful tool applicable in practice. Some companies has conceived it as a tool for technology audit and some companies as a starting point for building and developing their technology strategies. The need for flexibility. Flexibility appears to be an essential competitive priority for part and component suppliers in Turkey. The supplier companies emphasize flexibility as a major tool in competing with their competitors abroad. The supplier companies need to be flexible due to two main reasons. First, the orders received from vehicle manufacturers in Turkey are for relatively small quantities. Thus the supplier companies opt for product proliferation in order to increase their total volume and to reach a certain scale. The second reason is that the production plans of the vehicle manufacturers in Turkey change frequently and abruptly. Although the vehicle manufacturers apply frozen demand and frozen schedule approach to their suppliers abroad, they don't do so to their local suppliers. Thus the supplier companies need to be flexible in order to survive in such an environment. Technology strategy. A crucial observation is related to strategic planning. It appears that a formal, systematic strategic planning is lacking. In general, planning horizon is relatively short. All these result in a lack of technology strategy. In those companies where business strategy and technology strategy might be said to exist, an alignment of these strategies is missing. The volatile nature of the market is cited as an excuse for this deficiency. Core technical competencies. Most of the supplier companies investigated are not able to define their core technical competencies. Some of them are not aware of their core technical competencies. The areas where such competencies already exist and where the development of specific competencies is desired should be explicitly specified. Resources should be provided by the management to promote such areas and particularly to develop skills necessary in the company.
13
Technology monitoring. A general observation has been the lack of skills and organization for technology monitoring. There are certain activities but they are performed in a rather loose fashion. A more formal approach is needed. Formally defining technology monitoring as a function gives the message to the employees that the management puts emphasis on this issue. It does not need to be organized as a separate department but can be assigned to a particular person or a group of persons with the precaution that it should be part of their job description. Technology selection. There is a need for selecting technology in alignment with business strategy. The technologies selected should serve the competitive priorities of the firm. This, of course, is closely related to the existence of an explicitly stated technology strategy. R&D activities. R&D activities cover the development of product and production technologies and the new product development. There has been considerable emphasis on the development of production technologies leading to improvements in manufacturing costs and product quality. Product technologies and new product development are neglected mostly due to the environment in which the supplier companies operate. The vehicle manufacturers in Turkey operate mostly under licences from vehicle manufacturers abroad and do not have major design activities themselves. Thus they cannot create an atmosphere conducive for product innovation. Interestingly, the suppliers in Turkey have co-design experiences mostly with vehicle manufacturers operating abroad. The companies need to put more resources in R&D activities to improve their level of technology and core competencies to improve their competitiveness in an industry where more of the design responsibilities are transferred to the suppliers and where system suppliers are promoted. REFERENCES [1] Ulusoy G., E. Payzin, T. Bilgiç, A.R. Kaylan, A. Özgür, Technology and New Product Development Management in the Part and Component Suppliers Industry in Turkey, TUSIAD Publications, Istanbul, December 1998. (In Turkish). [2]
Ealey L., and L.T. Bermudez, “Are the Automobiles the Next Commodity?” The McKinsey Quarterly, No.4, pp.63-75, 1996.
[3]
“Too Many Pieces,” The Economist, Vol.347, No.8067, pp.90-91, 1998.
[4]
Mullineux, N., The Automotive Components Industry, Pearson Professional Ltd., London, 1998.
[5]
Probert, D., and M. Gregory, "A Process Model for the Management of Technology: Mapping Techniques and Sectoral Characteristics", Proceedings of the International Association for Management of Technology Conference, Aston, pp. 431-438, 1995.
[6]
Pandya, K.V., A. Karlsson, S. Sega, and A. Carrie, ”Towards the Manufacturing Enterprise of the Future,” International Journal of Operation & Production Management, Vol.17, No.5, pp.502-521, 1997.
[7]
Kleindorfer, P.R., and F.V. Partovi, “Integrating Manufacturing Strategy and Technology Choice,” European Journal of Operational Research, Vol.47, pp. 214-224, 1990.
[8]
Morone, J., “Strategic Use of Technology,” California Management Review, Vol.31, No.4, pp. 91-110, 1989.
[9]
Frohman, A.L., “Putting Technology into Strategic Planning,” California Management Review, Vol.27, N0.2, pp.48-59, 1985.
[10] Roberts, E., “Seeking Global Technological Advantage,” IEEE Engineering Management Review, pp. 4-13, Fall 1995. [11] Frohman, A.L., “Technology as a Competitive Weapon,” Harvard Business Review,
14
No.1, pp.97-104, Jan/Feb 1982. [12] Pavitt, K., “What We Know about the Strategic Management of Technology?” California Management Review, Vol.52, No.3, pp.17-26, 1990. [13] Shrader, C.B., L. Taylor, and D.R. Dalton, ”Strategic Planning and Organizational Performance: A Critical Appraisal,” Journal of Management, , pp.149-179, Summer 1984. [14] Pearce, J.A., E.A. Freeman , and R.B. Robinson, Jr., “The Tenuous Link Between Formal Strategic Planning and Financial Performance,” Academy of Management Review, Vol.12 No.4, pp.658-675, 1987. [15] Zahra, S.A., and J.G. Couin, “Business Strategy, Technology Policy and Firm Performance,” Strategic Management Journal, Vol.14, pp.451-478, 1993. [16] Schoeder, D.M., S.W. Congolen and C. Gopinath, “Linking Competitive Strategy and Manufacturing Process Technology,” Journal of Management Studies, Vol.32, No.2, pp.163-189, 1995. [17] Grant, R.M., R. Krishnan, A.B. Shani, and R. Bae, “Appropriate Manufacturing Technology: A Strategic Approach,” Sloan Management Review, Vol.33, No.1, pp.4354, 1991. [18] Williams, J.R., and R.S. Novak, “Aligning CIM Strategy to Different Markets,” Long Range Planning, pp.126-135, February 1990. [19] Grant, R.M., “The Resource-Based Theory of Competitive Advantage: Implications for Strategy Formulation,” California Management Review, Vol. 33, No.3, pp.114-135, 1991.
15