(a) the spatial distributions of cell length and of leaf elongation rate, and (b) the ...... 1675-1682. Schnyder H, Seo E, Rademacher IF, Kiihbauch W (1990) Spatial.
Plant Physiol. (1 995) 109: 861-870
Temperature Affects Expansion Rate of Maize Leaves without Change in Spatial Distribution of Cell Length’ Analysis of the Coordination between Cell Division and Cell Expansion H a l i m Ben-Haj-Salah and Franqois Tardieu*
lnstitut National de Ia Recherche Agronomique, Laboratoire d’Ecophysiologie des Plantes sous Stress Environnementaux, 2 place Viala, 34060 Montpellier, France then have a role in the control of leaf expansion rate, in spite of the fact that cell division per se cannot affect leaf expansion. An increased rate of cell division with unchanged cell-wall expansion would lead to an increased number of cells per unit area, with unchanged leaf size. Cell division rate can only have a role on expansion if it has some degree of coordination with cell expansion rate. Temperature has a major effect on leaf expansion rate, and partly explains both daylnight alternations and longer-term changes in elongation rate of monocot leaves (Watts, 1974; Gallagher and Biscoe, 1979; Kemp and Blacklow, 1980). This implies a change with temperature in cell-wall mechanical properties, such as that observed in roots by Pritchard et al. (1990). If, as in the case of maize roots (Silk, 1992), final cell size was not affected by increased temperatures, a change in cell production should match the change in cell expansion rate. We have tested this possibility by examining, with contrasting meristem temperatures, the spatial distributions of LER and of cell production. Spatial analysis of elongation and use of the continuity equation (Gandar, 1980; Silk, 1992) provided an adequate framework for analyzing both processes. In monocot leaves, cell division is accompanied by cell expansion, with both processes partly overlapping in time and space. Cells are continuously produced in the meristematic region near the leaf base and expand without division in dista1 regions of the elongating zone, while they are pushed forward by younger cells. It takes about 8 h to 4 d for a cell to cross the elongating zone and to complete its development (Schnyder et al., 1990; Bernstein et al., 1993).In such a case, measuring the proportion of cells currently in mitosis at a given time is not sufficient for assessing cell division rate. Observed proportions depend, in addition to division rate, on cell displacement rate (Fraser et al., 1990) and are therefore difficult to interpret if measured alone. We performed spatial analyses of leaf elongation and cell division in plants grown in the growth chamber, where meristem temperature can be kept constant, thereby maintaining cell flux
We have analyzed the way in which temperature affects leaf elongation rate of maize (Zea mays L.) leaves, while spatial distri-
butions (observed at a given time) of cell length and of proportion of cells in DNA replication are unaffected. We have evaluated, in six growth chamber experiments with constant temperatures (from 13 to 34°C) and two field experiments with fluctuating temperatures, (a) the spatial distributions of cell length and of leaf elongation rate, and (b) the distribution of cell division, either by using the continuity equation or by flow cytometry. Leaf elongation rate was closely related to meristem temperature, with a common relationship in the field and in the growth chamber. Cell division and cell elongation occurred in the first 20 and 60 mm after the ligule, respectively, at all temperatures. Similar quantitative responses to temperature were observed for local cell division and local tissue expansion rates (common x intercept and normalized slope), and both responses were spatially uniform over the whole expanding zone (common time courses in thermal time). As a consequence, faster cell elongation matched faster cell division rate and faster elongation was compensated for by faster cell displacement, resulting in temperature-invariant profiles of cell length and of proportion of dividing cells. Cell-to-cell communication, therefore, was not necessary to account for coordination.
The response of leaf expansion rate to environment has been analyzed mainly in terms of a change in cell-wall mechanical properties (eg. Passioura, 1994), which affects the ability of plant cells to deform in response to turgor. This mechanical change involves several proteins such as xyloglucan endotransglycosylase (Fry et al., 1992), expansin (McQueen-Mason and Cosgrove, 1995), and peroxidase (MacAdam et al., 1992). However, several reports in the literature suggest that changes in leaf size can be accounted for by changes in cell number per leaf, with unchanged final cell size. This is the case in fescue leaves experiencing low nitrogen availability (Gasta1 and Nelson, 1994) and pea subjected to water deficit during the first days of leaf development (Lecoeur et al., 1995). Cell division rate may This work was supported by an Institut National de la Recherche Agronomique grant (AIP valorisation et protection des ressources en eau). * Corresponding author; e-mail tardieu9msdos.montpellier. inra.fr; fax 33-67-52-21-16.
Abbreviations: LER, leaf elongation rate; LVDT, linear variable differential transducer; SER, segmenta1 elongation rate; S,, normalized slope. 861
Ben-Haj-Salah and Tardieu
862
and elongation in steady states. We then performed the same analysis under fluctuating temperatures in the field.
MATERIALS A N D METHODS Plant Culture and Leaf Growth
Maize (Zea mays L., F1 cv DEA) plants were grown in a greenhouse at Montpellier (southern France) in August 1994. Seeds were placed at 0.025-m depth in columns (0.1 m diameter, 0.5 m height) containing a 1:l mixture (v/v) of a loamy soil and an organic compost. Soil was continuously maintained at water retention capacity by automatic irrigation with a modified one-tenth-strength Hoagland solution corrected with minor nutrients. Air temperature in the greenhouse ranged from 20 to 30°C. Six batches of 30 seeds were sown at 4-d intervals (two plants per column), and plants were grown until leaf 6 emerged above the enclosing sheath of the preceding leaf. When the length of leaf 6 (from soil level to leaf tip) reached 350 mm on average, 10 columns with plants chosen for uniformity of leaf size were transferred to a growth chamber (Conviron E15, Winnipeg, Manitoba, Canada). Each batch of plants was then grown at a constant temperature, with different air temperatures among batches (13, 17, 21, 26, 30, and 34°C). Experiments lasted 48 h at temperatures higher than 20°C and 96 h at lower temperatures. In a11 cases, air RH was kept at 70% and PPFD had a constant value of 200 kmol m-' s-l measured at leaf level. Light was provided by a bank of cool-white fluorescent tubes and incandescent bulbs, and was measured continuously using a PPFD sensor (LI-l90SB, Li-Cor, Lincoln, NE). Air temperature and RH were measured every 20 s (HMP35A Vaisala Oy, Helsinki, Finland). Temperature of the meristematic zone was measured with a fine copperconstantan thermocouple (0.4 mm diameter) located inside the stem at 20 mm from the scutellar node. We checked by dissection that this position corresponded to that of the meristematic zone. Meristem temperature remained nearly constant during each experiment (less than 0.2"C variation), and was slightly higher (0.2-0.4"C) than air temperature. A11 temperatures referred to hereafter are meristem temperatures. AI1 data of temperature, PPFD, and RH were averaged and stored every 600 s in a datalogger (Campbell Scientific, LTD-CR10 Wiring Panel, Shepshed, Leicestershire, UK). The LER of leaf 6 was measured on six plants per batch. A linear variable differential transducer (Chauvin Arnoux, LVDT-L100, Paris, France) was attached to the tip of each leaf (Davies et al., 1982) and connected to the datalogger. Measurements began when leaf 6 emerged above the enclosing sheath of the preceding leaf and was about 350 mm long, and lasted for 2 phyllocrons. They ended before onset of rapid sheath elongation, i.e. 1 phyllocron before cessation of leaf elongation. Before that, two preliminary experiments were carried out. (a) We checked by dissection that neither the stem nor the sheath elongated during the period under study, so LVDT readings corresponded to the elongation of leaf blades only. (b) We checked that the
Plant Physiol. Vol. 109, 1!395
weight of the LVDT (18 g) caused no appreciable increase in LER. Extra weights of 18 or 36 g were added to the L.VDT core. As reported by other groups (e.g. Cramer and Bowman, 1991; Passioura, 1994), this caused a transient increase in leaf elongation for 5 min, followed by a return to the previous elongation rate. Maize seeds were sown in two fields in northern FI-ance (Grignon, near Paris) and southern France (Montpellier) in order to get a wide range of temperatures. Sowing (dates were May 15, 1993, at Grignon and June 10 and July 10, 1994, at Montpellier. Daily maximum air temperature ranged between 18 and 25°C at Grignon and between 30 and 35°C at Montpellier. Daily minimum temperature ranged between 10 and 15°C at Grignon and between 16 and 24°C at Montpellier. Temperatures of the air and of the meristematic zones, air RH, and PPFD were continuously measured in lhe same way as in the growth chamber experiment. In this case, the difference between air and meristem temperatures was greater than in the grlowth chamber, and reached 2°C. Gravimetric water content in the O- to 0.4-m soil layer was measured and transfoi-med into water potential using water-release curves. Soil was watered at intervals of 3 d, so that soil water potential never declined below -0.02 MPa. LER measurements were carried out at the same phenological stages as in the growth chamber experiments. LVDTs were attached to the tips of six leaves in the same way as in the growth chamber experiment. In this paper, only elongation rates at PPFD values lower than 200 ELmol m-z s-l (similar to those in the growth chamber) are presented.
Spatial Analysis of Leaf Elongation and Cell Length
Data on the spatial distribution of elongation in the leaf were obtained by marking the leaf elongating zone with needle holes and evaluating the displacement of the rnarks during a 6-h period (Schnyder et al., 1987). The period under study corresponded to the last 6 h of each growth chamber experiment. In the field experiment, it corresponded to periods of the day from 1O:OO AM to 4:OO PM ("day") and 1O:OO PM to 4:OO AM ("night"). Forty holes were pierced with line needles (0.2 mm diameter) inserted through the sheaths of older leaves and the growing region of young leaves. Needles were longitudinally aligned with the center of the stem and were guided by a piece of plexiglass to ensure a horizontal trajectory. The first hole was close to the scutellar node and neighboring holes were spaced 5 mm apart for 200 mm. After 6 h, plants were excised, placed in a box at 4"C, and transferred to the laboratory. Elongation of segments between two neighboring holes was obtained by subtracting initial from final distances between holes. Distances were recorded using an interactive image analysis system (Bioscan-Optimas V 4.10, Edmonds, WA). Initial distance (.4L0) was not exactly 5 mm because of small errors in needle trajectory, and was estimated by measuring the distance between corresponding neighboring holes on the sheath of the second (nongrowing) leaf. ALO, measured in this way,
863
Coordination between Cell Division and Cell Expansion ranged from 4.8 to 5.2 mm. The sixth leaves were then carefully freed from older, enclosing leaves, and final positions of needle marks and of the ligule were recorded with the image analyzer. LER of pierced plants was obtained by summing elongations of all segments after the ligule, and were corrected for the effect of piercing injury. This effect was estimated as the ratio of mean elongation of pierced plants to the mean elongation of nonpierced plants in the LVDT system, and was 40% on average. It was assumed that piercing injury did not affect the spatial distribution of elongation, consistent with the results of Schnyder et al. (1987) on Festuca, so elongation of all segments was multiplied by the reciprocal of this ratio. SER, (h-l) were calculated as:
1
Phase'GO-Gl'
I
"/o G O - G I ' 71.25 's' 9.40 ' G 2 - M ' 19.35
~
401.55 Channe' 3.50 603.66 6.33 3.76 798.75
Ii
.-
a, o 3 C
Lc
O
80
&
Q
E 3
Z
40
n " 200
400
600
800
1O00
Fluorescence intensity (channel number) where and AL,,f (mm) are the initial and final distances between holes i and i + l , LER,,,, (mm h-l) is the mean elongation rate of noninjured plants measured with LVDT for the 6 h under study, and LER,,, (mm h-l) is the sum of elongation of all leaf segments, divided by the duration of the experiment (At, 6 h). Cell length in the abaxial epidermis was measured, in field and growth chamber experiments, on leaf 6, whose elongation was followed with the LVDT system. Plants were excised at the same time as those for SER analysis. A 4% (w / w) solution of polyvinylformaldehyde in chloroform was spread on the abaxial epidermis in the basal200 mm of the leaf. A transparent negative film of the abaxial epidermal cells was obtained after evaporation of the chloroform. The location of the ligule was determined, and films were placed under a microscope (Leica, Leitz DM RB) coupled to the image analyzer. The lengths of 150 epidermal cells were measured at each 5-mm increment from 1 to 20 mm from the ligule, and at each 10-mm increment from 20 to 100 mm.
Spatial Analysis of Cell Cycle: Flow Cytometry
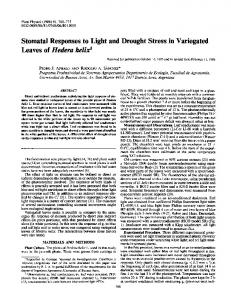
The cell cycle was analyzed in leaf 6 collected from 20 plants grown in the growth chamber at 17 and 26°C. After the leaves were freed from enclosing leaves, the basal 60 mm were dissected into 5-mm-long segments, and a 10mm-long segment of mature tissue was collected at 100 mm from the ligule. Leaf tissue of each segment was chopped with a 'razor blade in a plastic Petri dish containing 2 cm3 of extraction buffer (Dolezel et al., 1989). The suspension obtained in this way was passed through a 50-~m nylon filter and nuclei were stained with 100 mm3 of propidium iodine (1%).Fluorescence intensity of 10,000 nuclei, linked to DNA content, was measured with a FACSCAN argon laser flow cytometer (Becton Dickinson, 488 nm, 15 mW). Distribution of fluorescence intensity was interpreted (Fig. 1) as the overlapping of two gaussian curves whose means and SD values were calculated (WinMDI flow cytometry application V1.3.4).This allowed us to calculate the proportion of nuclei with 2c and 4c amounts
Figure 1. Histogram of fluorescence intensities (proportional to n u clear DNA content) associated with 10,000 nuclei obtained from a maize leaf segment (at 5-10 m m from the ligule) and analyzed by flow cytometry. The first Gian curve, with mean mode at channel 400, corresponds to nuclei in the GO-G1 phases. The second peak, with mean mode at channel 800, corresponds to nuclei in phases following DNA replication (phases G2 and M, in the absence of polyploidy).Nuclei with intermediatefluorescence are considered in S phase. Proportion of area in relation to total (%I, mean mode channel number, and coefficients of variation (CV, in percent of mean) for each population of nuclei are presented in the inset.
of DNA, classically interpreted as the proportion of nuclei in phases GO-G1 and G2-M of the cell cycle. Calculations of Cell Division Rate, Cell Flux, and Duration of Cell Elongation
Calculations were from the growth chamber experiments, where LER were constant over the 6-h period under study. Cell division rate (d,) was calculated in each segment (i)by combining the records of SER and of local cell length in the continuity equation (Gandar, 1980; Silk, 1992): 6P 6Pl d, =I+ p, X S E R , + v,X st 6z,
where p, is cell density per unit of leaf length (reciprocal of cell length, mm-') in segment i, vi is the local velocity (integration of SER,, from the ligule to the segment i), and z , is the distance from the ligule. The first term (change with time of cell density during the 6-h period under study) was calculated by comparing profiles of cell lengths at the beginning and end of the 6-h period. The second term was derived from the spatial analysis of elongation. In the third term (convection term), 6 p / 6 z is the local slope of the relationship between cell length and distance to the ligule in segment i. The second and third terms could be calculated only in cases when LER and SER were constant over the studied 6-h period. This was the case in the growth chamber experiments but not in the field experiments (Fig. 2).
Ben-Haj-Salah and Tardieu
864
Plant Physiol. Vol. 109, 1995
i. This integral equals piui and can also be calculated with a summation formula:
Division rate in the first segment near the ligule was not calculated using Equation 2, since this segment contained the ligule and part of the sheath. It was calculated a s the difference between fm and the sum of division rates in a11 other segments. O
20
60
40
80
RESULTS
1O0
Time in the growth chamber (h)
LER
I
I h
r
z
k E E v
35
a, c
30
2
2. 2 m 3 3
S
O .c
'0
25
m
c OI O -
a,
20
c
m
2
-s6 v
a,
1
15 06.00
12.00
18.00 00.00 Time of day (h)
06.00
Figure 2. Change with time of elongation rate (LER) of maize leaves in the growth chamber experiments with constant meristem temperatures (A) and during 24 h in the field (Montpellier) (B). In B, diurnal change in LER is presented together with change in meristem temperature (T). The arrows indicate the 6-h periods during which spatial analyses of leaf elongation were carried out. DP, Day period; NP, night period. Vertical lines indicate interval of confidence at 0.95.
The time (ti) needed for a material point to move from the proximal to the distal limit of segment i was calculated as the ratio of the length of the segment (ALi,o) to the local velocity (vi):
In the growth chamber experiment, LER was nearly constant over the entire period under study (Fig. ZA), with mean values increasing with higher meristem temperature. In contrast, LLR changed with time of day in both field experiments (Fig. 2B) and paralleled the diurnal change in meristem temperature. Variability between plants within a batch was small in a11 experiments and ranged from 5 to 10% of the LER value. Mean LER, calculated over 1-h periods, was linearly related to meristem temperature in the range from 13 to 30°C (Fig. 3), with a reduction iri rate at 34OC. Close correlations were observed in a11 erperiments (r2 = 0.98 in the growth chamber experiment), with a greater scatter of points in the field experiments i(r' = 0.78). The same relationship between meristem temperature and LER was found in the growth chamber experiment and in the field experiments at both Grignon and Montpellier. Spatial Distributions of Relative Elongation Rate and Cell Length Growth Chamber Experiment
At a11 temperatures studied, the spatial distribution of SER along the elongating zone (Fig. 4A) had a corrimon
7
a, +
(3)
Total time needed for a material point to move from its present position to the distal end of the elongation zone was calculated (Schnyder et al., 1990) as the sum of ti from the material point to the distal limit of the elongating zone. It was, therefore, presented on a negative scale. The cell flux in the mature zone was calculated (Fraser et al., 1990) as the ratio of LER to mature cell length (Am):
vm)
f
LER
m
=-
Aln
(4)
The local cell flux in segment i K, cells h-I) was calculated as the integral of division rates from the ligule to segment
e
c
m
a, 1
5
10
15 20 25 30 Meristem temperature ("C)
35
Figure 3. Relationship between meristem temperature and LER in the growth chamber (0)and in the field (Grignon, O; Montpellier, A). The dashed line indicates linear regression corresponding to the growth chamber experiments from 1 3 to 30OC. The vertical lines show interval of confidence at 0.95.
865
Coordination between Cell Division and Cell Expansion
The profile of epidermal cell length (Fig. 48) in the growing zone was common at a11 temperatures, with a sigmoidal shape. The zone with increasing cell length was 60 to 70 mm long, thereby corresponding to the elongating zone in the spatial analysis of SER. It was slightly shorter than the elongating zone at 25 and 30"C, and slightly longer at 13°C. Final cell length, observed at more than 60 mm from the ligule, underwent relatively small change with temperature (Fig. 48, inset), although with a tendency to increase from 13 to 26°C (9.7% increase) and to decrease at higher temperatures. Field Experiments
Spatial analysis of leaf elongation was carried out for two 6-h periods ("day"' and "night"), during which meristem temperature and LER underwent the lowest variations (Fig. 28). Profiles of SER (Fig. 5A) and of cell lengths (Fig. 58) during day and night periods were similar to those observed at corresponding temperatures in the growth chamber experiment (29 and 18"C, respectively). The length of the elongating zone in the spatial analysis of SER was slightly shorter in the field than in corresponding experiments in the growth chamber. In contrast, maximum SER values, final cell length, and length of the zone of cell elonO
20
40
60
80
1O0
Distance from ligule (mm) epidermal cell leaves, at six meristem temperatures in the growth chamber experiments (for better legibility, data corresponding to 34OC in A are shown for only the first 30 mm). lnset A, Relationship between meristem temperature and maximum SER. lnset 8, Relationship between meristem temperature and final epidermal cell length. Vertical lines indicate interval of confidence at 0.95. Figure 4. Spatial distributions of SER (A) and abaxial length (8) in a cell file of the elongating zone of
shape, with maximum values of SER between 15 and 35 mm from the ligule and with significantly positive SER values up to 60 mm from the ligule. Maximum values of SER were linearly related to temperature (Fig. 4A, inset), increasing by 450% (from 0.02-0.11 h-' ) when temperature increased from 13 to 34°C. Profiles of SER could essentially be generated one from the other by multiplying SER in each segment by a uniform coefficient (referred to as affine transformation hereafter, with coefficient calculated as the ratio between maximum SER). However, severa1 characteristics departed from this general affine tendency. (a) The length of the elongating zone increased with temperature, from 55 mm at 17°C to 75 mm at 26 and 30°C (the length at 13°C was difficult to evaluate because of low SER values). (b) The distance from the ligule to the point with maximum SER increased slightly with temperature. (c) SER at 34°C (presented in the zone 0-30 mm only in Fig. 4A, for better legibility) had an essentially unchanged pattern in the first 30 mm after the ligule and had highest maximum SER values, but the decline in SER at further distances was faster than that at lower temperatures (significantly positive SER values up to 55 mm from the ligule).
h
&
7
-E
a,
0.12 0.10
t
120 C
O
A
-om-
-
Day
Night
gP-Q
n
20
40 60 80 Distance from ligule (mm)
1O0
epidermal cell length (B) in the elongating zone of leaves of field-grown plants (Montpellier). O,Day period from 1O:OO AM to 4:OO PM with mean meristem temperature of 29°C. W, Night period from 1O:OO PM to 4:OO AM with mean meristem temperature of 18°C. Figure 5. Spatial distributions of SER (A) and abaxial
866
Plant Physiol. Vol. 109, 1!395
Ben-Haj-Salah and Tardieu
Figure 6. Epidermal cell length as a function of time needed to reach the distal limit of the elongating zone (60 m m from ligule). Inset, Relationship between position and time.
120
5
1O0
03
c
a, -
80 60
40 LLI
20
-200
-150
-1O0
-50
O
Time (h) gation were consistent with those in the growth chamber, in spite of the fact that cells underwent fluctuating temperature during displacement through the elongating zone. 7
Duration of Cell Displacement
The time it took for a cell to cross the elongating zone in growth chamber experiments (Fig. 6, inset) was calculated using Equation 3 and considering t = O when the cell was located at 60 mm from the ligule (distal end of the growing zone). This tlme considerably increased with decreasing temperature (34 and 195 h, respectively, at 30 and 13"C), and was particularly long in the first 10 mm beyond the ligule (but with a maximum error in estimation). Although our initial objective was to analyze situations with steady states, this was achieved only in the experiment at 17"C, which lasted 96 h, for a displacement time of 84 h, and at 26 and 30"C, which lasted 48 h, for a displacement time of 49 and 34 h, respectively (we considered the 49-h cell displacement time as insignificantly different of the 48-h duration in the experiment at 21°C). In this case, all studied cells experienced a constant temperature during displacement. Cell flux was therefore considered in a steady state, since, in addition, LER was constant (Fig. 2) and a11 leaves under study were in a developmental stage during which profiles of SER do not vary with time (Schnyder et al., 1990; Meiri et al., 1992). In contrast, cells initiated at the beginning of the incubation period had only crossed 19 and 25 m, respectively, by the end of the experiments at 13 and 21°C. Cell Flux and Cell Division Rate in the Elongating Zone
Cell division rates were calculated in growth chamber experiments, since conditions for using Equation 2 were met (see "Materials and Methods"). The first term of Equation 2 (change with time of cell density during the 6-h period under study) was set to zero, since profiles of cell length varied neither with time (data not shown) nor with
-0-
'E E
17°C
-A-21"C -v- 26°C
-*- 30°C
a,
c
E C
.-O
v) .-
.->
-o
50
LB h %.-
40
t
O
*A-*,*-*-*-*-*-*.*-*-*-*-*-*-*-*-*-o /
20 40 60 80 Distance from ligule (mm)
1O0
Figure 7. Spatial distributions of cell division rate (A) and cell flux per cell file (B) in the elongating zone of leaves grown in the growth chamber at five nieristem temperatures. Inset, Relationship between meristem temperature and total cell flux, calculated in the nonelongating zone. Filied symbols, Experiments in which all cells in the elongating zone experienced a constant temperature throughout development. Open symbols, Experiments in which only some cells experienced a constant temperature (see text).
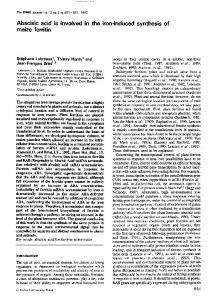
Coordination between Cell Division and Cell Expansion temperature. Cell division rates calculated from Equation 2 were positive in a11 5-mm segments located less than 15 mm from the ligule (Fig. 7A), and were close to zero at distances greater than 20 mm from the ligule. Cells located in the division zone at the end of the experiment were therefore initiated during the incubation period in all treatments, even at 13 and 21"C, since the length of the division zone was shorter than cell displacement during the incubation period. Maximum division rates were observed in the first two segments beyond the ligule and were linearly related to temperature (6- and 4-fold increases, respectively, in the first and second segments). As a consequence, local cell flux (Eq. 5) increased with distance up to 20 mm from the ligule (Fig. 7B). Cumulated cell flux, observed in mature zones, was closely related to temperature, with a linear relationship (Fig. 7A, inset). Flow cytometry detected nuclei apparently in the S and G2-M phases in the whole leaf, including mature zones (100 mm from the ligule) where neither leaf elongation nor cell division in the epidermis were observed. Maize leaves and roots contain cells with different ploidy levels (Miiller et al., 1994; Arkebauer and Norman, 1995), so one can mistake tetraploid cells in G1 for diploid cells in G2-M. Since direct estimation of the proportion of nuclei in G2 was not possible, we relied on the proportion of cells in phase S for characterizing the cell division zone. This proportion was estimated by the difference between apparent frequencies of nuclei in phase S in segment i and in mature tissue (Si - SZm)to correct the effect of polyploidy. Estimated proportions (Fig. 8) were maximum in the first three 5-mm segments beyond the ligule and declined at greater distances, up to 60 mm. Flow cytometry, carried out on whole-leaf tissues (including mesophyll), therefore suggested that cell division occurred in a longer zone of the leaf than that detected in the epidermis by spatial analysis of cell division rate. Distribution of the proportion of cells in phase S was similar at 17 and 26°C.
867
A Common Response of LER, SER, and Division Rate to Temperature
In the growth chamber experiments, LER (Fig. 3), maximum local SER (Fig. 4A, inset), and cell flux (Fig. 7A, inset) had linear responses to temperature, with a common x intercept of 9.8"C (insignificant differences). Slopes of response curves were compared by calculating a normalized slope for each variable. For example, for LER:
SJLEX) =
A LER (AT X LERs0)
where S,(LER) is the normalized slope of LER ("C-'), A(LER)/AT is the slope of the relationship (Fig. 2) between LER and temperature (T), and LER,, is the value of LER at 30°C. Normalized slopes of LER, maximum SER, and cell flux were 0.052, 0.047, and 0.052, respectively. In addition, local normalized slopes of SER were constant over the entire elongating zone, since SER at a11 positions could be deduced one from the other by multiplication by a uniform temperature-dependent factor throughout the elongating zone (affine transformation). A uniform response of cell division rate was also observed in the first segments of the elongating zone (Fig. 7), so local division rates had a uniform normalized response to temperature (S, = 0.055 and 0.052, respectively, in the first and second segments). A consequence of the common and uniform response of SER and division rate to temperature was that changes with temperature in cell size were matched by changes in cell displacement. This view is illustrated in Figure 9, in which time-related changes in cell displacement and epidermal cell length are presented in thermal time instead of time as in Figure 6. Thermal time was obtained by accumulating temperatures experienced each hour after subtracting 93°C (i.e. the common x intercept of experimental linear relationships). Changes with thermal time of both displacement time and cell length were the same at all studied temperatures (although with a slightly different curve at 17°C). Regardless of temperature and total LER, it took about 30°C d (Fig. 9, inset) for a cell to cross the elongating zone and to reach its maximum size. Positionsize relationships, obtained by elimination of thermal time between the two relationships in Figure 9, were therefore independent of temperature as experimentally observed in Figure 4B.
DISCUSSION
Distance from ligule (mm) Figure 8. Spatial distribution of the frequency of nuclei in S phase (corrected by subtracting the frequency obtained in mature tissue, , , S, from the frequency measured in the leaf segment under study, S,) by flow cytometry analysis.
A first result of this study relates to the length of the zone of cell division, for which quantitative data are scarce. Our analysis suggested that this zone was 20 mm long, i.e. one-third of the elongating zone. Regardless of meristem temperature, one-fourth of epidermal cell division occurred in the zone located farther than 5 mm from the ligule, and appreciable division was still observed from 10 to 20 mm from the ligule. Flow cytometry, carried out on whole-leaf tissue, suggested a longer zone of division (60 mm). This suggested that mesophyll cells, taken into account in flow cytometry analysis, divided over a longer
868 Figure 9. Epidermal cell length as a function of thermal time (obtained by accumulating temperatures experienced each hour after subtracting 9.8"C, the x intercept of linear relationship between LERand temperature) needed to reach the distal limit of the elongating zone (60 mm from ligule). Inset, Relationship between position and thermal time.
Ben-Haj-Salah and Tardieu
-
I E
5 0-l c
Plant Physiol. Vol. 109, 1'395
120 1O0
a, -
80
o
60
a,
-
zii
oQ w
40
20
40
60
Distance froin ligule (mm)
20
-40
distance than epidermal cells, as already observed in dicot species (Dale, 1988). Large overlapping of cell division and cell expansion was therefore observed, with a zone of division representing 100% of the elongating zone if both epidermis and mesophyll were taken into account (versus 50% in fescue leaves as estimated by MacAdam et al., 1989), and one-third if epidermis alone was taken into account. Increase in division rate with temperature was probably due to a reduced cell-cycle duration, as observed in root tissues by Lopez-Saez (1966) and Barlow and Adam (1989). It is noteworthy that an analysis of cell division using flow cytometry alone might have led us to conclude that there was an absence of effect of temperature on cell division (Fig. 8), in contrast to our results of spatial analysis of cell division rate. Events concerning an individual cell (cessation of division, maximum expansion rate, and cessation of expansion) appeared to be linked to a position within the elongating zone of the leaf rather than to the cell age at which these events occurred, which varied considerably with temperature. Such unchanged profiles of cell length with varying temperature have also been observed in maize roots (Silk, 1992). Profiles were also unchanged in our data when the meristem experienced fluctuating temperature in field experiments. This implies that temperature affected both cell flux and wall expansion, so the profile of cell length observed at a given time was essentially unaltered by meristem temperature. Cell size does not appear as a straightforward variable accounting for coordination between cell division and cell expansion. Cells at 15 mm from the ligule kept an apparent ability to divide, although they were twice as long as cells nearer the ligule. Furthermore, cells at 30°C divided five times more rapidly than those at 13"C, in spite of having the same length. Such an absence of direct linkage between cell size and cell division has been observed in dicot leaves by Maksymowych (1963) and Brown
-30
-20 -1o Thermal time ("C d)
O
(1976), who reported that cells apparently can divide until reaching their final size. We can state conclusively that cell division and cell expansion were closely coordinated in the cases (growth chamber experiments at 17, 26, and 30°C) in which a11 cells in the elongating zone experienced a constant temperature over their whole development. Cell division and cell expansion were coordinated in such a way that duration and rate of individual cell expansion followed a close inverse relationship, so that a cell at a given distance from the ligule had a size that did not depend on temperature. It is intriguing that unchanged profiles of cell length were observed in the two growth chamber experiments (at 13 and 21°C) in which cell flux was not in a steady state. In these cases, only cells located in the division zone (20 mm beyond the ligule) experienced a constant temperature, whereas more distal cells had divided under fluctuating temperatures in the greenhouse (from 20-30°C). Furthermore, leaves that underwent fluctuating temperatures during their entire development (field experiments) had essentially unchanged profiles of cell length, in spite of rapid day/night fluctuations of LER and, presumably, of cell flux. These facts suggest a short-term coordination in which a11 cells of a file would respond simultaneously to a temperature change, rather than a longer-term developmental coordination. We suggest that coordination could be due to a common response of cell division rate and cell expansion rate to temperature, with uniform responses in the whole elcingating zone. LER, maximum local SER, and cell division rate a11 had linear responses to temperature, with a comrnon x intercept of 93°C and common normalized slopes. In addition, responses of local SER and division rates were uniform in a11 segments of the elongating zone. This vvould cause faster elongation and division rates to be compensated for by faster displacement, as illustrated in Figure 9.
Coordination between Cell Division and Cell Expansion If both cell displacement rate and cell expansion have a common relationship with thermal time, this results in invariant position-size relationships, and therefore a cell length profile that does not change with temperature. Since response to temperature was rapid (LER closely paralleled meristem temperature in Fig. 2B) and was uniform over the entire elongating zone, all cells in the growing zone probably responded rapidly and simultaneously to a change in temperature. This would explain the fact that coordination was observed in situations with fluctuating temperature (growth chamber experiments at 13 and 21°C and field experiments) and in the absence of steady state over the elongating zone. In this case, cell displacement and cell expansion occurred with rates that changed with time, but both remained on the same curves (Fig. 9) if expressed as a function of thermal time. As a consequence, size-position relationships remained stable, even though both expansion and displacement rates changed with time. We believe that the data presented here may have a practical interest, by giving a stronger basis to the concept of thermal time used for analyzing elongation under fluctuating temperatures (Gallagher, 1979) and widely used in crop modeling (e.g. Williams et al., 1989; Ritchie and Nesmith, 1991). If severa1 mechanisms contributing to leaf elongation have a common linear response to temperature (common intercept and normalized slope) in a range of temperatures, it is valid to express time in cumulated degree days (here with a base temperature of 9.8"C) for predicting changes in leaf area u n d e r fluctuating temperatures. In our data, expressing time in thermal time allowed us to unify LER behavior during day and night (Fig. 2), and cell displacement and elongation rates in the elongating zone (Fig. 9).
CONCLUSION
Our study suggests that cell division rate is proportional to LER under varying temperatures. Changes in cell flux through the meristem were matched by changes in cellwall expansion rate, thereby keeping an unchanged profile of cell size in the meristem regardless of temperature. This should require a close spatial coordination within the leaf, since part of cell expansion occurs when the cell has moved beyond the dividing zone. We suggest that this coordination was not linked to a control of division rate by cell size, and did not necessarily involve a circulation of information between dividing and elongating cells. It would be due to a common response of cell division rate and cell-wall expansion rate to temperature, and to a spatially uniform effect of temperature on these processes. Faster cell division rates would be compensated for by faster cell elongation and displacement, resulting in invariant profiles of cell length and proportion of dividing cells.
ACKNOWLEDCMENTS
We thank Philippe Hamard for technical help and Dr. MichauxFerriere (Centre de Cooperation Internationale en Recherche
869
Agronomique pour le Developpement) for help in analyzing the data of flow cytometry. Received May 2, 1995; accepted August 21, 1995. Copyright Clearance Center: 0032-0889/95/ 109/0861/ 10.
LITERATURE ClTED
Arkebauer TJ, Norman JM (1995)From cell growth to leaf growth. 11. Simulation of a file of cells. Agron J 87: 106-112 Barlow PW, Adam JS (1989) The response of the primary root meristem of Zea mays L. to various periods of cold. J Exp Bot 4 0 81-88 Bernstein N, Lauchli A, Silk WK (1993) Kinematics and dynamics of sorghum (Sorghum bicolor L.) leaf development at various Na/Ca salinities. Plant Physiol 103: 1107-1114 Brown R (1976) Significance of division in the higher plant. In MM Yeoman, ed, Cell Division in Higher Plants, Vol 7. Academic Press, London, pp 3-46 Cramer GR, Bowman DC (1991) Kinetics of maize leaf elongation. J Exp Bot 42: 1417-1426 Dale JE (1988) The control of leaf expansion. Annu Rev Plant Physiol Plant Mo1 Biol 39: 267-295 Davies WJ, Rodriguez JL, Fiscus EL (1982) Stomatal behaviour and water movement through roots of wheat plants treated with abscisic acid. Plant Cell Environ 5: 485-493 Dolezel J, Binarova P, Lucretti S (1989) Analysis of nuclear DNA content in plant cells by flow cytometry. Biol Plant 31: 113-120 Fraser TE, Silk WK, Rost TL (1990) Effects of low water potential on cortical cell length in growing regions of maize roots. Plant Physiol 93: 648-651 Fry SC, Smith RC, Renwick KF, Martin DJ, Hodge SK, Matthews KJ (1992) Xyloglucan endotransglycosylase, a new wall-loosening enzyme activity from plants. Biochem J 282: 821-828 Gallagher J N (1979)Field studies of cereal leaf growth. I. Initiation and expansion in relation to temperature and ontogeny. J Exp Bot 30: 625-636 Gallagher JN, Biscoe PV (1979)Field studies of cereal leaf growth. 111. Barley leaf extension in relation to temperature, irradiance, and water potential. J Exp Bot 30: 645-655 Gandar PW (1980) The analysis of growth and cell production in root apices. Bot Gaz 141: 131-138 Gasta1 F, Nelson CJ (1994) Nitrogen use within the growing leaf blade of tall fescue. Plant Physiol 105: 191-197 Kemp DR, Blacklow WM (1980) Diurna1 extension rates of wheat leaves in relation to temperatures and carbohydrate concentrations of the extension zone. J Exp Bot 31: 821-828 Lecoeur J, Wery J, Turc O, Tardieu F (1995) Expansion of pea leaves subjected to short water deficit: cell number and cell size are sensitive to stress at different periods of leaf development. J Exp Bot 46: 1093-1101 Lopez-Saez JF, Gimenez-Martin G, Gonzalez-Fernandez A (1966) Duration of the cell division cycle and its dependence on temperature. Z Zellforsch 75: 591-600 MacAdam JW, Sharp RE, Nelson CJ (1992) Peroxidase activity in the leaf elongation zone of tall fescue. 11. Spatial distribution of apoplastic peroxidase activity in genotypes differing in length of the elongation zone. Plant Physiol 99: 879-885 MacAdam JW, Volenec JJ, Nelson CJ (1989) Effects of nitrogen on mesophyll cell division and epidermal cell elongation in tall fescue leaf blades. Plant Physiol 89: 549-556 Maksymowych R (1963) Cell division and cell elongation in leaf development of Xantkium pennsylvanicum. Am J Bot 50: 891-901 McQueen-Mason SJ, Cosgrove DJ (1995)Expansin mode of action on cell walls. Analysis of wall hydrolysis, stress relaxation, and binding. Plant Physiol 107: 87-100 Meiri A, Silk WK, Lauchli A (1992) Growth and deposition of inorganic nutrient elements in developing leaves of Zea mays L. Plant Physiol 98: 972-978 Miiller ML, Barlow PW, Pilet P-E (1994) Effect of abscisic acid on the cell cycle in the growing maize root. Planta 195: 10-16
870
Ben-Haj-Salah and Tardieu
Passioura JB (1994) The physical chemistry of the primary cell wall: implications for the control of expansion rate. J Exp Bot 45: 1675-1682 Pritchard J, Barlow PW, Adam JS, Tomos AD (1990)Biophysics of the inhibition of the growth of maize roots by lowered temperature. Plant Physiol 93: 222-230 Ritchie JT, Nesmith DS (1991) Temperature and crop development. Zn J Hanks, JT Ritchie, eds, Modeling Plant and Soil System. American Society of Agronomy, Madison, WI, pp 5-29 Schnyder H, Nelson CJ, Coutts JH (1987) Assessment of spatial distribution of growth in the elongation zone of grass leaf blades. Plant Physiol 85: 290-293
Plant Physiol. Vol. 109, 1 !395
Schnyder H, Seo E, Rademacher IF, Kiihbauch W (1990) Spatial distribution of growth rates and of epidermal cell lengths in the elongation zone during leaf development in Lolium peveime L. Planta 181: 423-431 Silk WK (1992) Steady form from changing cells. Int J Plant Sci 153: 49-58 Watts WR (1974) Leaf extension in Zea mays. 111. Field me.asurements of leaf extension in response to temperature and leaf water potential. J Exp Bot 25: 1086-1096 Williams JR, Jones CA, Kiniry JR, Spanel DA (1989) The EPIC crop growth model. Transactions of the A.S.A.E. 32: 497-511