temperature range: rRNA chain elongation rate, guanosine tetraphosphate ... RNA synthesis parameters are temperature invariant despite the increase of.
JOURNAL OF BACTERIOLOGY, Aug. 1982, p. 879-887
Vol. 151, No. 2
0021-9193/82/080879-09$02.00/0
Temperature Dependence of RNA Synthesis Parameters in Escherichia coli J. RYALS, R. LITTLE, AND H. BREMER* Biology Program, The University of Texas at Dallas, Richardson, Texas 75080 Received 25 November 1981/Accepted 12 April 1982
For Escherichia coli B/r growing in glucose minimal medium, the following parameters of RNA synthesis remained invariant between 20 and 40°C: RNA polymerase concentration (RNA polymerase/mass), rRNA and tRNA concentration (RNA/mass), RNA polymerase activity (fraction of total RNA polymerase actively engaged in RNA chain elongation), and stable RNA synthesis relative to total RNA synthesis. The following parameters increased 3.4-fold over the same temperature range: rRNA chain elongation rate, guanosine tetraphosphate (ppGpp) concentration, and culture growth rate. Above 40°C, the changes became more complex, and the growth rate began to decrease. The observation that most RNA synthesis parameters are temperature invariant despite the increase of ppGpp suggests that the mechanism of RNA synthesis control by ppGpp, assumed to involve an interaction of RNA polymerase with ppGpp, is itself temperature dependent such that, with increasing temperature, higher concentrations of ppGpp are required to affect the RNA polymerase. Schaechter et al. (25) observed that the macromolecular composition of Salmonella sp. depends on the composition of the growth medium, but is independent of the growth temperature. A plausible explanation would be that all of the enzymatic reactions that are limiting the rates of synthesis of the major macromolecules have about the same temperature coefficients. In that case, the main effect of a temperature shift would be an acceleration or deceleration of the movements of ribosomes, replication forks, and transcribing RNA polymerase molecules. However, temperature shifts may result in more complex changes; e.g., Gallant et al. (12), who studied RNA synthesis in Escherichia coli after a temperature upshift, observed a stimulation of RNA accumulation with a simultaneous increase in the level of guanosine tetraphosphate (ppGpp). This accumulation of ppGpp was greatly reduced in the presence of certain amino acids or in a relA mutant, suggesting that the temperature upshift resulted in a temporary deprivation of amino acids which, in turn, caused the increased accumulation of ppGpp due to the function of the relA gene (12). Normally, RNA accumulation is strongly curtailed after amino acid starvation of a relA+ strain (7, 28). The apparent absence of the so-called "stringent response" after a temperature-induced amino acid deprivation suggested to those authors that ppGpp is not involved in the control of stable RNA synthesis and led them to speculate that other factors are
important. As a prerequisite to a more rigorous analysis of these temperature effects on the control of RNA synthesis, we have here measured, during exponential growth in the range of 20 to 42°C, a number of parameters relating to RNA synthesis. These parameters, which include the concentration and activity of RNA polymerase, the rRNA chain elongation rate, the relative activity of rRNA and tRNA genes, and the concentration of ppGpp, have not been previously measured as a function of growth temperature. Except for the chain elongation rates (peptide and RNA) and ppGpp concentration, most physiological parameters were found to be temperature invariant. MATERIAL,S AND METHODS Bacterial strains and growth conditions. Cultures of E. coli B/r (ATCC 12407) were grown in medium C (14) supplemented with 0.2% glucose. Growth was monitored as the increase in the concentration of cell mass (optical density at 460 nm [OD4w]). Determination of RNA and protein. The amounts of RNA and protein were determined as previously described (27). Briefly, 5.0-ml samples of culture were added to 1.0 ml of cold 3 M trichloroacetic acid, and the precipitated cells were collected on glass fiber filters. The filters were dried and treated with 2.0 ml of 0.2 M NaOH at 25C for 18 h. After incubation, 0.5 ml of the hydrolysate was removed for protein determination by a modification (5) of the method of Lowry et al. (20), using bovine serum albumin for calibration. The remaining hydrolysate was used to measure RNA as UV absorbance at 260 nm (A26), after removing DNA
879
880
RYALS, LITTLE, AND BREMER
J. BACTERIOL. 6
I
I
-
I-
4
-5
c0
0
2
10
0--
0
I.
eCQ
C/
OcL
.o0)
'''
1.
.
0
4
sr-o
0
5
10
C.6C)6
15 1-
Time after rifampicin (min)
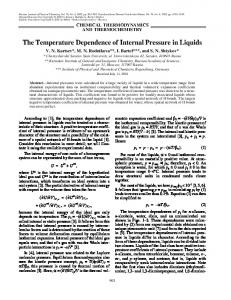
FIG. 1. Synthesis of tRNA after the addition of rifampin (rifampicin) at 30C. Cultures were prelabeled with [(4C]uridine for two generations before the addition of rifampin. At zero time, rifampin and [3H]uridine were simultaneously added. Samples were taken at various times and treated as described in the text. The initial labeling kinetics and the labeling plateau were extrapolated to an intersection indicated by the arrow. The time of this intersection is taken as the duration of tRNA synthesis after the addition of rifampin, corresponding to the synthesis time of the rRNA precursors.
b
o g a0 -0
I
3I
I
I
.6
-----
-__I-__
).4
C
_2 0 ).2
-O.
-A
0~
.,
d
O
o
0
2co O'3:5
a10 _
_ l C^
1a0
6
C
Ct C,
by acid precipitation and filtration. All absorbances were corrected for blank values, obtained by processing samples containing growth medium without bacteria. The amount of RNA was expressed as the number of RNA nucleotides by setting 1 A260 U of RNA
C)a
I
Il
I
0
10
IV CL
1.0 -0
zo.
U.
20
30
40
Temperature (c)
FIG. 3. Growth parameters as a function of temperature. The bars give the range of three experiments. (a) Stable RNA per OD4w (from Table 1); (b)
UTP
.002-
protein per OD460 (from Table 1); (c) fractional synthesis rate of stable RNA (from Table 3); (d) growth rate (from Table 1); (e) stable RNA chain growth rate (from Table 4); (f) RNA polymerase synthesis (from Table 5).
E C-
hydrolysate (acid pH) equal to 5.45 x 10¹⁶ RNA nucleotides (27). Determination of the relative rate of stable RNA synthesis. The relative rate of stable RNA synthesis, rJ r,, was determined by hybridizing pulse-labeled (1 min with [3H]uridine; 5.0 ,uCi/ml; specific activity, 28 mCi/ mmol) bacterial RNA to A dilv-S DNA immobilized on nitrocellulose filters, as described previously (27). The hybridization reaction was carried out for 18 h at 67°C. Each hybridization vial contained one T5 DNA and two A dilv-S DNA filters (10 ,g/DNA filter), 50 ng of 35 25 15 pulse-labeled RNA, and 5 ng of purified 14C-labeled E lution volume ( ml ) rRNA in 1.0 ml of 2x SSC-0.5% sodium dodecyl FIG. 2. Elution profile in the ppGpp region of sulfate (SDS) (1x SSC is 0.15 M NaCl, 0.015 M nucleotides separated by HPLC. Cellular nucleotides sodium citrate). The A dilv-5 DNA contains a bacterial from a culture grown at 40°C to an of 1.016 were rRNA gene and, therefore, specifically hybridizes extracted and analyzed as described in the text. For radioactivity corresponding to rRNA, including spacquantitation, the area under the ppGpp peak (stipled) ers (8). Nonspecific hybridization was corrected for by was determined, using a base line as indicated (-----). subtracting the radioactivity hybridized to T5 DNA. For the peak shown an amount of 12.3 x 10⁻⁴ A254 U The fraction of pulse-labeled RNA that is rRNA was converted into rJr, by taking tRNA into account and of ppGpp was determined.
OD4J
VOL. 151, 1982
RNA SYNTHESIS PARAMETERS
50t-
9 0
40 a 0
30
IV 0
E
CL
-20 1
C&
)F
10
25 30 35 40 Temperature ( °C) FIG. 3g. Temperature dependence of ppGpp concentration in E. coli B/r. For each growth temperature, three cultures and six samples per culture were analyzed; shown is the range for the averages from each culture (see example in Table 6).
20
assuming that tRNA and rRNA are always synthesized in constant proportions equal to 14:86 (9, 30). Measurement of the rRNA chain eongation rate. The rRNA chain elongation rate was determined, as previously described (24, 26), by measunrng the residual synthesis of tRNA after inhibiting the initiation of new RNA chains by the drug rifampin. This method de-
Temp
Expt
(OC)
no.
21
25
30
37
42
pends on the presence of tRNA genes at the distal (3') end of the rRNA transcriptional units (1). Our previous data indicated that 20 to 30%o of all tRNA is cotranscribed with rRNA, most of it at the distal end of the rRNA precursors (26). At an OD460 of 0.1, an exponentially growing culture (15 ml) was labeled with 2.5 ,ui of [2-14C]uridine (53 mCi/nmol) and incubated until an OD460 of about 0.4 was reached. At this time, 36 FCi of [5-3H]uridine and rifampin (250 Fg/ml) were added. Samples (1 ml) were removed at various times into an equal volume of ethanol-phenol stopping solution (7.5 ml of ethanol, 2.1 ml of 0.1 M sodium acetate [pH 7.5], 0.2 ml of phenol, 0.2 ml of Na2-EDTA) at 00C. The cells were harvested by centrifugation, suspended and lysed in 1 ml of boiling electrophoresis sample solution (0.2x TEB [ x TEB = 0.9 M Tris, 90 mM Na2 EDTA, 0.9 M boric acid], 1% SDS, 10%o glycerol, and 0.001% bromophenol blue) for 45 s, and then stored at room temperature.
The low-molecular-weight RNA species were separated on a 12% acrylamide-bisacrylamide (19:1)-0.1% SDS gel (10 cm long, 2 mm thick) with a 5% acrylamide-bisacrylamide (19:1) stacking gel (5 cm long). Sample lysates (100 p1) were added to each slot and electrophoresed at 10 V/cm for 6 to 7 h in 1 x TEB0.1% SDS buffer. The RNA bands were located by fluorography, as described by Bonner and Laskey (2). The bands containing 4S tRNA were sliced out of the gel and incubated in 1.0 ml of 0.2 M NaOH at 37°C
TABLE 1. RNA and protein content at different temperatures Stable RNA, Rs Protein, P Growth rate 1o16 1017 (doublings/h) A,,/OD46a nucl./ 0D,IU A75MOD4d ODg aa
1 2 3
0.42 0.42 0.42
1.04 1.10 1.08 1.10
4 5 6
0.72 0.73 0.71
1.09
7 8 9
0.95
881
RIP nucl.400 aa
5.9
32
0.51 0.46 0.50 0.52
5.7
102
10.3
1.1241.11 1.11J
6.0
32
0.56 0.54 0.55 1.55
6.2
112
9.7
0.95 0.92
1.19 1.18 1.19 1.20
6.5
35
0.43 0.44 0.44
5.0
90
12.9
10 11 12
1.28 1.28 1.28
1.06 1.08 1.12 1.22
6.1
33
0.47 0.48 0.48 0.50
5.5
98
11.1
13 14
1.30 1.33 1.28
0.93 0.99 0.97
5.3
29
0.5110.52
5.9
106
8.9
0.44J
0.521
15 0.98J 0.52J a Total RNA, including mRNA, measured as of an RNA hydrolysate (acid pH), normalized to OD4 of culture. b Stable RNA, assuming 3% of total RNA to be mRNA (18, 22); for conversion of A260 into nucleotides (nucl.), see the text. c Assuming the molecular weight of an average nucleotide residue in E. coli stable RNA to be 324.3. d Total TCA-precipitable protein as determined by the A750 of a colorimetric protein assay (see the text). ' Assuming 5.6 x 10¹⁵ amino acid (aa) residues per F.g of protein. f Determined from the A750 of the Lowry assay by calibration with weighed amounts of bovine serum albumin. An A750 = 1.0 corresponded to 204 ,ug of bovine serum albumin per assay.
A2w.
RYALS, LITTLE, AND BREMER
882
J. BACTERIOL.
TABLE 2. Determination of the relative rate of stable RNA synthesis at 37°C Expta
Hybridized radioactivity cpm of 3Hb cpm of 14CC
2
Hybridization effi-
l,/if
rA/r9 (avg)
T5 58 53 75
A dilv-5
T5
1,353 1,4% 1,736
389 354 393
3 0 3
3,590
4 422
0.91 0.84 0.92
0.38 0.46 0.48
0.48 0.57 0.55 0.60
1,379 1,528 1,569
41 44 47
402 331 359
10 2 3
3,677
422
0.91 0.77 0.84
0.39 0.50 0.48
0.49 0.62 0.57 0.60
X dilv-5
1
Total radioactivity (total cpm)d
3Hcicye
42 2 1,410 3% 0.93 0.39 0.49 53 347 2 1,435 422 3,681 0.81 0.44 0.5510.53 55 351 1,472 2 0.82 0.45 0.56J a A 0.5-ml amount of culture, exponentially growing at 37°C in glucose minimal medium, was pulse-labeled with [3H]uridine for 1 min at an OD4w of 0.4 to 0.5. Three hybridization mixtures were prepared from each pulselabeled sample. b Counts per minute of 3H was pulse-labeled RNA bound to filters with either A dilv-5 DNA (hybridized RNA, sum of two filters per vial) or T5 DNA (background, one filter per vial). c Counts per minute of 14C was purified [14C]rRNA added to the hybridization mixture to determine the efficiency of the hybridization reaction. d Total TCA-precipitable radioactivity per vial. ' Hybridization efficiency was counts per minute of 14C specifically hybridized to X dilv-5 DNA/total TCAprecipitable counts per minute of 14C. f 4,1l was the fraction of total pulse-labeled RNA that was rRNA, the quotient of isotope ratios (3H/14C) hybridized/(CH/14C) total. g rlr, was the relative rate of stable RNA synthesis calculated from 1,l1,, using the formula rlr, = {1 + [0.86/(l, It) -l] X 0.861-1.
3
overnight. Radioactivity in the hydrolyzed RNA was determined after the addition of 10 ml of toluene-based scintillation fluid containing 15% (vol/vol) of Bio-Solv BBS-3 (Beckman Instruments, Inc.) in a liquid scintilTABLE 3. Relative rate of stable RNA synthesis at different temperatures Temp (°C) Expt no. rjr,a (avg) 21 1 0.60 2 0.57 0.57 0.53 3 25
4 5 6
0.57 0.55 0.57 0.60
30
7 8 9
0.57 0.57 0.57 0.57
37
job
0.55 0.57 0.55 0.53
11 12
42
arjr,
13 0.54 14 0.54 0.55 15 0.58 was determined as described in Table 2,
footnote g. b Experiments 10 to 12 are the same as experiments 1 to 3 in Table 2.
lation counter. The isotope ratio of 3H to "C in the tRNA was determined and plotted as a function of time (Fig. 1). The kinetics of tRNA accumulation after rifampin show a well-defined break at the time when tRNA accumulation ceases (Fig. 1), which represents the synthesis time of the rRNA precursor. The rRNA chain elongation rate was calculated from the synthesis time of the rRNA precursor and from the length of this precursor, assumed to be 6,000 nucleotides (sum of the mature rRNA species that have been sequenced [21] plus estimates of spacer regions [1]). The method depends on the rapid inhibition of RNA chain initiation after the addition of rifampin. We used a rifampin concentration of 250 ,ug/ml, which is 1,000 times higher than the concentration needed to inhibit RNA polymerase in vitro; under such conditions the lag in the action of rifampin can be expected to be negligibly small (15). Previous measurements of the kinetics of residual tRNA labeling as a function of rifampin concentration (0.2 to 1 mg/ml) gave no evidence of a (hyperbolically) decreasing time of the break point with increasing rifampin concentration
(24).
Determination of RNA polymerase synthesis. Cultures (10 ml) were grown exponentially to an OD460 of 0.2, labeled with 0.2 ,uCi of [14C]leucine per ml (309 mCi/mmol), and further incubated for two generations. The cells were harvested by centrifugation, suspended in 1.0 ml of sample solution (0.05 M Tris-hydrochloride [pH 6.8], 1% SDS, 1% P-mercaptoethanol, 10% glycerol, 0.2% bromophenol blue), and lysed by heating for 2 min in boiling water. Cellular proteins were separated by SDS-gel electrophoresis, using a 10-cm
VOL. 151, 1982
RNA SYNTHESIS PARAMETERS
TABLE 4. Measurement of the stable RNA chain elongation rate at various temperatures Duration of tRNA
Temp (0C)Expt ( C) Expt no. Temp
synthesis
~~~after
rifampin
20.5
25
30
37
Chain
growth rate (nucl./s)b
1 2 3
(S)a (avg) 192 192 188 180
4 5 6
132 131 132 133
45
7 8 9
102 101 102 103
59
10 11 12 13
69 71 70 72 69)
86
32
42
14 50 15 52 51 118 50 16 a Determined as described in the legend to Fig. 1, illustrating experiment no. 7 of this table. b Chain growth rate, 6,000 nucleotides (nucl.) per rRNA transcript (1), divided by duration of tRNA synthesis after rifampin.
resolving gel with 5% acrylamide-N,N'-diallyltartardiamide (DATD; 30:1.18)-0.375 M Tris-hydrochloride (pH 8.8)-0.1% SDS (with a 5-cm stacking gel)-3% acrylamide-DATD (30:1.18)-0.06 M Tris-hydrochloride (pH 6.8)-0.1% SDS. The electrode buffer was 0.025 M Tris-hydrochloride (pH 8.3)-0.19 M glycine0.1% SDS. Samples (100 sJ) were applied to five slots in the gel and electrophoresed at 10 mA (constant current) for 10 h. After electrophoresis, the gels were
fixed for 15 min in 0.6 M trichloroacetic acid (TCA) and dried. Protein bands were visualized by autoradiography. The band corresponding to the 13' subunit of RNA polymerase was cut out, and the gel slice was hydrolyzed in 0.5 ml of 30% H202-1% NH40H for 16 h at 37°C with gentle shaking. Radioactivity was determined after adding 6 ml of scintillation fluidBio-Solv BBS-3, as described above. The radioactivity in total cellular protein was determined by precipitating 100-,ul aliquots with TCA. After correcting for quenching and counting efficiency, the fraction of ,B' RNA polymerase subunit in total protein was calculated and converted into the fractional synthesis rate of RNA polymerase, ap, by multiplication with 2.4 (molecular weight ratio of core RNA polymerase enzymes [398,000] to 1' subunit [165,000]) (6). This assumes that the amount of core RNA polymerase is limited by the amount of 1 and 1' subunits (13, 16, 17, 23). Quandtation of ppGpp. At an OD4w of approximately 1.0, 120 ml of culture that had grown exponentially for at leasf 10 generations was treated with 12 ml of 1.8% formaldehyde and cooled on ice for 20 min. The
TABLE 6. Quantitation of ppGpp for three cultures of E. coli B/r grown at 300C Amt of ppGpp per sample Intraloaded (10-5) cellular Massa ppGpp (OD460) io-5 conc (pmol/ pmolc A25 Ub
1.03
1.06
55.3 51.8 49.0 54.5 52.6 52.6
41.3 38.6 36.6 40.7 39.2 39.2
20.0 18.7 17.8 19.8 19.0 19.0
55.3 53.4 54.5 52.2 56.9
41.3 39.8 40.7 38.9 42.5 (18.6)d
19.5 18.8 19.2 19 2 18.3 . 20.0 (8.8)d
(24 .9)d TABLE 5. RNA polymerase synthesis at different temperatures ctpa (%) (avg) Expt no. Temp (°C) 1 1.03 ± 0.05 20 1.14 ± 0.12 1.09 2 3 0.90 ± 0.07 30
4 5 6
1.11 ± 0.12 1.08 ± 0.02 1.06 1.00 + 0.09
1.09 t 0.05 1.21 ± 0.03 1.10 0.99 ± 0.04 a ap, Percent of total protein that was RNA polymerase core enzyme, determined as described in the text; average and standard deviations from five lanes of one electrophoresis gel. 42
7 8 9
883
19.1
37.5 50.2 19.5 35.1 18.3 47.0 53.8 40.1 20.9 20 0 49.8 37.2 19.4 39.2 20.4 52.6 54.5 21.2 40.7 a Mass concentration of the culture at sampling time. b Calculated from the area corresponding to the ppGpp peak in HPLC elution profiles (Fig. 2), as described in the text. c Total picomoles of ppGpp in the 200-,ul samples analyzed (corresponding to the amount of ppGpp in 2 ml of culture), calculated as described in the text. d The value obtained for this sample, being significantly different from all others, was excluded when the average concentration of ppGpp in this experiment was calculated.
0.96
884
J. BACTERIOL.
RYALS, LITTLE, AND BREMER TABLE 7. Temperature dependence of parameters related to RNA synthesis Stable
(0C) Temp (°C) Temp
Bacterial growth te
RNA* (R3) 016
(1L)
(doublings/h) nucl./
e
Stable RNA chain
sis of
growth
NA ProRNA | R
tein*; tei pely-
Ribosomal
stable rate* protein syn- Protein synthesis per ribosome (10P(1017 syeRNA* synthe (C.) thesis()(a,) (er) (amino acid residuals/s) ) | (rJr,) (nucle- | ( acids/ resi-
dues/s) 20 25 30 35 40
0.41 (0.43) 0.65 (0.66) 0.91 (0.90) 1.18 (1.16) 1.35 (1.44)b
Equation or Fig. 3d reference
5.90 5.90 5.90 5.90 5.90
5.60 5.60 5.60 5.60 5.60
1.06 1.06 1.06 1.06 1.06
56 56 56 56 56
30 45 59 76 103
3.82 6.07 8.49 11.01 12.60
13 13 13 13 13
Fig. 3a Fig. 3b Fig. 3f Fig. 3c Fig. 3e ar =
1.19(R,/P)
er =
(aa/rib) (12/T). reference ar 60(s/mm) 10
x lOo
samples were divided into six equal volumes (equivalent to 20 ml of culture), and the cells were harvested by centrifugation. The cells were suspended in 1 ml of 0.1 M KOH and were allowed to lyse at 0°C. After 30 min, the KOH was neutralized by the addition of 5 ,ul of 88% phosphoric acid and 1 ml of high-pressure liquid chromatography (HPLC) buffer (0.03 M KH2PO4, 0.01 M tetrabutylammonium phosphate, 14.8% acetonitrile, [pH 3.25] with phosphoric acid). Cellular debris was removed by centrifugation (30,000 x g for 45 min), and the supernatant was retained for HPLC analysis. Each milliliter of this extract contained the nucleotides present in approximately 10 OD460 U of culture or 4 x 10⁹ cells. To separate ppGpp from other nucleotides, 200 1l of the nucleotide extract was fractionated by ion-pair reverse-phase HPLC (Ultrasphere IP-C18 column; Altex Scientific, Inc., Berkeley, Calif.) with HPLC buffer (flow rate = 1 ml/min at 2,000 lb/in2). The A254 of the eluant was continuously monitored. For quantitation, the area of the peak corresponding to ppGpp (Fig. 2) was determined, converted into A254 units, and then into moles, using a factor of 74.6 nmol/A254 U. The intracellular concentration of ppGpp (in picomoles per OD460 unit of culture) was obtained by taking into account the amount of cell mass (OD40 units) present in each sample chromatographed. RESULTS
Parameters related to RNA synthesis as a function of growth temperature. The following parameters related to RNA synthesis
were mea-
sured in exponentially growing cultures of E. coli B/r in glucose minimal medium at different temperatures between 20 and 42°C: the amount of total RNA per mass (from which the amount of stable RNA per mass [R,/OD4w] was calculated; Table 1; Fig. 3a), fraction of the instantaneous rate of total RNA synthesis that corresponds to stable rRNA and tRNA (r,lr,; Tables 2
and 3; Fig. 3c), stable RNA chain growth rate (c,; Table 4; Fig. 3e), fraction of total protein that is RNA polymerase core enzyme (ap; Table 5; Fig. 3f), concentration of total protein (PI OD4.0; Table 1; Fig. 3b), culture growth rate (R, in doublings per hour; Table 1; Fig. 3d), and the concentration of ppGpp (ppGpp/OD4w; Table 6; Fig. 3g). The stable RNA chain growth rate, culture growth rate, and ppGpp concentration increased with increasing temperature, whereas the concentrations of protein, RNA, and RNA polymerase remained essentially temperature invariant. From these directly observed parameters, further parameters were calculated (Table 7): the number of RNA polymerase core enzyme molecules per mass (Np/OD46), the number of RNA polymerase enzyme molecules actively engaged in transcription (Np*/OD46, obtained as the number of growing RNA chains), RNA polymerase activity (,p = Np*/Np = active/total RNA polymerase), the fraction of active RNA polymerase that is engaged in stable RNA synthesis (6., obtained from rir,), and the protein synthesis rate per average ribosome (e,). With the exception of the protein synthesis rate per ribosome, these parameters were temperature invariant. Protein concentration and the protein synthesis rate are indirectly relevant for RNA synthesis since they determine the amount and the synthesis rate of RNA polymerase, together with the parameter ap. The significance of these findings is discussed below. DISCUSSION Temperature dependence of the bacterial growth rate. The bacterial growth rate (>, in
,u
RNA SYNTHESIS PARAMETERS
VOL. 151, 1982
885
TABLE 7-Continued
TotalToa RNA Active
TotAlGao plmrNA
synthe- RNA Guanosine Stable RNA syn- mRNA synthesis sis rate polymer; polymerrate (rm) (1013 RNA polymerase synthesizing thesis rate (r,) (ro)3 (N10) (1011 merase ac- phos(10 RNA (1013 nucleotides nucleotides per s (1013 tivity (,p) phate stable RNA (4,) (%) polymer- poly per OD4w) nucleoper s per OD40) tidsae mle-ase mol- (%) (ppGp (pmol/ cules/ per s 43 43 43 43 43
0.44 0.67 0.98 1.27 1.45
0.56 0.93 1.25 1.61 1.85
'S = 1 +
[(r]rV-1][c,/c,,
S
[1.2 R3(ln2/-r)Id
per
OD4)
1.00 1.56 2.22 2.88
4.47 5.09 4.98 5.01
3.29
4.21
___
Np =
=
(rmtc,
OD4w) 16.20 16.20 16.20 16.20 16.20
p= (r,/c,) rj(rjr,)-1-1] rS+rm +
rm =
ODw)
ecules/
28 31 31 31 26
p1p =
(apoxP)l (Np*lNp) 3,660e
)
13 18 19 26 48
Fig. 3g
x 1OOo
I.I
a Parameters with an asterisk (*) were observed (Fig. 3a through g; using the smoothed curves shown rather than actually observed values); all others (without asterisk) were calculated. b Values in parentheses were calculated from c, and er, using the formula ,u = 0.40 /-e (see the text). c cm = mRNA chain elongation rate, assumed to be 0.6 of stable RNA chain elongation rate; for equation see reference 4. d The factor 1.2 corrects for unstable spacers in the stable RNA precursors, i.e., r, includes synthesis of the spacers. ' The number 3,660 = amino acid residues per core RNA polymerase molecule.
doublings per hour) depends on five parameters that were measured here as a function of growth temperature: *,, 13p, c3, ap, and er (Table 7). With these parameters, the growth rate is given
by (3):
p.
=
1.lV*lsPpcsaper
where the factor 1.1 is a composite of several constants:
1.1 = (3,600/ln2) A/0.86/1.2 x 4,560 x 3,660
(3,600 = seconds per hour; 0.86 = fraction of stable RNA that is rRNA [9, 26]; 1.2 = length of stable RNA transcripts, including spacer regions, relative to the length of mature stable RNAs [1]; 4,560 = rRNA nucleotides per 70S ribosome [21]; 3,660 = amino acid residues per core RNA polymerase [6]). This relationship is not an empirical approximation but was derived from and is implied in the definitions of its parameters (3). Our results (Table 7) showed that two of these parameters, cs and er, i.e., the rRNA and peptide chain elongation rates, increased with increasing temperature. Substituting values for the temperature-invariant parameters from Table 7 (45 = 0.43; ,p = 0.30; ap = 0.0106), we obtain =
0.04
\/~s-~er = 0.037 Vcyvc
(er is the protein synthesis rate per average ribosome; cp is the protein synthesis rate per active ribosome or peptide chain elongation rate, assuming 80%o of the ribosomes are active [11]). It is seen that the bacterial growth rate is proportional to the product of the square roots of the rRNA and the peptide chain elongation rates (Table 7, calculated IL values). Since between 20 and 40°C, the RNA and peptide chain elongation rates increase similarly, although not identically, with temperature, the growth rate is also nearly proportional to either chain elongation rate, e.g., ,u = a x cp, where a (= 0.037 x X\/l/V ) is the rather invariant quotient of two variables, including cp. Thus, the seemingly simple proportionality of the bacterial growth rate to the peptide chain elongation rate is actually the result of two more complex (square whose product determines root)/felationships, the rate of growth. Temperature dependence of the relationship between ppGpp and RNA synthesis parameters. The concentration of ppGpp in the bacteria was found to increase with temperature (i.e., a steady-state, not a transient effect). Between 20 and 40°C, this increase was 3.4-fold (Fig. lg), and the ppGpp levels varied within the same range as those observed during exponential growth in different media at constant temperature (19). However, the changes in ppGpp levels
886
RYALS, LITTLE, AND BREMER
at a constant temperature are associated with
major changes in the macromolecular composition of the cells and in the activity of ribosomal and transfer RNA genes, whereas the changes in ppGpp levels due to changing temperature are not associated with significant changes in those physiological parameters (Fig. 3). Furthermore, at a constant temperature, the bacterial growth rate decreased with increasing ppGpp levels, whereas with a constant growth medium but different temperatures, the growth rate of the bacteria increased with increasing ppGpp levels. These differences in the correlation between ppGpp and physiological parameters can be explained by the assumption that the concentration of ppGpp required to bring about a given stable RNA gene activity (rslrt, or f,) is temperature dependent. If ppGpp acts by altering the conformation of RNA polymerase enzyme, as has been suggested from in vitro observations (29), then this would mean that the interaction of ppGpp with the RNA polymerase is temperature dependent such that higher concentrations of ppGpp are required at higher temperatures to affect the RNA polymerase to a given extent. Transient effects of a temperature upshift. Gallant et al. (12) observed that stable RNA accumulation increased 1.5-fold after a temperature shift from 23 to 40°C. At the same time, the concentration of ppGpp increased 30-fold, apparently as a result of a transient amino acid deprivation immediately after the temperature shift (see above). They therefore suggested that a temperature upshift provided an anomalous correlation between ppGpp and stable RNA synthesis, which led them to question the role of ppGpp in the stringent control system. Although the results reported here are for exponentially growing cultures, these results have certain implications for the interpretation of the temperature shift experiments. The rate of stable RNA synthesis is given by the relationship (3): rs
=
Np
X
p
X
us
X
cs
(see definitions in Table 7). In a temperature shift from 23 to 40°C, a threefold increase in the stable RNA chain elongation rate would be expected (c5; Table 7), producing a threefold increase in the stable RNA synthesis rate. That only a 1.5-fold increase was observed (12) indicates that one or more of the other parameters must decrease. In vitro experiments have indicated that ppGpp mediates its action by inducing a conformational change in the RNA polymerase which is associated with a decrease in the ability of the enzyme to recognize stable RNA promoters (29). The parameter Js, the fraction of total RNA polymerase actively engaged in stable RNA synthesis, is an in vivo measure for this
J. BACTERIOL.
response. We have previously shown that is decreases maximally twofold after amino acid starvation of a relA+ strain (24), conditions which also produce high concentrations of ppGpp. Thus, if the transient 30-fold increase of ppGpp after the temperature upshift produces a twofold reduction in 4s, the net effect (c, increases threefold, *, decreases twofold) would be a 1.5-fold stimulation of stable RNA synthesis as observed. Hence, as long as the kinetic changes in *, and other parameters have not been measured, the observations of Gallant et al. (12) do not yet invalidate the idea of ppGpp being a controlling element for stable RNA synthesis. ACKNOWLEDGMENTS This work was supported by Public Health Service grants GM15412 and GM25948. We thank Sally Rahn for the careful typing of this manuscript. LITERATURE CITED 1. Apirion, D., B. Ghora, G. Plautz, T. Misra, and r. Gegenheimer. 1980. Processing of rRNA and tRNA in Escherichia coli: cooperation between processing enzymes, p. 139-154. In D. S611 et al. (ed.), Transfer RNA: biological aspects. Cold Spring Harbor Laboratory, Cold Spring Harbor, N.Y. 2. Bonner, W., and R. Laskey. 1974. A film detection method for tritium-labeled proteins and nucleic acids in polyacrylamide gels. Eur. J. Biochem. 46:83-88. 3. Bremer, H. 1975. Parameters affecting the rate of synthesis of ribosomes and RNA polymerase in bacteria. J. Theor. Biol. 53:115-124. 4. Bremer, H., L. Berry, and P. Dennis. 1973. Regulation of ribonucleic acid synthesis in Escherichia coli B/r: an analysis of a shift-up. J. Mol. Biol. 75:161-179. 5. Brunschede, H., T. Dove, and H. Bremer. 1977. Establishment of exponential growth after a nutritional shift-up in Escherichia coli B/r: accumulation of deoxyribonucleic acid, ribonucleic acid and protein. J. Bacteriol. 129:10201033. 6. Burgess, R. 1969. Separation and characterization of the subunits of ribonucleic acid polymerase. J. Biol. Chem. 244:6168-6176. 7. Cashel, M., and J. Gallant. 1969. Two compounds implicated in the function of the RC gene of E. coli. Nature (London) 221:838-841. 8. Collins, J., N. Fill, P. JOrgensen, and J. Friesen. 1976. Gene cloning of Escherichia coli chromosomal genes important in the regulation of ribosomal RNA synthesis, p. 356-367. In N. C. Kjeldgaard and 0. Maaloe, Control of ribosome synthesis. Alfred Benzon Symposium IX. Munksgaard. 9. Dennis, P. 1972. Regulation of ribosomal and transfer ribonucleic acid synthesis in Escherichia coli. J. Biol. Chem. 247:2842-2845. 10. Dennis, P., and H. Bremer. 1974. Macromolecular composition during steady-state growth of Escherichia coli B/r. J. Bacteriol. 119:270-281. 11. Forchhammer, J., and L. Lindahl. 1971. Growth rate of polypeptide chains as a function of the celi growth rate in a mutant of Escherichia coli 15. J. Mol. Biol. 55:563-568. 12. Gallant, J., L. Palmer, and C. Pao. 1977. Anomalous synthesis of ppGpp in growing celis. Cell 11:181-185. 13. Hayward, R., and S. Fyfe. 1978. Over-synthesis and instability of sigma protein in a merodiploid strain of Escherichia coli. Mol. Gen. Genet. 159:89-99. 14. Helmstetter, C. 1967. Rate of DNA synthesis during the
VOL. 151, 1982
15. 16.
17.
18. 19.
20. 21.
22.
division cycle of Escherichia coli B/r. J. Mol. Biol. 24:417-427. Hirsh, J., and R. Schlelf. 1973. In vivo experiments on the mechanism of action of L-arabinose C gene activator and lactose repressor. J. Mol. Biol. 80:433-444. Iwakura, Y., and A. Ishihama. 1975. Biosynthesis of RNA polymerase in Escherichia coli. II. Control of RNA polymerase synthesis during nutritional shift up and down. Mol. Gen. Genet. 142:67-84. Iwakura, Y., K. Ito, and A. Ishihama. 1974. Biosynthesis of RNA polymerase in Escherichia coli. I. Control of RNA polymerase content at various growth rates. Mol. Gen. Genet. 133:1-23. Kennel, D. 1968. Titration of the gene sites on DNA by DNA-RNA hybridization. II. The Escherichia coli chromosome. J. Mol. Biol. 34:85-103. Lagosky, P., and F. Chang. 1981. Correlation between RNA synthesis and basal level guanosine 5'-diphosphate, 3'-diphosphate in relaxed mutants of Escherichia coli. J. Biol. Chem. 256:11651-11656. Lowry, O., N. Rosebrough, A. Farr, and R. Randall. 1951. Protein measurement with the Folin phenol reagent. J. Biol. Chem. 193:265-275. Noiler, H. 1980. Structure and topography of ribosomal RNA, p. 3-22. In G. Chambliss et al. (ed.), Ribosomes: structure, function, and genetics. University Park Press, Baltimore. Norris, T., and A. Koch. 1972. Effect of growth rate on the relative rates of synthesis of messenger, ribosomal and transfer RNA in Escherichia coli. J. Mol. Biol. 64:633-
RNA SYNTHESIS PARAMETERS
887
649. 23. Pederson, S., P. Bloch, S. Reeh, and F. Neidhart. 1978. Patterns of protein synthesis in E. coli: a catalog of the amount of 140 individual proteins at different growth rates. Cell 14:179-190. 24. Ryals, J., and H. Bremer. 1982. reIA-dependent RNA polymerase activity in Escherichia coli. J. Bacteriol. 150:168-179. 25. Schaechter, M., 0. Maal$e, and N. KJeldgaard. 1958. Dependency on medium and temperature of cell size and chemical composition during balanced growth of Salmonella typhimurium. J. Gen. Microbiol. 19:592-606. 26. Shen, V., and H. Bremer. 1977. Rate of ribosomal ribonucleic acid chain elongation in Escherichia coli B/r during chloramphenicol treatment. J. Bacteriol. 130:1109-1116. 27. Shepherd, N., G. Churchward, and H. Bremer. 1980. Synthesis and activity of ribonucleic acid polymerase in Escherichia coli. J. Bacteriol. 141:1098-1108. 28. Stent, G., and S. Brenner. 1961. A genetic locus for the regulation of ribonucleic acid synthesis. Proc. Natl. Acad. Sci. U.S.A. 47:2005-2014. 29. Travers, A., C. Karl, and H. Mace. 1981. Transcriptional regulation by bacterial RNA polymerase, p. 113-130. In S. W. Gover and D. A. Hopwood (ed.), Genetics as a tool in microbiology. Cambridge University Press, Cambridge, England. 30. Yuan, D., and V. Shen. 1975. Stability of ribosomal and transfer ribonucleic acid in Escherichia coli B/r after treatment with ethylenedinitrioltetraacetic acid and rifampicin. J. Bacteriol. 122:425-432.