PHYSIOLOGICAL ECOLOGY
Temperature-Dependent Development and Temperature Thresholds of Codling Moth (Lepidoptera: Tortricidae) in Iran HOSSEIN RANJBAR AGHDAM,1 YAGHOUB FATHIPOUR,1,2 GHOLAMREZA RADJABI,3 3 AND MOHAMMADREZA REZAPANAH
Environ. Entomol. 38(3): 885Ð895 (2009)
ABSTRACT Developmental rate models and biological parameters estimated from them, especially lower and upper temperature thresholds and optimal temperature, can help to forecast phenological events of codling moth, Cydia pomonella L. (Lepidoptera: Tortricidae), in apple orchards. We studied the developmental time of immature stages of codling moth at eight constant temperatures ranging from 10 to 35⬚C and modeled their developmental rate as a function of temperature using 13 published nonlinear and 2 linear models. Data were Þtted to developmental rate models and temperature thresholds and the optimal temperatures were estimated. The models were evaluated based on adjusted coefÞcient of determination (R2adj) and Akaike information criterion (AIC), in addition to coefÞcient of determination (R2) and residual sum of squares (RSS). The thermal constants were 79.80, 312.60, 232.03, and 615.32 DD for egg, larva, pupa, and overall immature stages of codling moth, respectively, using the Ikemoto and Takai linear model. The Ikemoto and Takai linear model estimated lower temperature thresholds as 9.97, 8.94, 10.04, and 9.63⬚C for egg, larva, pupa, and overall immature stages, respectively. Among the nonlinear models, the third-order polynomial Þt the data well. This model estimates optimal temperature accurately. Brie` re-1 and Brie` re-2 accurately estimated the lower and upper temperature thresholds considering model evaluation criteria and accuracy of estimations. KEY WORDS codling moth, Cydia pomonella, development, thermal threshold, linear and nonlinear models
The codling moth, Cydia pomonella L. (Lepidoptera: Tortricidae), is one of the most devastating pest insects in apple orchards worldwide (Dorn et al. 1999). This pest occurs in all of the apple orchards of Iran (Radjabi 1986), where one to four generations are present each year, and insecticide applications for control of this pest are needed beginning with the appearance of the Þrst larval generation in approximately mid-May (Behdad 1991). Understanding the factors governing C. pomonella development and implementing this knowledge into forecast models enables effective timing of interventions and increases efÞcacy and success of control measures (Ku¨ rt et al. 2006). Temperature is a critical abiotic factor inßuencing the dynamics of mite and insect pests and their natural enemies (Huffaker et al. 1999). The rate of development of codling moth is governed by environmental temperature (Rock and Shaffer 1983). Phenological models, using physiological time data, have been developed for codling moth to predict emergence of adults from the overwintering generation, eclosion of eggs, larval and pupal development, and generation 1 Department of Entomology, Faculty of Agriculture, Tarbiat Modares University, PO Box 14115-336, Tehran, 1497713111 Iran. 2 Corresponding author, e-mail:
[email protected]. 3 Iranian Research Institute of Plant Protection, Tehran, 1985713133 Iran.
time (Falcon and Pickel 1976, Geier and Briese 1978, Brunner et al. 1982, Rock and Shaffer 1983, Dastqeib and Seyedoleslamy 1988, Setyobudi 1989, Pitcarin et al. 1992, Howell and Neven 2000). These models, all based on a linear relationship between temperature and developmental rate, have been used with varying degrees of success to time pesticide application for codling moth control (Rock and Shaffer 1983, Dastqeib and Seyedoleslamy 1988, Howell and Neven 2000). Linear approximation enables the estimation of lower temperature thresholds and thermal constants within a limited temperature range (Campbell et al. 1974, Hone˘ k 1999, Howell and Neven 2000, Jarosˇ ik et al. 2002). Because of their complexity, curvilinear models have not been routinely used (Howell and Neven 2000). Developmental rate, expressed as the reciprocal of time taken to develop from one stage to another (Cossins and Bowler 1987), is nil at the lower temperature threshold, increases with temperature before leveling off at the optimal temperature, and decreases rapidly as the upper temperature threshold is approached (Roy et al. 2002). This relationship is curvilinear near the extremes but approximately linear at moderate temperatures (Wagner et al. 1984). To describe the developmental rate more realistically and over a wider temperature range, several nonlinear models have been applied (Stinner et al. 1974, Logan
0046-225X/09/0885Ð0895$04.00/0 䉷 2009 Entomological Society of America
ENVIRONMENTAL ENTOMOLOGY
886
et al. 1976, Lactin et al. 1995, Brie` re et al. 1999, Roy et al. 2002, Kontodimas et al. 2004, Arbab et al. 2006). These models provide value estimates of lower and upper temperature thresholds and optimal temperature for development of a given stage. The objectives of this study were to develop knowledge of the thermal characteristics of a codling moth population collected from the Maragheh region in Iran and to estimate accurately optimal temperature and temperature thresholds using nonlinear temperature-driven rate models in addition to linear models. Materials and Methods Rearing Methods Codling moths were originally collected in 2005 from apple orchards of the Maragheh region, East Azerbaijan (Northwestern Iran), using trunk banding. One-faced ßuted cardboard bands (one 15- to 20-cmwide band per tree) were placed around the trunks of the trees to serve as pupation sites for wandering larvae. The bands were placed before the larvae begin to leave the apples to Þnd pupation sites and removed before moth emergence. Codling moths used in this study were the F2 generation of collected mature larvae. Larvae were reared on an artiÞcial diet developed by Bathon (1981) and modiÞed by Rezapanah (2001). We used cubic plastic media containers (2.5 cm height by 2.5 cm diameter with cap; Behin Plastic, Tehran, Iran) for individual codling moth larvae. Fluted Þberboard pieces were placed into these containers (see rearing conditions below) to provide a suitable pupation site for mature larvae. Fiberboard containing cocoons were removed and placed into similar new containers. Every 24 h, any emerged moths were transferred to transparent plastic jars (15 by 15 cm: height by diameter; Behin Plastic) for mating and oviposition. The bases of the jars were covered with rough cloth to prevent oviposition on this surface. Wax paper sheets were crumpled and ßattened and Þtted into the inner surface of the jar walls to provide an oviposition surface. Moist cotton pieces provided water requirements of the moths during mating and oviposition. The cotton pieces and oviposition substrates were replaced daily. Experimental Conditions Rearing was conducted at eight constant temperatures (10, 14, 20, 25, 27, 30, 33, and 35 ⫾ 0.5⬚C), 50 ⫾ 10% RH, and a photoperiod of 16:8 (L:D) h in growth chambers (Binder, Tuttlingen, Germany). The environmental conditions of each chamber were monitored with a temperature and relative humidity data logger (175-H2; Testo, Lenzkirch, Germany).
Vol. 38, no. 3
Larval Development Larvae (100 Ð300) ⬍24 h old, based on the rate of larval mortality at examined temperatures, were reared at one of the above temperatures in growth chambers. The larvae were placed singly in larval rearing containers using an artistÕs brush (size 000) under a laminar hood. During the Þrst 48 h of larval development, the light intensity in growth chambers was kept very subdued (one 30-W ßuorescent light per growth chamber) to prevent neonate larvae leaving the medium. Then the light intensity was increased (four 30-W ßuorescent lights per growth chamber). Development was considered complete when larvae began spinning cocoons. At this time, ßuted Þberboard pieces were placed in each container to serve as cocooning-pupation sites. Larvae-rearing containers were inspected for cocoons daily. The Þberboard pieces with cocoons were moved to another similar container. Pupal Development Cocoons ⬍24 h old were held at 10, 14, 20, 25, 27, 30, 33, or 35⬚C. Containers were checked and all emerged moths collected daily. Developmental Rate and Mathematical Models Developmental rate is the reciprocal of developmental time in days. These rates are used in linear and nonlinear models where data are added daily (Arbab et al. 2006). Development is completed when the sum of daily developmental rate values equals 1 (Curry et al. 1978). Therefore, the integral of the developmental rate function along time can be used to simulate the development of an organism exposed to different temperatures (Arbab et al. 2006). Therefore, the common and Ikemoto and Takai linear and 13 nonlinear descriptive models were used to determine relationship between temperature and codling moth developmental rate (Table 1). The parameters of interest are the lower and upper temperature thresholds (Tmin and Tmax, respectively), the optimal temperature (Topt), and the thermal constant (K). Most models are able to estimate two or more parameters. The models that estimate all of the temperature thresholds and optimal temperature are the Analytis, Hilbert and Logan, equation-16, Lactin, Briere-1, and Briere-2 (Table 1). In addition to the common linear model, the Ikemoto and Takai linear model was used to obtain more reliable estimates of the lower temperature threshold and thermal constant (Ikemoto and Takai 2000). The Ikemoto and Takai linear formula is shown in the following equation: 共DT兲 ⫽ K ⫹ T minD
Egg Development Two hundred to 600 eggs, each ⬍24 h old, on wax paper were incubated at 10, 14, 20, 25, 27, 30, 33, or 35⬚C. All eggs were checked daily for eclosion.
[1]
where D is the duration of development (days), T is temperature (⬚C), Tmin is the lower temperature threshold, and K is the thermal constant. This equation is derived from the common linear model. The Ike-
June 2009
RANJBAR AGHDAM ET AL.: TEMPERATURE-DEPENDENT DEVELOPMENT OF CODLING MOTH
887
Table 1. Mathematical models used to describe the effect of temperature on the developmental rate of codling moth and their capacity to estimate four important biological parameters Model
Tmin
Topt
Tmax
Thermal constant
Reference
Linear (common; Ikemoto and Takai)
●
䡩
䡩
●
Sigmoid (logistic)
䡩
䡩
䡩
䡩
Brie` re-1
●
●
●
䡩
Brie` re-2
●
●
●
䡩
Logan-6
䡩
●
●
䡩
Logan-10
䡩
●
●
䡩
Lactin
●
●
●
䡩
Third-order polynomial (Harcourt equation) Equation-16 Analytis
䡩
●
●
䡩
● ●
● ●
● ●
䡩 䡩
Hilbert and Logan Lamb (T ⱕ Topt)1
● 䡩
● ●
● 䡩
䡩 䡩
Taylor Stinner (T ⱕ Topt)1
䡩 䡩
● 䡩
䡩 䡩
䡩 䡩
Campbell et al. 1974, Frazer and McGregor 1992, Roy et al. 2002, Kheradmand et al. 2006, Golizadeh et al. 2007, and others Davidson 1942, 1944; Kontodimas et al. 2004; Arbab et al. 2006 Brie` re et al. 1999; Roy et al. 2002; Kontodimas et al. 2004; Haghani et al. 2006, 2007 Roy et al. 2002; Zamani et al. 2006; Haghani et al. 2006, 2007; Golizadeh et al. 2007; and others Logan et al. 1976, Roy et al. 2002, Kontodimas et al. 2004, Haghani et al. 2007, and others Logan et al. 1976, Roy et al. 2002, Kontodimas et al. 2004, Golizadeh et al. 2007, and others Lactin et al. 1995, Tasi and Liu 1998; Kontodimas et al. 2004, Zamani et al. 2006, Golizadeh et al. 2007, Haghani et al. 2007, and others Harcourt and Yee 1982, Lamb et al. 1984, Brie` re et al 1998, Kontodimas et al.2004 Kontodimas et al. 2004 Analytis 1977, 1979, 1980, 1981; Kontodimas et al. 2004; Arbab et al. 2006 Hilbert and Logan 1983, Roy et al. 2002 Lamb 1992, Roy et al. 2002, Kontodimas et al. 2004, Arbab et al. 2006 Taylor 1981, Taylor 1982, Roy et al. 2002 Stinner et al. 1974, Logan 1988, Kontodimas et al. 2004, Arbab et al. 2006
In this study, we Þtted the Lamb and Stinner equations at temperatures ⱕ Topt, because in the upper temperatures, the no. of observations was less than the no. of estimated parameters. ●, index for model ability to estimate parameter; 䡩, index for model disability to estimate parameter.
moto and Takai linear model represents a straight line with X ⫽ D and Y ⫽ DT (Ikemoto and Takai 2000). Temperature Thresholds and Parameter Estimation Standard temperature indices were calculated either directly from the models or by using a graphic method as described below. Lower Temperature Threshold. This temperature is often referred as the lower temperature threshold (Kontodimas et al. 2004) or the zero development temperature (Howell and Neven 2000). However, at the lower temperature threshold (Tmin), no measurable development is detected or the rate of development is zero. It can be estimated from the linear model as the intercept of the development curve with the temperature axis. It can also be estimated directly from some nonlinear models. The SE of Tmin was calculated from the following equation when a linear model was used: SE Tmin ⫽
r b
冑
2
冉 冊
s SE b ⫹ N ⫻ r 2 b
2
[2]
where s2 is the residual mean square of r, r is the sample mean, and N is the sample size (Campbell et al. 1974, Kontodimas et al. 2004). Optimal Temperature. At the optimal temperature (Topt), the rate of development is maximum. It may be estimated directly from the equations of some nonlinear models or as the parameter value for which their Þrst derivatives equals zero. The SEof Topt was esti-
mated from the nonlinear models (Kontodimas et al. 2004). Upper Temperature Threshold. At the upper temperature threshold, the rate of development is zero or life cannot be maintained for a long time. Most nonlinear models can estimate this temperature. The SE of Tmax was estimated from nonlinear models (Kontodimas et al. 2004). Thermal Constant. The thermal constant (K) determines the amount of thermal units (degree-days) that are needed to complete development. This parameter can be estimated from the linear model as the reciprocal of the slop (b). The thermal constant cannot be estimated from nonlinear models. The SE of K was estimated with the following equation (Campbell et al. 1974, Kontodimas et al. 2004: SE K ⫽ SE b/b 2
[3]
Statistical Analysis For statistical analysis, data were checked for normality using the Kolmogorov-Smirnov test. The effect of temperature on the developmental time of codling moth immature stages was analyzed using one-way analysis of variance (ANOVA). If signiÞcant differences were detected, the means of developmental time were compared using pooled SDs at the studied constant temperatures. The ANOVA was carried out using Minitab software (MINITAB 2000). Because we detected no development at 10 and 35⬚C, data from both temperatures were omitted from
888 Table 2.
ENVIRONMENTAL ENTOMOLOGY
Vol. 38, no. 3
Developmental time of the codling moth immature stages at six constant temperatures
Stage
Temperature (⬚C)
Number of individuals
Minimum developmental time (d)
Maximum developmental time (d)
Mean developmental time ⫾ SE (d)
14 20 25 27 30 33 14 20 25 27 30 33 14 20 25 27 30 33 14 20 25 27 30 33
410 537 289 405 477 135 38 81 120 150 79 37 24 58 79 91 52 22 24 58 79 91 52 22
17 8 4 4 4 4 53 23 14 13 13 13 50 20 12 9 9 9 125 59 33 28 28 30
21 11 6 6 5 5 71 43 28 22 20 19 64 35 17 16 14 15 144 81 48 39 37 36
18.67 ⫾ 0.04 9.34 ⫾ 0.04 4.80 ⫾ 0.02 4.52 ⫾ 0.03 4.04 ⫾ 0.01 4.19 ⫾ 0.03 58.34 ⫾ 0.67 32.38 ⫾ 0.47 18.77 ⫾ 0.25 15.44 ⫾ 0.14 15.62 ⫾ 0.20 17.22 ⫾ 0.23 56.29 ⫾ 0.76 26.36 ⫾ 0.40 14.73 ⫾ 0.15 12.69 ⫾ 0.11 11.96 ⫾ 0.15 12.50 ⫾ 0.26 133.54 ⫾ 1.12 68.46 ⫾ 0.55 37.86 ⫾ 0.28 32.24 ⫾ 0.22 31.48 ⫾ 0.28 34.19 ⫾ 0.28
Egg
Larva
Pupa
Egg-pupa
the goodness-of-Þt test. Also, in the linear models, the last data value of developmental rate or developmental time at 33⬚C was omitted because it deviated from a straight line. The omission was necessary for the correct calculation of the Tmin and K (DeClerq and Degheele 1992). For the common linear model, the developmental rate of egg, larva, pupa, and overall immature stages was regressed against temperature using linear regression (SPSS 2004). In addition, the Ikemoto and Takai linear model was used for estimating the parameters. Four criteria were used to assess the performance of mathematical models: 2
1. The coefÞcient of determination (R ). Higher values of R2 indicate a better Þt. 2. The residual sum of square (RSS). Lower values of RSS indicate a better Þt. The coefÞcient of determination and residual sum of square were commonly used for model evaluation. However, the R2 value is not appropriate for discriminating between models with different numbers of parameters because models with more parameters al-
ways provide a better Þt. Therefore, we used two other statistics that are parameter independent. 3. The Akaike information criterion (AIC). With this criterion, we sought the model with the lowest AIC, which is the function that minimizes the loss of information (Akaike 1974, Burnham and Anderson 2002, Vucetich et al. 2002, Angilletta 2006). The AIC is calculated using the following equation: AIC ⫽ n ln
冉 冊
SSE ⫹ 2p n
[4]
where n is the number of observations, p is the number of model parameters including the intercept, and SSE is the sum of the squared error. 4. The adjusted coefÞcient of determination (R2adj). As AIC, this criterion is parameter independent. A higher value of R2adj indicates better Þt (Rezaei and Soltani 1998). R2adj was calculated from the following equation: R 2adj ⫽ 1 ⫺
冉 冊
n⫺1 共1 ⫺ R 2兲 n⫺p
[5]
Table 3. Linear regression equations, lower temperature threshold (Tmin), and thermal constant (degree-days) of codling moth immature stages using two linear models Linear model Common
Ikemoto and Takai
Stage
Linear equation
Tmin ⫾ SE (⬚C)
Thermal constant (DD) ⫾ SE
R2
Adjusted R2
P
Egg Larva Pupa Egg-pupa Egg Larva Pupa Egg-pupa
DR ⫽ ⫺0.1339 ⫹ 0.01299 T DR ⫽ ⫺0.0301 ⫹ 0.00328 T DR ⫽ ⫺0.0459 ⫹ 0.00444T DR ⫽ ⫺0.0165 ⫹ 0.00167 T DT ⫽ 79.80 ⫹ 9.97D DT ⫽ 312.60 ⫹ 8.94D DT ⫽ 232.03 ⫹ 10.04D DT ⫽ 615.32 ⫹ 9.63 D
10.31 ⫾ 1.39 9.18 ⫾ 1.92 10.34 ⫾ 1.25 9.89 ⫾ 1.60 9.97 ⫾ 0.78 8.94 ⫾ 0.99 10.04 ⫾ 0.59 9.63 ⫾ 0.81
76.96 ⫾ 7.58 304.91 ⫾ 38.79 225.22 ⫾ 19.65 597.69 ⫾ 65.98 79.80 ⫾ 7.79 312.60 ⫾ 32.10 232.03 ⫾ 17.53 615.32 ⫾ 58.28
0.9717 0.9536 0.9776 0.9647 0.9819 0.9647 0.9897 0.9793
0.9623 0.9382 0.9703 0.9529 0.9758 0.9529 0.9862 0.9724
0.002 0.004 0.001 0.003 0.001 0.002 0.000 0.001
June 2009
RANJBAR AGHDAM ET AL.: TEMPERATURE-DEPENDENT DEVELOPMENT OF CODLING MOTH
889
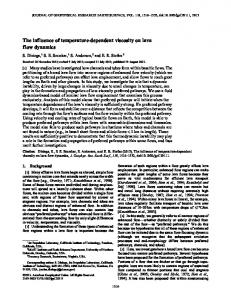
Fig. 1. Fitting 1 linear and 13 nonlinear models to observed values of developmental rates (1/d) of overall immature stages at studied constant temperatures (⬚C). 䡺, observed data.
where n is the number of observations, p is the number of model parameters, and R2 is the coefÞcient of determination. Results Developmental Time No development occurred at 10 or 35⬚C. The developmental time of all immature stages of codling moth at six constant temperatures are presented in Table 2. One-way ANOVA showed a signiÞcant effect of temperature on developmental time for all codling moth life stages (P ⬍ 0.0001). Mean egg developmental time incubation period of codling moth varied from 4.04 d at 30⬚C to 18.67 d at 14⬚C. Egg developmental
time decreased with increasing temperature up to 30⬚C and then increased at 33⬚C. Larval developmental time ranged from 58.34 d at 14⬚C to 15.62 d at 30⬚C. The larval developmental time increased up to 17.22 d at 33⬚C. Pupal developmental time was from 56.29 d at 14⬚C to 11.96 d at 30⬚C and then increased to 12.50 d at 33⬚C. Model Evaluation Linear Models. Both of the linear models showed an acceptable Þt to data for all immature stages. The linear regression equation, the lower temperature threshold (Tmin), and the thermal constant (K) of codling moth immature stages are presented in Table
0.9529 0.9280 0.9617 0.9570 0.9665 0.9630 0.9383 0.9935 0.9508 0.9380 0.9520 0.9718 0.9743 0.9652 ⫺71.01 ⫺69.38 ⫺73.26 ⫺73.17 ⫺73.97 ⫺77.05 ⫺70.73 ⫺85.64 ⫺71.39 ⫺72.89 ⫺73.66 ⫺62.16 ⫺75.17 ⫺60.73 0.16 0.21 0.11 0.08 0.07 0.03 0.12 0.01 0.15 0.06 0.05 0.06 0.08 0.08 0.9647 0.9569 0.9770 0.9828 0.9866 0.9926 0.9754 0.9974 0.9705 0.9876 0.9904 0.9859 0.9846 0.9826 0.9703 0.9662 0.9780 0.9772 0.9766 0.9855 0.9655 0.9975 0.9720 0.9645 0.9670 0.9872 0.9892 0.9840 ⫺62.07 ⫺61.82 ⫺64.41 ⫺64.66 ⫺64.48 ⫺69.83 ⫺62.12 ⫺79.05 ⫺62.98 ⫺64.09 ⫺64.53 ⫺56.15 ⫺69.83 ⫺54.83 0.71 0.74 0.48 0.33 0.34 0.10 0.50 0.03 0.61 0.26 0.24 0.20 0.23 0.26 0.9776 0.9797 0.9868 0.9909 0.9906 0.9971 0.9862 0.9990 0.9832 0.9929 0.9934 0.9936 0.9935 0.9920 0.9382 0.8907 0.9447 0.9357 0.9546 0.9285 0.9211 0.9815 0.9280 0.8955 0.8910 0.9506 0.9583 0.9424 ⫺61.13 ⫺58.67 ⫺62.78 ⫺62.29 ⫺64.48 ⫺63.87 ⫺61.04 ⫺69.81 ⫺61.20 ⫺61.66 ⫺61.19 ⫺52.20 ⫺63.82 ⫺51.46 0.83 1.25 0.63 0.49 0.34 0.27 0.60 0.14 0.82 0.39 0.42 0.44 0.53 0.51 0.9623 0.9645 0.9687 0.9627 0.9620 0.9580 0.9522 0.9872 0.9640 0.9350 0.9520 0.9752 0.9812 0.9738 ⫺47.69 ⫺48.54 ⫺49.30 ⫺48.68 ⫺48.55 ⫺50.10 ⫺47.23 ⫺55.15 ⫺48.42 ⫺47.49 ⫺73.66 ⫺41.96 ⫺52.33 ⫺41.68 7.8 6.77 5.96 4.74 4.84 2.68 6.03 1.61 6.90 4.14 0.05 3.41 3.60 3.61 Number of parameters.
0.9717 0.9787 0.9812 0.9851 0.9848 0.9916 0.9809 0.9949 0.9784 0.9870 0.9904 0.9876 0.9887 0.9869 2 3 3 4 4 5 4 4 3 5 5 4 3 3
R
Linear (common) Logistic or sigmoid Brie` re-1 Brie` re-2 Logan-6 Logan-10 Lactin Third-order polynomial Equation-16 Analytis Hilbert and Logan Lamb (T ⱕ Topt) Taylor Stinner (T ⱕ Topt)
a
R AIC R AIC AIC
R
R2adj
0.9536 0.9344 0.9668 0.9743 0.9818 0.9857 0.9644 0.9926 0.9568 0.9791 0.9782 0.9753 0.9720 0.9712
AIC RSS (⫻10⫺4)
Overall immature stage
2
R2adj Pupa
RSS (⫻10⫺4) 2
R2adj Larva
RSS (⫻10⫺4) 2
Egg
RSS (⫻10⫺4) 2
Phenological models, using developmental time data, have been developed for codling moth to predict emergence of adults from the overwintering generation, eclosion of eggs, larval and pupal development, and generation time (Falcon and Pickel 1976, Falcon et al. 1976, Geier and Briese 1978, Riedl and Croft 1978, Brunner et al. 1982, Rock and Shaffer 1983, Setyobudi 1989, Howell and Neven 2000). These models, all based on a linear relationship between temperature and development rate, have been used with varying degrees of success (Rock and Shaffer 1983) to time pesticide sprays for control of codling moth. The assumption of linear relationship is not true for low- and high-end temperatures (Howell and Neven 2000). Some experiences with phenological models for codling moth have indicated that low and high temperature effects cannot be ignored, and linear phenological models inaccurately simulate development at high temperatures (Howell and Neven 2000). Ours is the only study to examine the effect of temperature on codling moth development using nonlinear developmental models at constant temperatures. The Þndings of Howell and Neven (2000) concerning mean developmental time of the overall immature stages were consistent with the results of our study at similar temperatures. However, based on our results, 30⬚C can be considered as the optimal temperature for development (Table 2). The time required for egg development was short compared with that required
NPARa
Discussion
Model
3. The Ikemoto and Takai linear model had a higher value of R2 and R2adj values than the common linear model (Table 3), indicating a slightly higher degree of conÞdence in parameter estimates provided by the Ikemoto and Takai model. The common model tended to give higher estimates of Tmin and lower estimates of the thermal constant than the Ikemoto and Takai model. Nonlinear Models. Most nonlinear models Þt the data well. The curves of the inßuence of temperature on developmental rate of overall immature stages Þtted by each model are shown in Fig. 1. The values of R2, RSS, AIC, and R2adj used to determine the goodness-of-Þt the models (Table 4) showed that the thirdorder polynomial (Harcourt model) with the highest value for R2 and R2adj and the lowest values for RSS and AIC had the best Þt to data for development of each immature stage and for overall immature development. Furthermore, the sigmoid or logistic model had the poorest Þt to data among nonlinear models. Other models including Brie` re-1, Brie` re-2, Logan-6, Logan10, Hilbert and Logan, equation-16, Taylor, and Lactin also Þt the data acceptably. The values of measurable parameters of the linear and nonlinear developmental rate models are presented in Table 5. Among the nonlinear models, Brie` re-1, third-order polynomial, and Brie` re-2 were used to estimate the lower temperature threshold, the optimal temperature, and the upper temperature threshold, respectively (Tables 6 and 7).
Vol. 38, no. 3 R2adj
ENVIRONMENTAL ENTOMOLOGY Table 4. Comparison of 14 developmental rate models based on the no. of parameters (NPAR), coefficient of determination (R2), residual sum of squares (RSS), Akaike information criterion (AIC), and adjusted R2 (R2adj) for predicting egg, larva, pupa, and overall immature development of codling moth
890
June 2009
RANJBAR AGHDAM ET AL.: TEMPERATURE-DEPENDENT DEVELOPMENT OF CODLING MOTH
891
Table 5. Values of fitted coefficients and measurable parameters of 14 developmental rate models to describe immature stages development of the codling moth Model Linear (common)
Brie` re-1
Brie` re-2
Logan-6
Logan-10
Lactin
Third-order polynomial (Harcourt equation)
Equation-16
Analytis
Lamb (T ⱕ Topt) Sigmoid (logistic) Taylor Hilbert and Logan
Stinner (T ⱕ Topt)
Parameters
Egg
Larva
Pupa
Overall immature stages
A b Tmin K a Tmin Tmax Topt a Tmin Tmax m Topt Tmax ⌬ Topt ␣ Tmax ⌬ K Topt Tm ⌬ y Tmin Tmax Topt a b c d Topt Tmax a Tmin Tmax Topt a Tmin Tmax n m Topt Rm Tm (⫽ Topt) Tơl a b c Rm Tm (⫽ Topt) Tơ ⌿ T0 d TL ⌬ Tmin Topt Tmax a b c
⫺0.1339 0.0130 10.31 76.96 14.53 ⫻ 10⫺5 9.6450 37.6185 31.25 26.34 ⫻ 10⫺5 7.9722 34.4440 4.0547 31.20 0.0613 0.1689 36.6712 5.7836 30.8879 0.4792 0.1866 40.0964 6.2452 105.4232 33.8512 0.0111 39.6357 2.2536 ⫺1.1216 10.37 36.44 31.40 ⫺9.0 ⫻ 10⫺5 59.0 ⫻ 10⫺4 ⫺0.1138 0.7308 30.00 38.93 3.7 ⫻ 10⫺5 7.9376 43.3850 30.60 9.2 ⫻ 10⫺6 0.0048 34.8674 2.8419 0.3555 31.00 0.2524 31.6119 9.4788 5.3482 0.2616 0.2591 0.2468 30.9122 9.0574 0.2125 5.5579 48.8589 35.9055 3.6909 5.88 30.62 36.91 4.7974 ⫺0.2218 0.2901
⫺0.0301 0.0033 9.18 304.91 4.022 ⫻ 10⫺5 8.8676 36.3525 30.70 6.60 ⫻ 10⫺5 6.5188 33.9961 3.9298 30.70 0.0266 0.1657 36.1734 5.9324 30.2410 0.2292 0.1574 38.8673 6.6197 91.5731 32.2476 0.0034 41.0808 2.1360 ⫺1.0336 9.83 35.74 30.56 ⫺3.0 ⫻ 10⫺5 19.6 ⫻ 10⫺4 ⫺0.0385 0.2531 29.76 38.28 1.1 ⫻ 10⫺5 7.5159 41.3481 30.10 9.2 ⫻ 10⫺9 ⫺10.1100 34.5111 4.1114 0.4190 30.40 0.0665 31.2695 9.8052 5.0324 0.2608 0.0657 0.0637 29.6918 8.7660 0.6340 3.2715 69.3089 38.1625 3.0796 3.40 30.02 36.23 4.3220 ⫺0.2039 0.0781
⫺0.0459 0.0044 10.34 225.22 5.10 ⫻ 10⫺5 9.8042 37.2604 31.22 9.00 ⫻ 10⫺5 8.1904 34.3895 3.9046 31.02 0.0359 0.1711 36.5002 5.7683 30.7319 0.1827 0.1818 39.5984 6.4093 105.4656 33.1891 0.0043 40.9746 2.1090 ⫺1.0474 10.65 36.18 31.01 ⫺3.0 ⫻ 10⫺5 20.1 ⫻ 10⫺4 ⫺0.0385 0.2453 30.60 39.61 1.3 ⫻ 10⫺5 8.1076 42.7492 31.20 2.6 ⫻ 10⫺6 0.0099 34.8576 2.8903 0.3762 30.87 0.0858 31.4477 9.3858 5.3938 0.2660 0.0873 0.0836 30.6414 8.8934 1.7924 4.4538 99.1662 41.3152 3.7130 4.10 30.62 37.14 4.7934 ⫺0.2221 0.0988
⫺0.0165 0.0017 9.89 597.69 2.00 ⫻ 10⫺5 9.6188 36.5508 30.40 3.40 ⫻ 10⫺5 7.7659 34.1260 3.8342 30.70 0.0118 0.1704 36.1906 5.7743 30.4162 0.0845 0.1734 38.7735 6.4024 102.2182 32.3711 0.0018 43.0451 2.2827 ⫺1.0198 10.78 31.02 35.93 ⫺1.4 ⫻ 10⫺5 9.2 ⫻ 10⫺4 ⫺0.0179 0.1161 29.84 38.43 0.57 ⫻ 10⫺5 8.1093 41.5254 30.40 7.3 ⫻ 10⫺9 ⫺6.9336 35.0121 4.0276 0.4941 30.35 0.3256 31.0727 9.3293 5.4117 0.2736 0.0326 0.0316 29.9478 8.5990 0.2125 5.5579 48.8589 35.9055 3.6909 5.88 30.62 36.91 4.6808 ⫺0.2193 0.0379
for larval and pupal development. Its consistently narrow range of developmental time makes the egg an excellent stage to use for phenological models (Brunner et al. 1982, Howell and Neven 2000).
The lower temperature threshold for codling moth has been reported to be as low as 8.0⬚C or as high as 11.1⬚C (Falcon and Pickel 1976, Falcon et al. 1976). Based on our study, lower temperature threshold for
892
ENVIRONMENTAL ENTOMOLOGY
Vol. 38, no. 3
Table 6. Estimating temperature thresholds and optimal temperature of codling moth using common linear and some nonlinear developmental rate models Model
Immature life stages
Linear (Ikemoto and Takai)
Egg Larva Pupa Overall immature stages Egg Larva Pupa Overall immature stages Egg Larva Pupa Overall immature stages Egg Larva Pupa Overall immature stages Egg Larva Pupa Overall immature stages Egg Larva Pupa Overall immature stages Egg Larva Pupa Overall immature stages Egg Larva Pupa Overall immature stages Egg Larva Pupa Overall immature stages Egg Larva Pupa Overall immature stages Egg Larva Pupa Overall immature stages Egg Larva Pupa Overall immature stages
Linear (common)
Brie` re-1
Brie` re-2
Logan-6
Logan-10
Third-order polynomial (Harcourt equation) Equation-16
Analytis
Hilbert and Logan
Lamb (T ⱕ Topt)1
Taylor
Tmin (⬚C) 9.97 8.94 10.04 9.63 10.31 9.18 10.34 9.89 9.64 8.87 9.80 9.62 7.97 6.52 8.19 7.76 a a a a a a a a a a a a
7.94 7.52 8.11 8.11 0.00 ⫺10.11 0.01 ⫺6.94 5.88 3.40 4.10 5.88 a a a a a a a a
Topt (⬚C)
Tmax (⬚C)
a
a
a
a
a
a
a
a
a
a
a
a
a
a
a
a
31.25 30.70 31.22 30.40 31.20 30.70 31.02 30.70 30.89 30.24 30.73 30.42 33.85 32.25 33.19 32.37 30.00 29.76 30.60 29.84 31.60 30.10 31.20 30.40 31.00 30.40 30.87 30.35 30.62 30.02 30.62 30.62 31.61 31.27 31.45 31.07 30.91 29.69 30.64 29.95
37.62 36.35 37.26 36.55 34.44 34.00 34.39 34.13 36.67 36.17 36.50 36.19 40.10 38.87 39.60 38.77 38.93 38.28 39.61 38.43 43.38 41.35 42.75 41.52 34.87 34.51 34.86 35.01 36.91 36.23 37.14 36.91 a
Acc Tmin
Topt
Tmax
⫹ ⫹ ⫹ ⫹ ⫹ ⫹ ⫹ ⫹ ⫹ ⫹ ⫹ ⫹ ⫺ ⫺ ⫹ ⫺
a
a
a
a
a
a
a
a
a
a
a
a
a
a
a a a a a a a a a a a a
⫺ ⫺ ⫹ ⫹ ⫺ ⫺ ⫺ ⫺ ⫺ ⫺ ⫺ ⫺ a
a
a
a
a
a
a
a
a
a
a
a
a
a
a
a
a
⫺ ⫹ ⫺ ⫹ ⫺ ⫹ ⫺ ⫹ ⫹ ⫹ ⫹ ⫹ ⫺ ⫺ ⫺ ⫺ ⫹ ⫹ ⫹ ⫹ ⫺ ⫹ ⫺ ⫹ ⫹ ⫹ ⫹ ⫹ ⫹ ⫹ ⫹ ⫹ ⫺ ⫺ ⫺ ⫺ ⫹ ⫹ ⫹ ⫹
⫺ ⫺ ⫺ ⫺ ⫹ ⫹ ⫹ ⫹ ⫺ ⫺ ⫺ ⫺ ⫺ ⫺ ⫺ ⫺ ⫺ ⫺ ⫺ ⫺ ⫺ ⫺ ⫺ ⫺ ⫹ ⫹ ⫹ ⫹ ⫺ ⫺ ⫺ ⫺ a a a a a a a a
a
Not estimated. Acc, accuracy of the estimated values of the thresholds; ⫹, yes; ⫺, no.
different immature stages of codling moth was between 8.94 and 10.34⬚C using the common and Ikemoto and Takai linear models, respectively (Table 3) and between 8.87 and 9.80⬚C using the selected non-
linear models tested (Table 7). In most cited references, the lower temperature threshold of codling moth is considered as 10⬚C using the common linear developmental rate model (Glenn 1922, Riedl et al.
Table 7. Estimated optimal temperature, temperature thresholds, and applied models to estimate these parameters for different immature stages of codling moth Life stage Egg Larva Pupa Overall immature stages a
Tmin ⫾ SE (⬚C) model 9.6450 ⫾ 1.8192 8.8676 ⫾ 2.2887 9.8042 ⫾ 1.4538 9.6188 ⫾ 1.8277
Brie` re-1 Brie` re-1 Brie` re-1 Brie` re-1
Topt (⬚C) modela 30.00 29.76 30.60 29.84
Polynomial third order Polynomial third order Polynomial third order Polynomial third order
SE could not be estimated because Topt in this model was calculated using the graphical method.
Tmax ⫾ SE (⬚C) model 34.4440 ⴞ 2.9980 33.9961 ⴞ 2.2439 34.3895 ⴞ 2.1139 34.1260 ⴞ 2.1198
Brie` re-2 Brie` re-2 Brie` re-2 Brie` re-2
June 2009
RANJBAR AGHDAM ET AL.: TEMPERATURE-DEPENDENT DEVELOPMENT OF CODLING MOTH
1976, Rock and Shaffer 1983, Setyobudi 1989, Pitcarin et al. 1992, Howell and Neven 2000). Howell and Neven (2000) showed the possibility of deriving three Tmin, 6.9, 9.3, and 10.3⬚C, for codling moth larvae, depending on the number of points deviating from linearity that are used in calculation. Rock and Shafer (1983) used Þve temperatures to calculate the lower temperature threshold (9.9⬚C) even though the data were signiÞcantly nonlinear. These results support our Þndings on the lower temperature threshold using linear and nonlinear models. Howell and Neven (2000) reported the time required to complete physiological development of codling moth eggs (⫽thermal constant) to be 87.5 DD with 10⬚C as Tmin, a value 12.5 DD lower than that found by Cranham (1980). We estimated the thermal constant of codling moth eggs to be 10.54 and 7.70 DD lower than Howell and Neven (2000) using the common and Ikemoto and Takai linear models, respectively. Based on these Þndings, consistency of codling moth developmental time in different locations is rejected. In addition, thermal constant values for larval and pupal development from our study are consistent with those of Pickel et al. (1986) and Setyobudi (1989), who reported the thermal constant of codling moth pupae to be 222.2 DD. The commonly used forecasting models are based on linear regression between developmental rate and temperature, but the x-intercept does not conÞdently identify the lower temperature threshold (VanKirk and Aliniazee 1981, Hawthorne et al. 1988). If the lower temperature threshold is inaccurate, it can introduce signiÞcant error into the growth rate equation (Howell and Neven 2000). Therefore, the lower temperature threshold is a critical factor in determining the physiological developmental time of the codling moth in orchards. In our study, the sigmoid model provided the poorest Þt to the developmental data and is only marginally suitable, compared with the other nonlinear models tested, for use in a codling moth developmental model. The third-order model provided the best Þt to data. However, between these two are several models with the capacity to accurately estimate important developmental parameters. Furthermore, although the third-order polynomial had the best Þt to data between 14 and 33⬚C, this model cannot provide a real thermal performance curve for development at lower temperatures (⬍14⬚C) and also fails to estimate the lower temperature threshold: it was necessary to use another suitable model, the Brie` re-1, for this purpose. Similarly, we used the Brie` re-2 to provide a thermal performance curve at higher temperatures (⬎33⬚C) and to estimate the upper temperature threshold. Estimates of Tmax using the Brie` re-1, Logan-6, Logan-10, Hilbert and Logan, Lactin, third-order polynomial equations, and equation-16 were higher than the observed values (overestimation). Only Brie` re-2 and Analytis accurately estimated Tmax. We therefore selected the Brie` re-2 as the best model, not only to estimate the upper temperature threshold but also to provide a thermal performance curve at temperatures
893
⬎33⬚C. No other study has examined this parameter using nonlinear models. Pitcarin et al. (1992) reported the upper temperature threshold for the larval stage of codling moth to be 31.1⬚C. Our Þndings reject this Þnding. This work described the temperature-dependent development of codling moth, C. pomonella, populations in Maragheh, northwest of Iran, under the broad range of temperatures generally prevailing in this region and estimated their key bioclimatic parameters. These results can be used to forecast accurately the occurrence of different stages of codling moth in apple orchards and enable us to choose the best time for controlling this pest with greater precision.
References Cited Akaike, H. 1974. A new look at the statistical model identiÞcation. IEEE Trans. Autom. Control AC 19: 716 Ð723. Analytis, S. 1977. U¨ ber die relation zwischen biologischer entwicklung und temperature bei phytopathogenen Pilzen. Phytopath. Z. 90: 64 Ð76. Analytis, S. 1979. Study on relationships between temperature and developmental times in phytopathogenic fungus: a mathematical model. Agric. Res. (Athens) 3: 5Ð30. Analytis, S. 1980. Obtaining of sub-models for modeling the entire life cycle of a pathogen. Z. Pßanzenker Pßanzenschutz 87: 371Ð382. Analytis, S. 1981. Relationship between temperature and development times in phytopathogenic fungus and plant pests: a mathematical model. Agric. Res. (Athens) 5: 133Ð 159. Angilletta, M. J. 2006. Estimating and comparing thermal performance curves. J. Therm. Biol. 31: 541Ð545. Arbab, A., D. C. Kontodimas, and A. Sahragard. 2006. Estimating development of Aphis pomi (DeGeer) (Homoptera: Aphididae) using linear and non-linear models. Environ. Entomol. 5: 1208 Ð1215. Bathon, H. 1981. Zur zucht des apfelwicklers, Laspeyresia pomonella (Lepidoptera: Tortricidae), auf einem ku¨ nstlichen na¨hrmedium. Mitt. Dtsch. Ges. Allg. Angew. Ent. 2: 136 Ð140. Behdad, E. 1991. Pests of fruit crops in Iran. Agriculture Research Center, Esfahan, Iran. Brie`re, J. F., P. Pracros, J. Stockel, and P. Blaise. 1998. Modeling development rate for predicting Lobesia botrana (Den. and Schiff.) population dynamics. Bull. OILB/ IOBC 21: 51Ð52. Brie`re, J. F., P. Pracros, A. Y. le Roux, and J. S. Pierre. 1999. A novel rate model of temperature-dependent development for arthropods. Environ. Entomol. 28: 22Ð29. Brunner, J. F., S. C. Hoyt, and M. A. Wright. 1982. Codling moth control-a new tool for timing sprays. Wash. State Univ. Coop. Ext. Bull. 1072. Burnham, K. P., and D. R. Anderson. 2002. Model selection and multimodel inference: a practical information-theoretic approach. Springer, New York. Campbell, A., B. D. Frazer, N. Gilbert, A. P. Gutierrez, and M. Makauer. 1974. Temperature requirements of some aphids and their parasites. J. Appl. Ecol. 11: 431Ð 438. Cossins, A. R., and K. Bowler. 1987. Temperature biology of animals. Chapman & Hall, London, United Kingdom. Cranham, J. E. 1980. Timing the Þrst spray against codling moth: the relation between trap catches and temperatures, and its practical application. Proceedings of IOBC/ WPRS, Wye College, Ashford, United Kingdom.
894
ENVIRONMENTAL ENTOMOLOGY
Curry, G. L., R. M. Feldman, and P.J.H. Sharp. 1978. Foundation on stochastic development. J. Theor. Biol. 74: 397Ð 410. Dastqeib, N., and H. Seyedoleslamy. 1988. Forecasting codling moth, Laspeyresia pomonella L., phenology in west Esfahan apple orchards based on effective temperature calculation. Appl. Entomol. Phytopathol. 54: 25Ð 43. Davidson, J. 1942. On the speed of development of insect eggs at constant temperatures. Aust. J. Exp. Biol. Med. Sci. 20: 233Ð239. Davidson, J. 1944. On the relationship between temperature and the rate of development of insects at constant temperatures. J. Anim. Ecol. 13: 26 Ð38. DeClerq, P., and D. Degheele. 1992. Development and survival of Podisus maculiventris (Say) and Podisus sagitta (Fab.) (Het.: Pentatomidae) at various constant temperatures. Can. Entomol. 124: 125Ð133. Dorn, S., P. Schumacher, C. Abivardi, and R. Myho¨ fer. 1999. Global and regional pest insects and their antagonists in orchards: spatial dynamics. Agric. Ecosyst. Environ. 73: 111Ð118. Falcon, L. A., and C. Pickel. 1976. Manual for 1976 Þeld validation of bug off codling moth forecasting program. University of California, Berkeley, CA. Falcon, L. A., C. Pickel, and J. B. White. 1976. Computerizing codling moth. Fruit Grower 96: 8 Ð14. Frazer, B. D., and R. R. McGregor. 1992. Temperature-dependent survival and hatching rate of eggs of seven species of Coccinellidae. Can. Entomol. 124: 305Ð312. Geier, P. W., and D. T. Briese. 1978. The demographic performance of a laboratory strain of codling moth, Cydia pomonella (Lepidoptera: Tortricidae). J. Appl. Ecol. 15: 679 Ð 696. Glenn, P. A. 1922. Relation of temperature to development of codling moth. J. Econ. Entomol. 15: 193Ð198. Golizadeh, A., K. Kamali, Y. Fathipour, and H. Abbasipour. 2007. Temperature- dependent development of diamondback moth, Plutella xylostella (Lepidoptera: Plutellidae) on two brassicaceous host plants. Insect Sci. 14: 309 Ð316. Haghani, M., Y. Fathipour, A. A. Talebi, and V. Baniameri. 2007. Thermal requirement and development of Liriomysa sativae (Diptera: Agromyzidae) on cucumber. J. Econ. Entomol. 100: 350 Ð356. Haghani, M., Y. Fathipour, A. A. Talebi, and V. Baniameri. 2006. Temperature- dependent development of Diglyphus isaea (Diptera: Agromyzidae) on cucumber. J. Pest Sci. 80: 71Ð77. Harcourt, D. C., and J. M. Yee. 1982. Polynomial algorithm for predicting the duration of insect life stages. Environ. Entomol. 11: 581Ð584. Hawthorne, C. J., G. C. Rock, and R. E. Stinner. 1988. Redbanded leafroller (Lepidoptera: Tortricidae): thermal requirement for development and simulation of within season phenology in North California. Environ. Entomol. 17: 40 Ð 46. Hilbert, D. W., and J. A. Logan. 1983. Empirical model of nymphal development for the migratory grasshopper, Melanoplus sanguinipes (Orthoptera: Acrididae). Environ. Entomol. 12: 1Ð5.Ô Hone˘k, A. 1999. Constraints on thermal requirement for insect development. Entomol. Sci. 2: 615Ð 621. Howell, J. F., and L. G. Neven. 2000. Physiological development time and zero development temperature of the codling moth (Lepidoptera: Tortricidae). Environ. Entomol. 29: 766 Ð772. Huffaker, C., A. Berryman, and P. Turchin. 1999. Dynamics and regulation of insect populations, pp. 269 Ð305. In C. B.
Vol. 38, no. 3
Huffaker and A. P. Gutierrez (eds.), Ecological entomology, 2nd ed. Wiley, New York. Ikemoto, T., and K. Takai. 2000. A new linearized formula for the law of total effective temperature and the evaluation of line-Þtting methods with both variables subject to error. Environ. Entomol. 19: 671Ð 682. Jarosˇik, V., A. Hone˘k, and A.F.G. Dixon. 2002. Developmental rate isomorphy in insects and mites. Am. Nat. 160: 497Ð510. Kheradmand, K., K. Kamali, Y. Fathipour, E. M. Goltapeh, and M. Camerik. 2006. Biology and life table parameters of the mushroom pest, Pediculaster flechmanii (Acari: Siteroptidae), at three constant temperatures. Insect Sci. 13: 375Ð380. Kontodimas, D. C., P. A. Eliopoulos, G. J. Stathas, and L. P. Economou. 2004. Comparative temperature- dependent development of Nephus includens (Kirsch) and Nephus bisignatus (Boheman) (Coleoptera: Coccinellidae) preying on Planococcus citri (Risso) (Homoptera: Pseudococcidae): evaluation of a linear and various nonlinear models using speciÞc criteria. Environ. Entomol. 33: 1Ð11. Ku¨ rt, U., J. Samietz, H. Ho¨ hn, and S. Dorn. 2006. Modelling the phenology of codling moth: inßuence of habitat and thermoregulation. Agric. Ecosyst. Environ. 117: 29 Ð38. Lactin, D. J., N. J. Holliday, D. L. Johnson, and R. Craigen. 1995. Improved rate model of temperature-dependent development by arthropods. Environ. Entomol. 24: 68 Ð75. Lamb, R. J. 1992. Development rate of Acyrthosiphon pisum (Homoptera: Aphididae) at low temperatures: implications for estimating rate parameters for insects. Environ. Entomol. 21: 10 Ð19. Lamb, R. J., G. H. Gerber, and G. F. Atkinson. 1984. Comparison of developmental rate curves applied to egg hatching data of Entomoscelis Americana Brown (Col.: Chrysomelidae). Environ. Entomol. 13: 868 Ð 872. Logan, J. A. 1988. Toward an expert system for development of pest simulation models. Environ. Entomol. 17: 359 Ð376. Logan, J. A., D. J. Wollkind, S. C. Hoyt, and L. K. Tanigoshi. 1976. An analytic model for description of temperature dependent rate phenomena in arthropods. Environ. Entomol. 5: 1133Ð1140. MINITAB. 2000. MINITAB userÕs guide, version 13.20. MINITAB, Coventry, United Kingdom. Pickel, C. P., R. S. Bethell, and W. W. Coates. 1986. Codling moth management using degree days. University of California Statewide IPM Project, Berkeley, CA. Pitcarin, M. J., F. G. Zalom, and R. E. Rice. 1992. Degreeday forecasting of generation time of Cydia pomonella (Lepidoptera: Tortricidae) population in California. Environ. Entomol. 21: 441Ð 446. Radjabi, Gh. 1986. Insects attacking rosaceous fruit trees in Iran, vol. 2: Lepidoptera. Plant Pest and Disease Research Institute, Tehran, Iran. Rezaei, A., and A. Soltani. 1998. An introduction to applied regression analysis. Isfahan, University of Technology, Isfahan, Iran. Rezapanah, M. 2001. Biological and biochemical variation of Iranian isolates of Cydia pomonella granulovirus. PhD dissertation, Tarbiat Modares University, Tehran, Iran. Riedl, H., and B. A. Croft. 1978. The effects of photoperiod and effective temperatures on the seasonal phenology of the codling moth (Lepidoptera: Tortricidae). Can. Entomol. 110: 445Ð 470. Riedl, H., B. A. Croft, and A. J. Howitt. 1976. Forecasting codling moth phenology based on pheromone trap catches and physiological time models. Can. Entomol. 108: 449 Ð 460.
June 2009
RANJBAR AGHDAM ET AL.: TEMPERATURE-DEPENDENT DEVELOPMENT OF CODLING MOTH
Rock, G. C., and P. L. Shaffer. 1983. Development rates of codling moth (Lepidoptera: Olethreutidae) reared on apple at four constant temperatures. Environ. Entomol. 12: 831Ð 834. Roy, M., J. Brodeur, and C. Cloutier. 2002. Relationship between temperature and developmental rate of Stethorus punctillum (Coleoptera: Coccinellidae) and its prey Tetranychus mcdanieli (Acarina: Tetranychidae). Environ. Entomol. 31: 177Ð187. SAS Institute. 1989. JMP, a guide to statistical and data analysis, version 4.02. SAS Institute, Cary, NC. Setyobudi, L. 1989. Seasonality of codling moth, Cydia pomonella (Lepidoptera: Olethreutidae), in the Willamette valley of Oregon: role of photoperiod and temperature. PhD dissertation, Oregon State University, Corvallis, OR. SPSS. 2004. SPSS base 13.0 userÕs guide. SPSS, Chicago, IL. Stinner, R. E., A. P. Gutierez, and G. D. Butler. 1974. An algorithm for temperature-dependent growth rate simulation. Can. Entomol. 106: 519 Ð524. Taylor, F. 1981. Ecology and evolution of physiological time in insects. Am. Nat. 117: 1Ð23. Taylor, F. 1982. Sensitivity of physiological time in arthropods to variation of its parameters. Environ. Entomol. 11: 573Ð577.
895
Tsai, J. H., and Y. H. Liu. 1998. Effect of temperature on development, survivorship, and reproduction of rice root aphid (Homoptera: Aphididae). Environ. Entomol. 27: 662Ð 666. VanKirk, J. R., and M. T. Aliniazee. 1981. Determining low temperature threshold for pupal development of the western cherry fruit ßy for use in phenology models. Environ. Entomol. 10: 968 Ð971. Vucetich, J. A., R. O. Peterson, and C. L. Schaefer. 2002. The effect of prey and predator densities on wolf predation. Ecology 83: 3003Ð3013. Wagner, T. L., H. I. Wu, P.J.H. Sharpe, R. M. Schoolfield, and R. N. Coulson. 1984. Modeling insect development rates: a literature review and application of a biophysical model. Ann. Entomol. Soc. Am. 77: 208 Ð 225. Zamani, A. A., A. A. Talebi, Y. Fathipour, and V. Baniameri. 2006. Effect of temperature on biology and population growth parameters of Aphis gossypii Glover (Hom., Aphididae) on greenhouse cucumber. J. Appl. Entomol. 130: 453Ð 460. Received 6 January 2008; accepted 9 March 2009.