Jordan Journal of Civil Engineering, Volume 6, No. 1, 2012
Temperature Effect on Frictional Properties of HMA at Different Polishing Stages Mohammad Ali Khasawneh 1) and Robert Y. Liang 2) 1)
Assistant Professor, 525 S. Main Street, Department of Civil Engineering, Ohio Northern University, Ada, OH 45810, USA. Email:
[email protected] 2) Professor of Civil Engineering, The University of Akron, Akron, OH 44325-3905, USA. Email:
[email protected]
ABSTRACT Both short-term and long-term variations have been observed in measured friction on pavement surface. These variations have been attributed to different factors, such as traffic, rainfall and temperature. Due to the fact that Hot Mix Asphalt (HMA) pavement surface and rubber tires are viscoelastic materials, it is believed that temperature may affect the measured frictional properties. Some researchers have found this effect to be significant; whereas, others have not. Therefore, the effect of temperature on the measured pavement friction remains to be further studied. This paper provides the results of a laboratory study aimed at evaluating the effect of temperature on the measured frictional properties of the HMA surface. The British Pendulum Tester (BPT) was used to measure friction of HMA surfaces at different polishing stages and different temperatures. Statistical analyses were performed to quantify the effect of temperature on the measured friction numbers. The main conclusion of this paper is that temperature is statistically significant in affecting the measured friction values. However, for agencies who desire to record skid number (SN) at a reference temperature for a long-term monitoring purpose, this paper provides a method for converting SN at a given temperature to the SN at the reference temperature. KEYWORDS: Temperature, Polishing, Friction, Texture, Statistical analysis, ANOVA.
move fast on the wet pavement surface, there is usually insufficient time to channel the water away from the center of the tire. As a consequence, the tire is lifted away from the road surface and all the traction is lost. This phenomenon is referred to as the hydroplaning. Skid resistance and texture are important properties of pavement surface for safeguarding against onset of hydroplaning. Therefore, it is important to regularly monitor and measure the skid resistance and texture of existing pavement surfaces. Pavement skid resistance is defined as the ability of a traveled pavement surface to prevent the loss of traction. Theoretically, the friction
INTRODUCTION Asphalt concrete pavements, over passage of time and under traffic, gradually lose their skid resistance, creating a serious safety concern, especially when pavements are wet. According to the Maryland State Highway Administration (MDSHA) Traffic and Safety Analysis Division reports, approximately 18% of fatal accidents and 24.3% of all accidents occur when pavements are wet (Chelliah, 2003). When vehicle tires Accepted for Publication on 2/10/2011.
- 39 -
© 2012 JUST. All Rights Reserved.
Temperature Effect on…
Mohammad Ali Khasawneh and Robert Y. Liang
that develops between a rubber tire and a traveled pavement surface consists of two components; namely, adhesion and hysteresis (Kummer, 1966). Adhesion is the shear force between tire and traveled pavement surface generated when the tire rubber slides over the asperities (microtexture) of pavement surface as well as the penetration of aggregate particles into the rubber tire. Furthermore, adhesion is the molecular bonds generated when the tire rubber deforms. The hysteresis is developed when the tire rubber deforms due to the irregularities of the pavement surface (macrotexture). Therefore, the main texture parameters that influence pavement surface friction are both microtexture and macrotexture (Janoo and Korhonen, 1999). The long-term variations in skid resistance are primarily assumed to be due to variations of pavement aggregate properties together with influence of traffic density; whereas, the short-term (seasonal) variations in skid resistance are more or less assumed to be the results of rainfall and temperature effects. Although a number of studies have been conducted in the past to investigate the magnitude and causes of seasonal variations in skid resistance, there has been no consensus understanding and quantification of the mechanisms and relevant factors contributing to seasonal variation of skid resistance. In particular, the effect of temperature on pavement surface skid resistance, as will be reviewed in the following section, remains to be one of critical factors that need more study and clarification. Most studies agree that effects of temperature on the measured pavement skid resistance can be broken down into four components: air temperature, water temperature, tire temperature and pavement temperature. Since it is unlikely to have independent control of all four temperature effects in field skid resistance measurement, the past research efforts have been rather ad hoc and inconsistent in terms of being able to isolate all temperature effects of each component. To effectively isolate the temperature effects due to each component, it is best to conduct laboratory tests, where temperature may be controlled.
- 40 -
This paper presents the results of a laboratory study of temperature effects on the measured friction. Not only the temperature effect is qualitatively assessed, but also a temperature correction factor is suggested to adjust field measured skid resistance at different temperatures. BACKGROUND The long-term variations in skid resistance are primarily attributed to the loss of friction properties of pavement aggregate due to sustained vehicle tire induced wearing and polishing. On the other hand, the short-term (seasonal) variations are a result of rainfall and temperature effects and errors in skid number measurements. The largest source of these is usually attributed to variation of the lateral placement of the test tire. Due to the fact that Hot Mix Asphalt (HMA) pavement surface and tire rubber are viscoelastic materials and therefore temperature-dependent, it is believed that temperature can affect HMA surface properties. For example, some researchers (Runkle and Mahone, 1980; Burchett and Rizenbergs, 1980; Bazlamit and Reza, 2005) have found that an increase in temperature has resulted in a corresponding decrease in skid resistance; whereas, others (e.g., Mitchell et al., 1986) have not noticed significant temperature effects on measured skid resistance. In the present time, there is no consensus opinion regarding the effect of temperature on the measured pavement friction values. In the United States, the most common method of measuring skid resistance is by means of Locked Wheel Skid Trailer (LWST). The standard test procedure for the LWST is described in detail in the ASTM E 274 specification. The test begins with the attainment of the desired test speed, usually at 64 km/h (40 mph). An activator, located inside the truck, is used to initiate the test sequence beginning with the application of a thin layer of water to the pavement surface. After the correct amount of water has been applied, the test wheel is locked and instrumentation in the trailer records the sliding force of the locked tire. This measured force is used to compute the skid number (SN).
Jordan Journal of Civil Engineering, Volume 6, No. 1, 2012
The British Pendulum Tester (BPT), ASTM E 303, is one of the most commonly used laboratory test methods for the determination of low-speed microtexture-related skid resistance (British Pendulum Number, BPN) of pavement surface materials. However, BPN and SN do not correspond exactly, even though some approximate correlations have been observed by Kissoff (1988). Wang and Flintsch (2007) studied the surface friction and texture properties of 12 asphalt pavement sections placed at the Virginia Smart Road pavement facility over a 6-year time period. Both short-term (seasonal) and long-term (multi-year) variations of the surface characteristics were investigated in terms of temperature and time effects. Their investigation confirmed that the environmental factors have exerted a significant effect on the seasonal and multi-year variations of pavement surface friction. Flintsch et al. (2005) and Luo (2003) studied the effect of pavement temperature on frictional properties of HMA pavement surfaces at the Virginia Smart Road. A total of seven HMA surfaces were periodically evaluated using an ASTM skid trailer with both ribbed and smooth tires over two and half years. Their analysis showed that pavement temperature has a significant effect on pavement frictional measurements. Elkin et al. (1980) conducted a study on the shortterm (seasonal) variations of skid resistance of bituminous surfaces in Indiana. Fifteen individual bituminous sections were tested by means of a skidresistance measuring system in accordance with ASTM E 274. Pavement temperatures were measured during each test using an infrared heat sensor mounted in the floor of the tow vehicle’s cab and centered over the left wheel path. There was a noticeable loss of skid resistance as pavement surface temperature increases beyond 90o F and especially above 100o F. Dahir et al. (1979) conducted a study at the Pennsylvania State University to investigate the shortterm (seasonal) variations of skid resistance. In this study, skid resistance measurements according to ASTM E 274 were made on dry pavements. In addition,
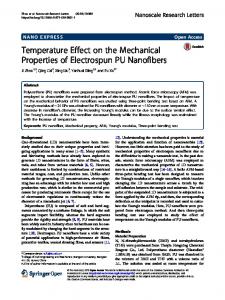
tire and pavement temperatures were continuously monitored by using radiometers mounted on the tester. Ambient and water temperatures were measured using appropriate thermometers. The study indicated a temperature variation of pavement surface about 22o C (40o F). The air and tire temperatures varied by 11o C (20o F). It was concluded that temperature variations of the magnitude experienced in the study do not seem to significantly affect the skid resistance measurements. The short-term (seasonal) skid resistance variations were investigated by Hill and Henry (1978). Twenty one test surfaces in State College, Pennsylvania, were selected for testing. The testing program included daily skid measurements according to ASTM E 274 and the collection of daily weather data. Pavement temperature was chosen as the temperature parameter. It was found that an increase in pavement temperature of 10o C can result in a decrease in SN at 64 km/hr (40 mph) of about 1.2 skid number. This decrease is outweighed by measurement error, particularly lateral placement of the test tire, which accounts for as much as ± 4 skid number at a speed of 64 km/hr (40 mph). Based on the above literature review, it can be seen that not only the temperature effect remains unresolved, but also there is a lack of complete test protocol for evaluating temperature effects on measured HMA frictional properties. This paper provides the laboratory investigation results in terms of the effects of temperature of HMA, tire and water on the measured friction properties expressed in terms of BPN. The gyratory compacted HMA specimens were subjected to laboratory accelerated polishing action to create different texture and friction properties on the HMA surface, from which BPT was used to measure the corresponding BPN at the controlled temperatures. LABORATORY TEST PROGRAM The aggregate used was Columbus limestone brought from Akron Crushed Limestone Company in Akron, Ohio. The gradation curve of the aggregate in mixing HMA is shown in Figure 1. The binder used was
- 41 -
Temperature Effect on…
Mohammad Ali Khasawneh and Robert Y. Liang
PG 64-22 and brought from Marathon Petroleum Company, LLC in Cleveland, Ohio. An optimum binder content of 6.1% was used based on Superpave Specifications adopted by Ohio Department of Transportation. The preparation of Superpave gyratory compacted HMA specimens follows typical procedure.
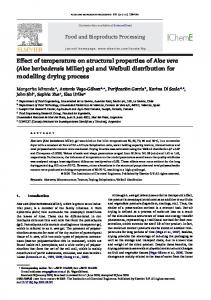
The measurement of BPN follows the procedures outlined in ASTM E 303-93. Figure 2 shows the BPT setup for friction measurement. Five measurements were made for each specimen, from which an average of the last four readings was recorded as the BPN.
Plot of percent finer vs. grain size 120
Percent finer
100 80 60 40 20 0 0.001
0.01
0.1
1
Grain size (in)
Figure 1: Gradation curve
Figure 2: Friction measurement setup using the BPT To produce different friction and texture properties on the surface of gyratory compacted HMA specimens, a laboratory-scale accelerated polishing machine was used. A detailed description of the accelerated polishing machine is given in Khasawneh and Liang (2010). In essence, the accelerated polishing machine uses the
- 42 -
rubber pad to brush against the HMA specimen surface at constant rotational speed and constant normal pressure. Different surface texture and friction properties can be produced by polishing the original HMA specimens to different durations of polishing. A picture showing the accelerated polishing machine is
Jordan Journal of Civil Engineering, Volume 6, No. 1, 2012
presented in Figure 3. Also, a time history of the friction measurement and texture measurement of a typical HMA specimen is shown in Figure 4(a) and Figure 4(b),
respectively. As can be seen, the accelerated machine is capable of producing HMA surface with different friction and texture properties.
(a) General view of the accelerated polishing machine
(b) Close-up of the rubber shoe-specimen interface Figure 3: Accelerated polishing machine using rubber shoes for testing HMA specimens
- 43 -
Temperature Effect on…
Mohammad Ali Khasawneh and Robert Y. Liang
BPN vs. Time 85
BPN
75
65
55
45 0
100
200
300
400
500
Time (min.)
(a) Time history of the friction measurement of a typical HMA specimen MTD vs.Time
MTD (cm)
0.16
0.14
0.12
0.1 0
100
200
300
400
500
Polishing Time (min.)
(b) Time history of the texture measurement of a typical HMA specimen Figure 4: Time history of the friction and texture measurement of a typical HMA specimen LABORATORY TEST RESULTS AND DATA ANALYSIS Test Program The flow chart of the test program geared toward studying the individual temperature effects is shown in Figure 5. Each temperature condition is tested in triplicate to ensure data repeatability. Test Results The test results obtained from the laboratory work
- 44 -
can be divided into two sets. These include BPNs at three different temperatures: 40, 75 and 140o F, and at three stages of polishing: 0 minutes (initial unpolished stage), 240 minutes (partially polished stage) and 480 minutes (completely polished stage). The first set of data relates to the tests when HMA and water temperatures are controlled. The second set of data relates to the test results when HMA, rubber slider and water temperatures are controlled.
Jordan Journal of Civil Engineering, Volume 6, No. 1, 2012
Preparation of 6” Gyratory Compacted Specimens Initial BPN Measurements @
75oF
40oF
140oF
Polishing for 240 Minutes Using Asphalt Polisher BPN Measurements @
75oF
40oF
140oF
Polishing for Additional 240 Minutes Using Asphalt Polisher
BPN Measurements @
40oF
75oF
140oF
Figure 5: Flowchart depicting the experimental program conducted to investigate the air void effect
temperature, the average from 12 readings (i.e., 3 specimens x 4 repeated readings) is plotted. It can be seen that the friction (BPN) decreases with increasing temperature. This temperature effect may be attributed to changes in the stiffness properties of the asphalt as
Analysis of Test Results The variation of friction with temperature in the unpolished, partially polished and completely polished conditions is plotted in Figure 6, in which only HMA and water temperatures are controlled. At each
- 45 -
Temperature Effect on…
Mohammad Ali Khasawneh and Robert Y. Liang
BPN vs. Temperature at the unpolished Stage 75
73
BPN
71
69
67
65 0
20
40
60
80
100
120
140
160
Temperature (F)
BPN vs. Temperature at the Partially Polished Stage 60
58
BPN
56
54
52
50 0
20
40
60
80
100
120
140
160
Temperature (F)
BPN vs. Temperature at the Completely Polished Stage 55
53
BPN
51
49
47
45 0
20
40
60
80
100
120
140
160
Temperature (F)
Figure 6: BPN versus temperature at different polishing stages-pavement and water temperatures are controlled
- 46 -
Jordan Journal of Civil Engineering, Volume 6, No. 1, 2012
be influenced as a result of viscosity change of water. Shear stress in a Newtonian fluid such as water is equal to the product of the viscosity and the time rate of strain. As the viscosity of the water decreased with temperature, the shear stress would also decrease and hence the adhesion component of friction would also decrease. At different stages of polishing (i.e., at polishing durations of 0, 240 and 480 minutes), the measured BPN values at three temperatures are plotted in Figure 8, where only HMA and water temperatures are controlled. The same type of plot is given in Figure 9,
well as changes in the viscosity of the water. Figure 7 shows the variation of friction with temperature at three different stages of polishing in which the temperatures of HMA specimen, sliding rubber pad and water are controlled. It can be seen that BPN values decrease with increasing temperature. This may be attributed to changes in the stiffness properties of not only the asphalt but also the rubber slider and also to changes in the viscosity of the water. The decrease in the hysteresis component of friction may be attributed to the decreased stiffness of rubber slider as well as asphalt at high temperatures. The adhesion component of friction may
BPN vs. Temperature at the Unpolished Stage 80
78
BPN
76
74
72
70 0
20
40
60
80
100
120
140
160
Temperature (F)
BPN vs. Temperature at the Partially Polished Stage 65
63
BPN
61
59
57
55 0
20
40
60
80
100
Temperature (F)
- 47 -
120
140
160
Temperature Effect on…
Mohammad Ali Khasawneh and Robert Y. Liang
BPN vs. Temperature at the Completely Polished Stage 59 57
BPN
55 53 51 49 47 45 0
20
40
60
80
100
120
140
160
Temperature (F)
Figure 7: BPN versus temperature at different polishing stages-pavement, rubber slider and water temperatures are controlled Pavement and Water Temperatures Effect on BPN 75
at 40 F at 75 F
70
at 140 F
BPN
65 60 55 50 45 0
100
200
300
400
500
Polishing Time (min.)
Figure 8: BPN vs. polishing time at different pavement and water temperatures Pavement, Rubber Slider, and Water Temperatures Effect on BPN at 40 F at 75 F at 140 F
80 75
BPN
70 65 60 55 50 45 0
100
200
300
400
500
Polishing Time (min.)
Figure 9: BPN vs. polishing time at different pavement, rubber slider and water temperatures
- 48 -
Jordan Journal of Civil Engineering, Volume 6, No. 1, 2012
referring to the different temperatures used; in other words, 1 denotes 40o F, 2 denotes 75o F and 3 denotes 140o F. It must also be noted that all observations are made at the 0.05 significance level. The same observations can be made from Table 2 for the effect of the HMA specimen, rubber slider and water temperatures on the measured friction values at different polishing stages. It can be seen that variances are equal, means are significantly different and significant difference is observed between means of BPN at any two temperatures of the three temperature effects considered. Since the ambient temperatures may vary each time that LWST test is conducted in the field, more meaningful comparisons of SN can be made if temperature effects are accounted for. As a practical implementation of this study, an equation is proposed to relate SN obtained at a given temperature to an effective SN at a reference temperature. The authors chose to use 20° C (68° F) as the reference temperature to develop this correlation, although another temperature could be chosen as a reference temperature as well. A linear curve fit is shown in Figure 10, where BPN is taken at an intermediate (partially) polished state (after 240 minutes of polishing) that is typical of a pavement that has been in service. The value of the coefficient of determination, R2, is 0.9999. The resulting equation is as follows for the average linear curve fit of the two cases considered (i.e., when the HMA and water temperatures are controlled and when the HMA, rubber slider and water temperatures are controlled):
where the temperatures of HMA specimen, rubber slider and water are controlled. From both Figure 8 and Figure 9, it can be seen that the temperature effects on friction (or skid resistance) are the same regardless if the HMA specimen is at the unpolished stage or the fully polished stage. Furthermore, it can be seen that considering the rubber slider temperature effect in addition to HMA and water temperature effects did not significantly change the trend. Although rubber slider is a viscoelastic material that is sensitive to temperature, consideration of its temperature effect is not warranted. Also, it is noted that the same trend, initial drop in the BPN followed by nearly constant values, holds correct at all considered temperatures as shown in Figures 8 and 9. Table 1 provides a summary of statistical analyses performed to evaluate the effect of HMA and water temperatures on the measured friction values at three polishing stages. These statistical analyses include homogeneity of variances test, One-Way Analysis of Variance (ANOVA) and Post Hoc tests, using SPSS 15.0.1 WINDOWS based program. Levene's test is used to test if n samples would have equal variances (homogeneity of variance). Some statistical tests, for example, the analysis of variance, assume that variances are equal across groups or levels. The Levene's test is intended to verify the validity of that assumption. OneWay ANOVA is used to compare the means of several populations. Post Hoc tests, such as Tukey, bonferroni, Duncan, Sidak, Scheffe,… etc, are used to evaluate whether the levels or groups within the factor are significantly different or not. These tests can be performed for factors with three or more levels or groups (Kutner et al., 2004). From Table 1, it can be seen that variances are not significantly different (i.e., equal variances). It is also evident from the One-Way ANOVA table that the difference between means is significant. The last observation that can be drawn from Table 1 is that the mean difference between any two groups is significant as seen from the multiple comparisons column. It must be noted that the column “Group” under “Multiple Comparisons” in Table 1 is
BPN T = 61.706 − 0.0524T ;
(1)
where T = temperature in Fahrenheit and BPNT = value of British pendulum number at temperature T. Also, one can deduce the following equation by subtracting the value of BPNT at T = 68° F:
∆BPN T = 3.5632 − 0.0524T ;
- 49 -
(2)
Temperature Effect on…
Mohammad Ali Khasawneh and Robert Y. Liang
Table 1. Test of homogeneity of variances, 1-way ANOVA table and multiple comparisons for the effect of pavement and water temperatures on BPN Homogeneity of 1-Way ANOVA Multiple Comparisons Polishing Variances Table Variable Stage Levene's Significancea F Significancea Group Significancea Statistic 12 0.003 13 0.000 21 0.003 Unpolished 0.372 0.704 73.1 0.000 23 0.002 31 0.000 32 0.002 12 0.002 13 0.000 21 0.002 Partially BPN 0.062 0.941 189.1 0.000 Polished 23 0.000 31 0.000 32 0.000 12 0.035 13 0.000 21 0.035 Completely 0.160 0.855 81.5 0.000 Polished 23 0.000 31 0.000 32 0.000 a. The difference is significant at the 0.05 level.
Pavement and water temperatures Pavement, rubber slider, and water temperatures Average Linear (Pavement and water temperatures) Linear (Pavement, rubber slider, and water temperatures) Linear (Average)
BPN vs. Temperature 61 60
y = -0.0524x + 61.706 2
R = 0.9999
59
y = -0.042x + 62.069
BPN
58
2
R = 0.9951
57 56
y = -0.0629x + 61.343
55
2
R = 0.9989 54 53 52 0
20
40
60
80
100
Temperature (F)
Figure 10: BPN vs. temperature
- 50 -
120
140
160
Jordan Journal of Civil Engineering, Volume 6, No. 1, 2012
Table 2. Test of homogeneity of variances, 1-way ANOVA table and multiple comparisons for the effect of pavement, rubber slider and water temperatures on BPN
Variable
BPN
Polishing Stage
Homogeneity of Variances Levene's Significancea Statistic
1-Way ANOVA Table F
Significancea
Unpolished
1.798
0.244
64.7
0.000
Partially Polished
0.306
0.747
64.3
0.000
Completely Polished
0.886
0.460
81.4
0.000
Multiple Comparisons Group
Significancea
12 13 21 23 31 32 12 13 21 23 31 32 12 13 21 23 31 32
0.001 0.000 0.001 0.014 0.000 0.014 0.008 0.000 0.008 0.001 0.000 0.001 0.000 0.000 0.000 0.048 0.000 0.048
a. The difference is significant at the 0.05 level.
Skid resistnace factor to be added to correct to T = 68 F
5 4
SN correction factors BPN correction factors
3 2 1 0 0
20
40
60
80
100
120
140
-1 -2 -3 -4
Temperature (F)
Figure 11: Correction factors for the temperature effect
- 51 -
160
Temperature Effect on…
Mohammad Ali Khasawneh and Robert Y. Liang
where ∆BPNT = number to be added to the BPN reading at T = 68° F. Correlations between skid number and BPN are available in literature. The authors use the following equation developed by Kissoff (1988) as an illustration: SN = 0.862 ( BPN ) − 9.69 . (3) Therefore, equation 2 could be converted into the following equation for correction of SN measured at a temperature different from the reference temperature of 68° F:
∆SN T = 3.0736 − 0.0452T ;
(4)
where ∆SNT = number to be added to the SN reading obtained at T=68°F. Equation 4 yields a positive number for temperatures less than 68° F and a negative number for temperatures higher than 68° F. Equation 4 can be used for comparing the SN values measured at any two temperatures. The skid measurements at these temperatures could be converted into predicted SN at the reference temperature of 68° F by subtracting ∆SNT from them. A convenient chart is given in Figure 11 to provide the skid resistance correction values to be added to the friction measurements to correct to 68° F. It must be noted that the figure is based on the average linear curve REFERENCES American Society for Testing and Materials. 2005. Measuring Surface Friction Properties Using the British Pendulum Tester. ASTM Standard Test Method E-303-93 (2003), Book of ASTM Standards, Volume 04.03, Philadelphia, PA, USA. American Society for Testing and Materials. 2005. Skid Resistance of Paved Surfaces Using a Full-Scale Tire. ASMT Standard Test Method E-274-97, Book of ASTM Standards, Volume 04.03, Philadelphia, PA, USA. Bazlamit, S. M. and Reza, F. 2005. Changes in Asphalt Pavement Friction Components and Adjustment of Skid Number for Temperature. Journal of
- 52 -
fit that was used in deriving equation 4. CONCLUSIONS The main conclusion of this paper is that the effect of HMA pavement, rubber slider and water temperatures on the measured HMA frictional properties was found to be statistically significant at the 0.05 significance level. Basically, there was a decrease in friction corresponding to an increase in temperature. This decrease in friction with increasing temperature may be attributed to changes in the stiffness properties of the asphalt and the rubber as well as changes in the viscosity of the water. If an agency desires to report skid number in reference to a referenced temperature (say 68° F) for the purpose of consistent data reporting, this paper presents equations to relate SN or BPN obtained at a given temperature to that at the referenced temperature. In this way, a more consistent record of SN at the reference temperature of 68° F, without the influence of shortterm seasonal temperature changes, can be made. In the long run, this consistent record of SN at the referenced temperature would give more clarity as to the effect of long-term skid resistance changes due to traffic wear and polishing effects.
Transportation Engineering, ASCE, 131 (6): 470-476. Burchett, J.L. and Rizenbergs, R. L. 1980. Seasonal Variations in the Skid Resistance of Pavements in Kentucky. In: Transportation Research Record: Journal of the Transportation Research Board, No. 788, TRB, National Research Council, Washington, D.C., USA. Chelliah, T., Stephanos, P., Shah, M. G. and Smith, T. 2003. Developing a Design Policy to Improve Pavement Surface Characteristics. CD-ROM. Transportation Research Board, National Research Council, Washington, D.C., USA. Dahir, S.H., Henry, J.J. and Meyer, W. E. 1979. Final Report: Seasonal Skid Resistance Variations. Pennsylvania Department of Transportation (PENNDOT), Harrisburg, Pennsylvania, USA.
Jordan Journal of Civil Engineering, Volume 6, No. 1, 2012
Elkin, B. L., Kercher, K. J. and Gulen, S. 1980. Seasonal Variation in Skid Resistance of Bituminous Surfaces in Indiana. In: Transportation Research Record: Journal of the Transportation Research Board, No. 777, 50-58, TRB, National Research Council, Washington, D.C., USA. Flintsch, G. W., Luo, Y. and Al-Qadi, I. L. 2005. Analysis of the Effect of Pavement Temperature on the Frictional Properties of Flexible Pavement Surfaces. CD-ROM. Transportation Research Board, National Research Council, Washington, D.C., USA. Hill, B. J. and Henry, J. J. 1978. Short-Term, WeatherRelated Skid Resistance Variation. In: Transportation Research Record: Journal of the Transportation Research Board, No. 836, 76-81, TRB, National Research Council, Washington, D.C., USA. Janoo, V. C. and Korhonen, C. 1999. Performance Testing of Hot-Mix Asphalt Aggregates. Special Report 99-20, US Army Corps of Engineers, Cold Regions Research and Engineering Laboratory, USA. Kissoff, N. V. 1988. Investigation of Regional Differences in Ohio Pavement Skid Resistance through Simulation Modeling. PhD Dissertation, University of Toledo, Toledo, OH, USA. Kummer, H.W. 1966. Unified Theory of Rubber and Tire Friction. Pennsylvania State University College of
Engineering, University Park, Pennsylvania, USA. Kutner, M. H., Nachtsheim, C. J. and Neter, J. 2004. Applied Linear Regression Models. McGraw-Hill Irwin, Boston, MA. Liang, R. Y., Khasawneh, M. A. and Taamneh, M. 2010. Accelerated Laboratory Polishing Device for Hot Mix Asphalt, GeoShanghai International Conference, Shanghai, China. Luo, Y. 2003. Effect of Pavement Temperature on Frictional Properties of Hot-Mix-Asphalt Pavement Surfaces at the Virginia Smart Road. Virginia Polytechnic Institute and State University, MSc Thesis, Blacksburg, Virginia, USA. Mitchell, J. C., Phillips, M. I. and Shah, G. N. 1986. Report No. FHWA/MD-86/02: Seasonal Variation of Friction Numbers. Maryland Department of Transportation (MDOT), Baltimore, MD, USA. Runkle, S. N. and Mahone, D. C. 1980. Variation in Skid Resistance over Time. Virginia Highway and Transportation Research Council, 10-13, Virginia, USA. Wang, H. and Flintsch, G. W. 2007. Investigation of Shortand Long-Term Variations of Pavement Surface Characteristics at the Virginia Smart Road. CD-ROM. Transportation Research Board, National Research Council, Washington, D.C., USA.
- 53 -