MARINE ECOLOGY PROGRESS SERIES Mar Ecol Prog Ser
Vol. 476: 215–226, 2013 doi: 10.3354/meps10118
Published February 27
Temperature effect on growth and larval duration of plaice Pleuronectes platessa in three regions of the Northeast Atlantic Stephen Comerford1,*, Deirdre Brophy1, Clive J. Fox 2, Natasha Taylor 3, Henk W. van der Veer4, Richard D. M. Nash5, Audrey J. Geffen6 1
Commercial Fisheries Research Group, Galway-Mayo Institute of Technology, Galway, Ireland 2 Scottish Association for Marine Science, Scottish Marine Institute, Oban PA371QA, UK 3 Cefas, Pakefield Road, Lowestoft, Suffolk NR33 OHT, UK 4 Royal Netherlands Institute for Sea Research (NIOZ), PO Box 59, 1790 AB Den Burg, Texel, The Netherlands 5 Institute of Marine Research, PO Box 1870 Nordnes, Bergen 5817, Norway 6 Department of Biology, University of Bergen, PB 7803, Bergen 5020, Norway
ABSTRACT: Transport models for planktonic fish eggs and larvae often use temperature to drive growth because temperature data are readily available. This pragmatic approach can be criticised as too simplistic as it ignores additional factors, such as food availability and growth-rate-dependent mortality. We examined the extent to which temperature could explain the larval duration and growth variability in post-settlement plaice from the southern North Sea, Irish Sea and west of Ireland. Larval duration and individual growth were estimated from the otolith microstructure of juvenile plaice collected from nursery grounds in each region, and average sea surface temperatures were reconstructed for each region from satellite data. Hatch dates, larval duration and settlement dates all differed among the regions, reflecting the timing of spawning and the physical characteristics of each region. Models incorporating presumed temperature history and region explained 73% of variability in individual larval growth (as estimated from otolith microincrement widths), again demonstrating important differences among the regions. The results suggest that sea temperature can be used to drive growth models of plaice larvae, although allowance must then be made for inter-regional differences. However, larval duration can be estimated using a pan-regional model based on the average temperature experienced during the larval phase. KEY WORDS: Otoliths · Generalized additive models · Wadden Sea · Irish Sea · West of Ireland Resale or republication not permitted without written consent of the publisher
The early life history of many flatfish species is characterised by discrete stages separated in space and time. Adult plaice Pleuronectes platessa are widely distributed in shelf waters around Ireland, the UK and mainland Northern Europe (Simpson 1959, Nielsen 1986). Spawning occurs on the continental shelf (< 20 m water depth), from where the pelagic eggs and larvae are transported inshore. As they
arrive in shallow water, the larval fish undergo metamorphosis, settling onto the inter-tidal of sandy nursery grounds (Gibson 1997). The juveniles maintain their association with the nurseries for several years, gradually moving offshore. It is during the first 2 phases — the pelagic larval stage and the early demersal, shallow-water juvenile stage — that the strength of the year class is established (van der Veer 1986, van der Veer et al. 2000, Nash & Geffen 2000). Both biotic and abiotic processes acting during the
*Email:
[email protected]
© Inter-Research 2013 · www.int-res.com
INTRODUCTION
216
Mar Ecol Prog Ser 476: 215–226, 2013
larval stage determine the size of any cohort and its success in reaching the shore (Bannister et al. 1973, van der Veer et al. 2009). Further processes in the nursery areas serve to dampen the fluctuations in abundance, moderating the effects of variation in egg supply or larval survival (van der Veer 1986, Beverton & Iles 1992). Though the size of this moderating nursery effect seems to vary throughout the distribution range of the plaice, the importance of the larval phase to the ultimate survival of the fish on the individual, cohort and year-class levels is well established (Bannister et al. 1973, Nash & Geffen 2000, van der Veer et al. 2000). The experience of any individual larval plaice results from a complex interaction of many highly variable influences. The timing of spawning and hatching and their coincidence with water temperature, large-scale weather events affecting the hydrodynamic regime, food availability and predation pressures combine to determine whether, when and in what condition the fish reaches the nursery (Gibson 1997). Larval fish respond to temperature; in isolation from other factors, higher temperatures are correlated with faster growth rates (Blaxter 1991), although limits of thermal tolerance are encountered at the pejus temperatures, which define lower and upper aerobic thresholds (Pörtner & Farrell 2008). Faster growth rates in fish larvae have been linked to a greater ability to escape predation (Leggett & Deblois 1994) and thus greater survival (Bailey & Houde 1989). However, faster growth may come at a higher metabolic cost requiring a corresponding increase in food supply (Pörtner & Farrell 2008). Year-class strength in plaice in the southern North Sea and other nearby areas appears to be negatively correlated with sea temperature during the larval period (van der Veer & Witte 1999, Fox et al. 2000, van der Veer et al. 2009). This counter-intuitive result could be caused by several mechanisms either acting alone or in concert. First, wind patterns and thus water circulation may be atypical in colder years, enhancing settlement (Nielsen et al. 1998, van der Veer et al. 1998). However, recent modelling from the southern North Sea has not provided strong support for this mechanism (van der Veer et al. 2009). It is difficult to reach an unequivocal conclusion since the combination of conditions may mean that most of the larvae reaching the nursery grounds come from different spawning areas in different years. Secondly, predator numbers and feeding rates, both in the plankton and following settlement, may be reduced in very cold years, allowing greater survival (Nash & Geffen 2000, van der Veer et al. 2000, 2009).
In recent years, a number of coupled, biophysical individual-based models of fish egg and larval transport have been developed (North et al. 2009). Many of these models use sea temperature to drive growth and/or survival (Heath & Gallego 1998, Fox et al. 2006, 2009, Brochier et al. 2008, Bolle et al. 2009), although food availability may also be incorporated (Hinrichsen et al. 2002). As well as being much simpler than trying to measure or model prey availability and larval feeding success, models using temperature as the main biological driver are motivated by concern about the accuracy of representation of subgrid-scale processes in hydrodynamic models (North et al. 2009). The present study was designed to examine differences between the growth rates of larval plaice from different geographic locations and to assess the extent to which growth variability could be modelled using temperature alone. To this end, an analysis was conducted using archived plaice otoliths of the same year class collected during 1 yr from 3 regions: Galway Bay in the west of Ireland, the Eastern Irish Sea, and Balgzand in the Dutch Wadden Sea (southern North Sea). These regions are of interest because they are geographically distinct from each other, representing markedly differing hydrography and physical environments. The larval and juvenile phases of plaice have been the subject of study in each region to varying degrees, with indications that various early life-history strategies are employed. Otoliths, which are calcareous structures in the ears of fish that are important for hearing, balance and orientation, grow through the formation of visible layers. In normal circumstances and for most fish, 1 increment is deposited each day, and the growth rate of the otolith can be used as a proxy for somatic growth (Campana 2001). The deposition of daily increments has been confirmed for plaice larvae at temperatures > 5°C (Karakiri & von Westernhagen 1989). We used a modelling approach to describe the influence of ontogeny and temperature on growth during the pelagic phase in plaice. We hypothesised that this relationship captures most of the regional variation in growth. In addition, we examined the relationship between the length of the larval phase (pelagic stage duration), temperature and region. The timing of hatching and settlement on the nurseries, which are the points in time that bracket the larval phase, may be significant factors for the survival of young fish, and these parameters are also examined. We further hypothesised that differences in these early lifehistory parameters reflect the environmental and hydrological differences among regions and reveal
Comerford et al.: Temperature-dependent growth of plaice larvae
differing strategies employed by larval plaice throughout the study area.
MATERIALS AND METHODS Sampling Archived otoliths came from 122 juvenile plaice captured off Ireland (n = 30), the UK (n = 44) and the Netherlands (n = 48) in 2002 as part of 3 independent projects. The fish were taken from the intertidal zone at or around low water, using a variety of methods (Table 1). The various sampling methods were chosen to suit the individual projects. No attempt has been made in the present study to compare parameters from the 3 regions relating to settlement, and it is assumed that there has been no confounding influence of sampling gear on results relating to the pre-settlement phase.
Otolith analysis Sagittal otoliths were extracted and mounted on clear glass coverslips using thermoplastic resin (Crystalbond, Agar Scientific). Otoliths from the west of Ireland were polished on both sides to reveal the otolith core using an aluminium oxide slurry on a granite surfacing plate, progressing from 15 µm grit down to 3 µm grit. After grinding, the otoliths were polished using white jeweller’s rouge. Archived otoliths from the Wadden Sea (van der Veer et al. 2009) and the Irish Sea (Fox et al. 2007) had been prepared previously using similar methods.
217
Otoliths from the Wadden Sea (van der Veer et al. 2009) and the Irish Sea (Fox et al. 2007) samples had previously been read in separate studies, but all otoliths were re-read to remove any inter-reader effects. Images of the otoliths were captured by a single reader at 200 and 1000 magnification using an Olympus BX51 light microscope and QImaging Retiga 2000k camera. The images were processed and analysed using the image-analysis software ImagePro Analyser version 6.2. Distances from the centre of the core to the hatch ring and the first accessory growth centres (AG) were recorded. Individual increment widths were measured from the hatch ring to the AG providing growth-proxy data for the pelagic larval phase. To estimate the temperature experience of the larvae during the planktonic drift, estimates of post-larval duration were also required. Post-larval duration was estimated by counting increments from the first complete increment outside of the AG to the edge of the otolith. The AG was taken as representing settlement, even though it is more correctly linked to metamorphosis, and these are not necessarily simultaneous events in plaice (Geffen et al. 2007). Post-larval increments were generally clear for otoliths from the Wadden Sea and Irish Sea, but otoliths from the west of Ireland were harder to interpret as the fish were older at capture (Table 1). In these cases, at least 2 counts of post-larval duration were made on each otolith. If the coefficient of variation (CV) between them was < 5%, then an average value was taken. If not, then a third count was made, and an average was taken of the 2 closest values, again only if the CV was < 5%. If the third count failed to achieve a sufficiently low CV, the otolith was excluded from the analysis. Hatch dates were estimated by subtracting the total estimated
Table 1. Sampling information for juvenile plaice captured from intertidal nursery areas in 3 regions in 2002: Ireland, the UK and the Netherlands. Fish were taken from known nursery areas Region
Nursery area
Dutch Wadden Sea
Balgzand
Irish Sea
West of Ireland a
Sampling date
Gear
Mesh size (cod end)
Method
4 Apr
1.9 m beam trawl with 1 tickler chain
5 × 5 mm
Trawl towed by boat and outboard
Fleet Bay Beckfoot Heysham Penmaenmawr
17 May 20 May 24 May 28 May
2 m beam trawl with 4 tickler chains
10 mm stretched
Trawl deployed by hand, recovered by all terrain vehicle
Galway Bay Fanore Lahinch
26 Sep 24 Sep 24 Sep
20 × 2 m beach 12 mm seine with 1 diamond tickler chain
Tow length and speed
Source
100 m, 2.1 km h−1
van der Veer et al. (2009)
100 m, 5 km h−1
Seine deployed by 150 m, speed boat and outboard, not known recovered by hand
Available from Galway-Mayo. Institute of Technology, Galway, Ireland, via S. Comerford (unpubl.)
Fox et al. (2007)
Irish Juvenile Flatfish Surveya
Mar Ecol Prog Ser 476: 215–226, 2013
218
post-hatch age (larval duration + post-settlement duration) of the fish from the sampling date.
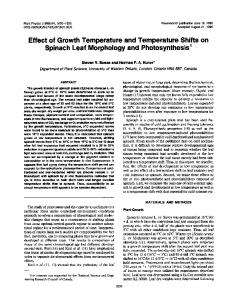
Satellite temperature data Global sea surface temperature (SST) data from the moderate resolution imaging spectroradiometer (MODIS) instrument on the Terra EOS AM satellite were downloaded from the NASA Oceancolor website and processed using the SeaWiFS data analysis system SeaDAS version 6.1. Relevant data were extracted from the global SST datasets using Quantum GIS version 1.5.0. SST data were 8 d averages, and level 3 binned daytime observations were used. Data were collected from a 0.5° latitude × 0.5° longitude grid, approximately equal to 55.5 × 55.5 km. Grid points (Fig. 1) were chosen to broadly represent the presumed larval drift pathways of plaice between spawning grounds and the nursery grounds sampled. Likely paths have been modelled for the southern North Sea (Harding et al. 1978, Talbot 1978, van der Veer et al. 2009) and the Irish Sea (Fox et al. 2006, 2009, van der Molen et al. 2007). Far less information is available for the drift of larval plaice on the west coast of Ireland. Based on the general oceanographic circulation, it was assumed that drift would be largely south to north.
Data analysis Regional differences in hatch date, larval duration (LD), settlement date and final degree-day (DD) at settlement were tested by Kruskal-Wallis tests as
the data were non-normal and heteroscedastic. Post hoc differences were tested using Mann-WhitneyWilcoxon analyses with a Bonferroni correction for multiple comparisons. The continuous predictor DD was calculated as the sum of the average daily temperature (t) across the regions shown in Fig. 1: DD = t1 + t2 + … + tn
(1)
where n is the number of days. Otolith increment width data were log transformed and modelled using generalized additive mixed models (GAMMs). Data exploration indicated that the data followed a gamma distribution after transformation; therefore, the Gamma family with a loglink function was used. Generalized additive models (GAMs) were used to examine the relationship between LD and temperature. LD data of all fish sampled were modelled on the average SST over the larval period of each fish using the Poisson distribution with a log link. The factor Region was tested for its significance within the model using the analysis of variance (ANOVA) routine. The LD data were also modelled using traditional linear regression methods to compare results with previous studies collated by Bolle et al. (2009). The GAM methods use penalized regression splines to smooth the relationship between response and predictor variables (Wood 2006). The model outputs include the term ‘effective degrees of freedom’ (edf); ranging from zero to infinity, higher values of edf imply greater non-linearity in the relationship (Zuur et al. 2009). Data were analysed using R version 2.11.1 and packages mgcv and nlme (R Development Core Team 2010).
Fig. 1. Locations (open circles) for satellite sea surface temperature data. Black circles show nursery areas where plaice samples were taken
Comerford et al.: Temperature-dependent growth of plaice larvae
Model selection Model selection was carried out using Akaike’s information criterion (AIC), with lower AIC values indicating a better model (Burnham & Anderson 2002). However, only variables significant at the p < 0.05 level were included. The suite of models applied to otolith increment-width data were GAMMs, modelling log-transformed otolith larval growth-increment widths on the SST, DD, and LD of the individual fish and region, and all candidate models were tried. Region was treated as a factor with 3 levels (Wadden Sea, Irish Sea, and west of Ireland), and Region was allowed to interact with the continuous predictor variables. Non-parametric smoothers were applied to SST, DD and LD. The smoother applied to DD described the otolith growth better than those applied to LD or SST and was therefore chosen as the best model. A mixed-effects model was necessary to account for the temporal correlation characteristic of data of this kind; therefore corAR1 temporal correlation structure was applied to the model allowing for correlation at a daily (otolith increment) level nested in each individual fish. Auto-correlation in modelling violates assumptions of independence and can lead to inflated significance (increased Type I error) and parameter estimation may also be adversely affected (Zuur et al. 2009). Traditional linear regressive methods to model data collected in a time series violate the assumption of an independent x variable. Otolith increment-growth data are an excellent example of temporally correlated data, each daily increment width being necessarily highly correlated with the one before and the one after (Chambers & Miller 1995, Butler & Folkvord 2000). Final models were checked for validity by plotting histograms of the residuals, residuals against a linear predictor, response against fitted values and deviance residuals against theoretical quantiles using the gam.check routine in mgcv. Auto-correlation function plots were generated to check for remaining auto-correlation of the modelled residuals. There was no evidence of any patterns in the plots to indicate problems with model specification, poor fit, unequal variances, missing predictors or auto-correlation, so the final models were considered robust.
219
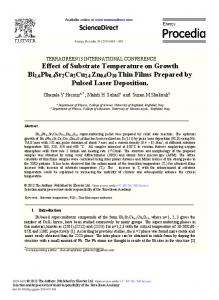
cated that each region was significantly different from the others (Mann-Whitney-Wilcoxon, p < 0.001, both parameters). The median hatch date for plaice from the Wadden Sea was 22 January, from the Irish Sea, it was >1 mo later on 6 March, and from the west of Ireland, it was even later, on 11 April. The order of median settlement dates was similar: Wadden Sea: 25 March; Irish Sea: 20 April; west of Ireland: 15 May (Figs. 2, 3 & 4). LD (Fig. 4) was significantly different among regions (Kruskal-Wallis, p < 0.001), with all regions differing from each other (Mann-Whitney-Wilcoxon, p < 0.001 in all cases). Mean (± SD) LD in the Irish Sea was 46.0 ± 6.53 d, in the west of Ireland, it was 34.1 ± 3.99 d, and in the Wadden Sea, it was 62.1 ± 6.04 d. It is important to note that fish were sampled relatively soon after settlement in the Wadden Sea (mean
Fig. 2. Hatch dates for larval plaice in the 3 regions
RESULTS Hatch dates and settlement dates showed significant differences between regions (Kruskal-Wallis, p < 0.001, both parameters). Post hoc testing indi-
Fig. 3. Settlement dates for larval plaice in the 3 regions
Mar Ecol Prog Ser 476: 215–226, 2013
220
Settlement date
Larval duration
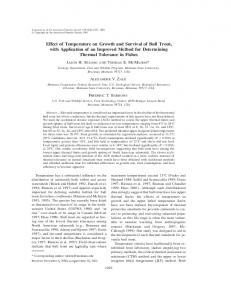
10.7 ± 0.58°C. The trend was generally upward throughout the drift 140 180 period, though all regions showed 70 some short-term decreases in tem120 160 perature, which were strongest in the Wadden Sea and Irish Sea. Wadden 100 60 Sea and Irish Sea temperatures were 140 similar to each other during the 80 period of temporal overlap, with the 50 Irish Sea being warmer on average; 120 60 the west of Ireland temperatures were considerably warmer overall. 40 There was a significant negative 40 100 relationship between LD and mean temperature during the drift period 20 80 (GAM, p < 0.001, edf = 2.72, R2(adj) = 30 0.85, N = 122), which was linear at WS IS WOI WS IS WOI WS IS WOI the lower temperatures but began to deviate from linearity at ~9°C. At Region temperatures above 10.5°C, there Fig. 4. Plaice hatch dates, settlement dates and larval stage duration (LD) by was no apparent effect of temperaregion: WS (Wadden Sea), IS (Irish Sea) and WOI (west of Ireland). Dates are ture on LD (Fig. 6). Region was a nonin ordinal days; LD is in days. Boxplots represent median, 25 to 75% significant parameter in this model interquartile range, non-outlier range and outlier points (ANOVA, p = 0.578), implying that the relationship between LD and post-larval duration 10.2 ± 4.26 d) and somewhat temperature is consistent across regions. The same later in the Irish Sea (mean post-larval duration data were also modelled using traditional linear 30.2 ± 9.97 d) but much later from the west of Ireland regression (Fig. 7). Although the GAM described the (mean post-larval duration of 135 ± 19.52 d). At the relationship between LD and temperature better time of sampling, settlement had not concluded in than the linear model, the linear parameters were the Wadden Sea (van der Veer et al. 2009) and Irish calculated for comparison with those of Bolle et al. Sea (Fox et al. 2007). (2009): Fig. 5 shows the 8 d averages of SST for the 3 This study: ln(LD) = 5.15 − 0.15(SST) (2) regions over the estimated larval period (Fig. 5). The Bolle et al.: ln(LD) = 5.00 − 0.15(SST) (3) mean overall temperatures for the regions during the periods of interest were as follows: Wadden Sea: where LD is larval stage duration, and SST is average 7.0 ± 0.24°C; Irish Sea: 8.2 ± 0.36°C; west of Ireland: sea surface temperature. These results are strikingly similar and also agree broadly with van der Veer et al. (2009), who found that the LD of plaice in the Balgzand was negatively correlated with temperature over 8 yr, though the effect was not as marked as in the present study. Although the effect of temperature on LD was regionally consistent, the combined effects of LD and temperature revealed significant variation among regions (Kruskal-Wallis, p < 0.001). Analysis of DD at settlement showed similar values for the Irish Sea and west of Ireland but higher Fig. 5. Sea surface temperature (SST; 8 d averages) during the estimated larval drift of plaice in each region values for Wadden Sea fish (Fig. 8).
Days
Ordinal days
Hatch date
Comerford et al.: Temperature-dependent growth of plaice larvae
221
Degree day
500 450 400 350 300
WS
IS
WOI
Region
Fig. 6. GAM plot showing smoothed relationship between average estimated sea surface temperature (SST) during the larval phase, and larval stage duration. Tick marks on the x-axis represent temperature data points
Fig. 8. Degree day values at settlement by region, which were significantly different overall (Kruskal-Wallis, p < 0.001). Post hoc tests indicated that the Irish Sea (IS) and west of Ireland (WOI) results were not significantly different from each other (Mann-Whitney-Wilcoxon, p = 0.798); the Wadden Sea (WS) results were significantly different from the other 2 regions (p < 0.001). Boxplots represent median, 25 to 75% interquartile range, non-outlier range and outlier points
Table 2. Results of GAMMs of plaice larval growth (response variable: natural logarithm of the otolith increment width) modelled on the smoothed predictors degree day (DD), larval duration (LD), and sea surface temperature (SST) interacting with region, a factor with 3 levels. Model validity was assessed on examination of residual plots, autocorrelation function plots and the significance of variables. Lower AIC values indicate better model fit
Fig. 7. Linear regression of log-transformed larval stage duration (in days) modelled on average SST
Individual growth, as indicated by otolith increment width, was strongly correlated with the variables LD, DD and SST. The model selection process summarised in Table 2 illustrates the improvement in the model fit (as indicated by reduced AIC values) when DD is included as a predictor variable instead of LD. AIC was even lower when SST was substituted into the model, but in this case, the model was not valid; the predictors were non-significant, residual
Predictor Predictor Correlation AIC 1 2 structure
R2 Model (adj) valid
DD LD SST DD
0.728 0.712 0.131 0.729
Region Region Region Region
corAR1 corAR1 corAR1 None
−4872.36 −4835.53 −5005.62 −539.01
Yes Yes No No
plots were poor, and the R2 value was very low (Table 2). The AIC of the model that included DD without the correlation structure was high, but the auto-correlation function plot of the model residuals showed strong auto-correlation, rendering it invalid. The following model was chosen to describe the larval growth data: ln(Otolith increment width) ≈ Region + s (DD):Region, where s denotes a non-parametric smoother applied to the continuous predictor variable, and the smoother was allowed to interact with the factor Region. DD was significant at p < 0.001 for each smoother, and the factor Region was also significant at p < 0.001. The GAM curves were non-monotonic for
Mar Ecol Prog Ser 476: 215–226, 2013
222
Fig. 9. GAM plots showing the additive effect of degree-day (DD) on log-transformed otolith increment width during the larval phase interacting with the 3 regions: Wadden Sea (p < 0.001, edf = 7.263), Irish Sea (p < 0.001, edf = 6.524), and west of Ireland (p < 0.001, edf = 5.031). Solid lines are modelled estimates; dashed lines represent Bayesian credible intervals. Increasing credible intervals towards the end of the curves reflect the variation in the age of larvae at settlement; this means there were fewer data points on the right of the x-axis. Raw otolith increment width data are shown in the lower plots. Regions were significantly different (ANOVA, p < 0.001)
all regions, and the growth-rate trend was largely positive (Fig. 9). In plaice from the Wadden Sea and Irish Sea, growth rates slowed over the first period of ~80 DD after hatching and then increased consistently until inflecting at ~350 to 400 DD. Otolith increment widths in plaice from west of Ireland increased consistently from hatching, until decreasing at around the same DD as the other 2 regions.
DISCUSSION The direct effect of temperature on the growth of fish larvae is well established (Blaxter 1991, Kielbassa et al. 2010). Karakiri & von Westernhagen (1989) also found a positive relationship between temperature and development: LD in plaice was >100 d at 5°C but 40 to 50 d at 10°C. In the same paper, they also reported an effect on growth of reduced salinity, but this is probably not as significant in the field because most of the pelagic larval phase occurs offshore (Fox et al. 2006, Bolle et al. 2009). Higher temperatures have also been shown to induce earlier metamorphosis in flounder Platichthys flesus (Hutchinson & Hawkins 2004). In general, the durations of early life-history stages of fish are shorter at higher temperatures (Pepin 1991).
DD are expected to reflect the temperature experience of a fish more accurately than using average temperatures over the planktonic phase (Neuheimer & Taggart 2007). The development of larval fish has been successfully predicted using DD in tank experiments (Weltzien et al. 1999, Malzahn et al. 2003), whilst Neuheimer & Taggart (2007) extended the concept (defined as growing DD) to field data. In the present study, the analysis illuminated the daily integration of varying ambient temperatures on otolith growth. Instantaneous larval growth was analysed by modelling individual increment widths, and the results show that DD best described this growth and was a clear improvement over age as a predictor. There were differences in the pattern of early instantaneous growth (as estimated by the proxy, otolith increment width) among the regions. In the region west of Ireland, the growth rate rose constantly from hatching, whilst in the Wadden Sea and Irish Sea, there was an initial decrease. Similar shifts in plaice larval growth have been noted in the southern North Sea (Hovenkamp & Witte 1991). In the Irish Sea and southern North Sea, a substantial portion of plaice larvae hatches into cooling waters, as temperatures typically decrease early in the year, reaching a minimum in late February to mid-March (Fig. 2; Fox et al. 2007, van der Veer et al. 2009). In
Comerford et al.: Temperature-dependent growth of plaice larvae
contrast, larvae in the region west of Ireland hatched from around Day 60 onward and into warming waters (Fig. 4). Toward the end of the larval period, the mean modelled increment widths decreased in all regions, but this was particularly prominent for the Wadden Sea fish. Wennhage & Gibson (1998) showed that the settlement behaviour of recently metamorphosed larvae was influenced by the presence of suitable prey in the sediment and the presence or absence of predators, and growth might slow if suitable conditions are not encountered. However, reduced growth rates might also result from changes in salinity as late-larval fish enter inshore waters (Karakiri & von Westernhagen 1989) or from the metabolic demands of metamorphosis (Christensen & Korsgaard 1999, Geffen et al. 2007). Metamorphosis in flatfish seems to be more related to size than age (Borski et al. 2010); for plaice, Hovenkamp & Witte (1991) reported that slow-growing and fast-growing larvae metamorphosed at similar sizes. Although plaice may be able to delay settlement for some days after they have reached a suitable size for metamorphosis (Wennhage & Gibson 1998), it is generally considered that this ability is limited and that fish which do not reach suitable nursery grounds relatively quickly will be lost from the population (Fox et al. 2006). Although the DD values at settlement showed little difference between the west of Ireland and the Irish Sea, they were considerably higher for Wadden Sea fish. The extended LD of the Wadden Sea fish and the longer period between peak growth and settlement, compared with the other regions, may explain this. In the Irish Sea, spawning and nursery grounds are in close proximity. The initial transport of the eggs and larvae is largely wind-forced, but tidally synchronised vertical migration of older larvae seems to be required to concentrate settling fish into known inshore nursery grounds (Fox et al. 2006, 2009). In contrast, spawning and nursery grounds in the southern North Sea are further apart but are connected by strong tidal streams (Harding et al. 1978, van der Veer et al. 1998, Bolle et al. 2009). The presence of vertical migration behaviour does not seem to have such a dramatic effect on larval transport, although it is still important for the immigration of late larval stages into tidal nursery grounds, such as the Wadden Sea (Bolle et al. 2009). Earlier spawning in the southern North Sea into colder waters may result in transport over longer distances because of the increased LD. Unfortunately, there is no information in the published literature about the location of plaice spawning grounds off the west coast of Ire-
223
land. Further field surveys and transport modelling are required to establish connectivity pathways between spawning and nursery grounds in this region. The fish sampled had relatively short hatch and settlement periods in the Wadden Sea, and these took place earlier in the year than in the other 2 regions. The hatch and settlement periods were most protracted in the region west of Ireland. This is likely to be an artefact of the time elapsed between settlement and sampling, with the Wadden Sea fish having been sampled very shortly after settlement (and before the completion of settlement) and the West of Ireland fish not sampled until September. The sampling time of the Irish Sea fish was intermediate between those of the other 2 regions. More fish likely settled in the Wadden Sea and the Irish Sea during the longer time period after sampling took place, although these fish are not represented in the present study. Allen et al. (2008) sampled juvenile plaice on 6 occasions from mid-March to the beginning of April in Galway Bay, west of Ireland, in 2003. Using the same methods to backcalculate dates from otolith increment counts, the mean LD values were almost identical to those of the fish sampled in 2002 in the present study. However, the authors found plaice to have settled on 10 March that year, more than 1 mo earlier than the first settled fish from the present study (14 April 2002). This implies either different settlement patterns in 2002 on the west coast or that earlier-settled fish in 2002 may have suffered mortality on the nursery grounds between settlement and sampling. The recognised moderating effect of nursery-ground processes on the year-class strength of plaice (probably operating via predation) (Nash & Geffen 2000, van der Veer et al. 2000) may have influenced the west of Ireland fish, possibly removing earlier- or later-settling fish, slower or faster growers or fish with longer or shorter larval durations. By necessity, the fish analysed in the present study represent a small component of the surviving larvae spawned that sampling year. The existence of subcohorts in settling plaice is well known (Hovenkamp 1992, Allen et al. 2008, Geffen et al. 2011) and may be a confounding factor in our understanding of larval growth and mortality (Geffen et al. 2011). The timing of peak spawning in plaice has been shown to vary among years (Nash & Geffen 1999, Fox et al. 2007, van der Veer et al. 2009), and the fish sampled in the different regions in the present study had spent varying lengths of time in the nurseries prior to capture. However, the results indicate that the general relationship between growth and temperature is
224
Mar Ecol Prog Ser 476: 215–226, 2013
represented by the models even in the absence of a fully balanced sampling design. We have assumed that otolith increment widths reflect somatic growth in individual plaice larvae and that increments are deposited daily. Karakiri & von Westernhagen (1989) reared larvae at 5 and 10°C and demonstrated that both of those assumptions held at these temperatures. They also suggested that 5°C was the lower limit at which plaice larvae would grow. Hovenkamp & Witte (1991) noted this problem in relation to age determination of larvae from the southern North Sea collected in particularly cold years. However, errors arising from narrow initial increments are unlikely to be a major factor in the present study since the narrow-increment widths ranged from 0.3 to 0.8 µm in slow-growing larvae at the lowest average temperatures experienced (estimated to be 6°C in the southern North Sea). For the Wadden Sea and Irish Sea, the estimated hatch and settlement dates in the present study largely agreed with previous estimates from Fox et al. (2009) and van der Veer et al. (2009). However, a difference of ~8 d exists between LD estimates for 2002 Wadden Sea fish from van der Veer et al. (2009) and those of the present study. The Wadden Sea fish in the present study are a sub-sample of those analysed in the earlier paper, and the differences may be attributable to those fish chosen or to differences in the interpretation of otolith microstucture. Van der Veer et al. (2009) estimated the number of unclear early growth increments immediately post-hatch by dividing the distance from the hatch ring to the first clear increment by an average increment width of 0.6 µm. This was not done in the present study as increments were visible right into the hatch-ring. Considerable uncertainty and potential bias in otolith reading can occur among readers and laboratories (Campana 2001), but in the present study, all otoliths were read by a single reader, at least guaranteeing internal consistency. Even if the absolute estimates of larval age were biased in either study, comparative patterns between regions should be realistic. Our models assume that DD can be estimated from satellite data as the average over a large sea area assumed to encompass the region of larval drift. Fox et al. (2007), however, showed that there can be as much as a 4°C difference in water temperatures between inshore and offshore waters of the eastern Irish Sea at the time that plaice larvae would be in the plankton. Although otolith microchemistry can be used to re-construct temperatures (Høie et al. 2004, Shephard et al. 2007), this cannot usually be achieved for the larval stage, so we are limited to
indirect estimates of ambient thermal history. Even with the application of particle tracking models, it is usually impossible to know the exact transport history of settling fish, and this remains a key limitation for modelling (North et al. 2009). Even so, the present study serves to strengthen our understanding of the fundamental role played by temperature in the larval stage of plaice. The differences in growth patterns illustrate the variation in early life histories across regions, while the consistency of the relationship between LD and temperature is a key feature of the strategy to get larvae to the nurseries coincident with their competence to settle there. The findings indicate that future modelling work may incorporate temperature as the main driver for larval development in plaice.
Acknowledgements. The present work was funded by the Irish Research Council for Science, Engineering and Technology under the National Development Plan. Sampling on the west coast of Ireland was undertaken as part of the Annual Juvenile Flatfish Survey jointly organised by Bord Iascaigh Mhara, the Galway-Mayo Institute of Technology, the Marine Institute and Taighde Mara Teo. Particular thanks go to B. Allen for fieldwork and otolith collection. The sampling in the eastern Irish Sea was undertaken with funding from UK DEFRA (MF0423), and P. Davidson and H. Rosetti are especially thanked for their assistance with all of the original field and laboratory work. Thanks also to H. Witte (NIOZ) for sampling in the Wadden Sea.
LITERATURE CITED
➤
➤
➤
➤
Allen BM, Brophy D, McGrath D, King PA (2008) Hatching times, larval duration, settlement and larval growth of plaice (Pleuronectes platessa L.) in Galway Bay determined using otolith microstructure. Biol Environ Proc R Ir Acad B 108:127−134 Bailey KM, Houde ED (1989) Predation on eggs and larvae of marine fishes and the recruitment problem. Adv Mar Biol 25:1−83 Bannister RCA, Harding D, Lockwood SJ (1973) Larval mortality and subsequent year-class strength in the plaice (Pleuronectes platessa L.) In: Blaxter JHS (ed) The early life history of fish. Springer, Berlin, p 21−37 Beverton RJH, Iles TC (1992) Mortality rates of 0-group plaice (Pleuronectes platessa L.), dab (Limanda limanda L.) and turbot (Scophthalmus maximus L.) in European waters II. Comparison of mortality rates and construction of life table for 0-group plaice. Neth J Sea Res 29:49−59 Blaxter JHS (1991) The effect of temperature on larval fishes. Neth J Zool 42:336−357 Bolle LJ, Dickey-Collas M, van Beek JKL, Erftemeijer PLA, Witte JIJ, van der Veer HW, Rijnsdorp AD (2009) Variability in transport of fish eggs and larvae. III. Effects of hydrodynamics and larval behaviour on recruitment of plaice. Mar Ecol Prog Ser 390:195−211 Borski RJ, Luckenbach JA, Godwin J (2010) Flatfish as model research animals: metamorphosis and sex deter-
Comerford et al.: Temperature-dependent growth of plaice larvae
➤
➤ ➤
➤
➤
➤
➤
➤ ➤
➤
➤ ➤
➤
mination. In: Daniels HV, Watanabe WO (eds) Practical flatfish culture and stock enhancement. Wiley-Blackwell, Ames, IA, p 286−302 Brochier T, Ramzi A, Lett C, Machu E, Berraho A, Fréon P, Hernández-León S (2008) Modelling sardine and anchovy ichthyoplankton transport in the Canary Current System. J Plankton Res 30:1133−1146 Burnham KP, Anderson DR (2002) Model selection and multimodel inference: a practical information-theoretic approach, 2nd edn. Springer, New York, NY Butler JL, Folkvord A (2000) Section 2: estimation of fish age and growth. Fish Res 46:51−52 Campana SE (2001) Accuracy, precision and quality control in age determination, including a review of the use and abuse of age validation methods. J Fish Biol 59:197−242 Chambers RC, Miller TJ (1995) Evaluating fish growth by means of otolith increment analysis: special properties of individual-level longitudinal data. In: Secor DH, Dean JM, Campana SE (eds) Recent developments in fish otolith research. University of South Carolina Press, Columbia, SC, p 155−174 Christensen MN, Korsgaard B (1999) Protein metabolism, growth and pigmentation patterns during metamorphosis of plaice (Pleuronectes platessa) larvae. J Exp Mar Biol Ecol 237:225−241 Fox CJ, Planque B, Darby CD (2000) Synchrony in the recruitment time-series of plaice (Pleuronectes platessa L.) around the United Kingdom and the influence of sea temperature. J Sea Res 44:159−168 Fox CJ, McCloughrie P, Young EF, Nash RDM (2006) The importance of individual behaviour for successful settlement of juvenile plaice (Pleuronectes platessa L.): a modelling and field study in the eastern Irish Sea. Fish Oceanogr 15:301−313 Fox CJ, Geffen AJ, Taylor N, Davison P, Rosetti H, Nash RDM (2007) Birth-date selection in early life stages of plaice Pleuronectes platessa in the eastern Irish Sea (British Isles). Mar Ecol Prog Ser 345:255−269 Fox CJ, McCloghrie P, Nash RDM (2009) Potential transport of plaice eggs and larvae between two apparently selfcontained populations in the Irish Sea. Fish Oceanogr 81: 381−389 Geffen AJ, van der Veer HW, Nash RDM (2007) The cost of metamorphosis in flatfishes. J Sea Res 58:35−45 Geffen AJ, Nash RDM, Dau K, Harwood AJP (2011) Subcohort dynamics of 0-group plaice, Pleuronectes platessa L., in the Northern Irish Sea: settlement, growth and mortality. J Exp Mar Biol Ecol 400:108−119 Gibson RN (1997) The behaviour and distribution of flatfishes. J Sea Res 37:241−256 Harding D, Nichols JH, Tungate DS (1978) The spawning of plaice (Pleuronectes platessa L.) in the southern North Sea and English Channel. Rapp Cons Int Explor Mer 172: 102−113 Heath MR, Gallego A (1998) Bio-physical modelling of the early life stages of haddock, Melanogrammus aeglefinus, in the North Sea. Fish Oceanogr 7:110−125 Hinrichsen HH, Möllman C, Voss R, Köster FW, Kornilovs G (2002) Biophysical modelling of larval Baltic cod (Gadus morhua) growth and survival. Can J Fish Aquat Sci 59: 1858−1873 Høie H, Otterlei E, Folkvord A (2004) Temperature-dependent fractionation of stable oxygen isotopes in otoliths of juvenile cod (Gadus morhua L.). ICES J Mar Sci 61: 243−251
225
➤ Hovenkamp F (1992) Growth-dependent mortality of larval ➤
➤
➤
➤ ➤
➤
➤
➤
➤
➤
➤
➤
plaice Pleuronectes platessa in the North Sea. Mar Ecol Prog Ser 82:95−101 Hovenkamp F, Witte JIJ (1991) Growth, otolith growth and RNA/DNA ratios of larval plaice Pleuronectes platessa in the North Sea 1987 to 1989. Mar Ecol Prog Ser 70: 105−116 Hutchinson S, Hawkins LE (2004) The relationship between temperature and the size and age of larvae and perimetamorphic stages of Pleuronectes flesus. J Fish Biol 65: 448−459 Karakiri M, von Westernhagen H (1989) Daily growth patterns in otoliths of larval and juvenile plaice (Pleuronectes platessa L.): influence of temperature, salinity, and light conditions. Rapp Cons Int Explor Mer 191: 376−382 Kielbassa J, Delignette-Muller ML, Pont D, Charles S (2010) Application of a temperature-dependent von Bertalanffy growth model to bullhead (Cottus gobio). Ecol Model 221:2475−2481 Leggett WC, Deblois E (1994) Recruitment in marine fishes: is it regulated by starvation and predation in the egg and larval stages? Neth J Sea Res 32:119−134 Malzahn AM, Clemmesen C, Rosenthal H (2003) Temperature effects on growth and nucleic acids in laboratoryreared larval coregonid fish. Mar Ecol Prog Ser 259: 285−293 Nash RDM, Geffen AJ (1999) Variability in Stage 1 egg production and settlement of plaice Pleuronectes platessa on the west side of the Isle of Man, Irish Sea. Mar Ecol Prog Ser 189:241−250 Nash RDM, Geffen AJ (2000) The influence of nursery ground processes in the determination of year-class strength in juvenile plaice Pleuronectes platessa L. in Port Erin Bay, Irish Sea. J Sea Res 44:101−110 Neuheimer AB, Taggart CT (2007) The growing degree-day and fish size-at-age: the overlooked metric. Can J Fish Aquat Sci 64:375−385 Nielsen JG (1986) Pleuronectidae. In: Whitehead PJP, Bauchot ML, Hureau JC, Nielsen JG, Tortonese E (eds) Fishes of the north-eastern Atlantic and the Mediterranean. UNESCO, Paris, p 1305−1306 Nielsen E, Bagge O, MacKenzie BR (1998) Wind-induced transport of plaice (Pleuronectes platessa): early life-history stages in the Skagerrak-Kattegat. J Sea Res 39:11−28 North EW, Gallego A, Petitgas P (eds) (2009) Manual of recommended practices for modelling physical−biological interactions during fish early life. ICES Coop Res Rep No. 295, p 111 Pepin P (1991) Effect of temperature and size on development, mortality, and survival rates of the pelagic early life history stages of marine fish. Can J Fish Aquat Sci 48: 503−518 Pörtner HO, Farrell AP (2008) Physiology and climate change. Science 322:690−692 R Development Core Team (2010) R: a language and environment for statistical computing. R Foundation for Statistical Computing, Vienna, Austria. Available at www.R-project.org Shephard S, Trueman C, Rickaby R, Rogan E (2007) Juvenile life history of NE Atlantic orange roughy from otolith stable isotopes. Deep-Sea Res I 54:1221−1230 Simpson AC (1959) The spawning of the plaice (Pleuronectes platessa) in the North Sea. Fish Invest II Sea Fish 22:1−111
226
➤
➤
➤
➤
➤
Mar Ecol Prog Ser 476: 215–226, 2013
Talbot JW (1978) Changes in plaice larval dispersal in the last fifteen years. Rapp Cons int Explor Mer 172:114−123 van der Molen J, Rogers SI, Ellis JR, Fox CJ, McLoughrie P (2007) Dispersal patterns of the eggs and larvae of spring-spawning fish in the Irish Sea, UK. J Sea Res 58: 313−330 van der Veer HW (1986) Immigration, settlement and density-dependent mortality of a larval and early post-larval 0-group plaice (Pleuronectes platessa) population in the western Wadden Sea. Mar Ecol Prog Ser 29:223−236 van der Veer HW, Witte JIJ (1999) Year-class strength of plaice Pleuronectes platessa in the Southern Bight of the North Sea: a validation and analysis of the inverse relationship with winter seawater temperature. Mar Ecol Prog Ser 184:245−257 van der Veer HW, Ruardij P, Van den Berg AJ, Ridderinkhof H (1998) Impact of interannual variability in hydrodynamic circulation on egg and larval transport of plaice Pleuronectes platessa L. in the southern North Sea. J Sea Res 39:29−40 van der Veer HW, Geffen AJ, Witte JIJ (2000) Exceptionally Editorial responsibility: Nick Tolimieri, Seattle, Washington, USA
➤
➤
➤
strong year classes in plaice Pleuronectes platessa: are they generated during the pelagic stage only, or also in the juvenile stage? Mar Ecol Prog Ser 199:255−262 van der Veer HW, Bolle LJ, Geffen AJ, Witte JIJ (2009) Variability in transport of fish eggs and larvae. IV. Interannual variability in larval stage duration of immigrating plaice in the Dutch Wadden Sea. Mar Ecol Prog Ser 390: 213−233 Weltzien FA, Planas M, Fyhn HJ (1999) Temperature dependency of early growth of turbot (Scophthalmus maximus L.) and its implications for developmental progress. J Exp Mar Biol Ecol 242:201−210 Wennhage H, Gibson RN (1998) Influence of food supply and a potential predator (Crangon crangon) on settling behaviour of plaice (Pleuronectes platessa). J Sea Res 39: 103−112 Wood SN (2006) Generalized additive models: an introduction with R. Chapman & Hall/CRC, Boca Raton, FL Zuur AF, Ieno EN, Walker N, Savaliev AA, Smith GM (2009) Mixed effects models and extensions in ecology with R. Springer, New York, NY Submitted: May 22, 2012 Accepted: October 11, 2012 Proofs received from author(s): February 7, 2013