TEMPERATURE EFFECT ON TDR MEASUREMENT OF WATER CONTENT OF UNBOUND MATERIALS Gang Zuo1, N. Randy Rainwater2, Wesley C. Wright3, Ronald E. Yoder 4, and Eric C. Drumm5 1
Department of Civil & Environmental Engineering, University of Tennessee, Knoxville, TN 37996-2010;
[email protected] 2 Department of Civil & Environmental Engineering, University of Tennessee, Knoxville, TN 37996-2010;
[email protected] 3 Department of Agricultural and Biosystems Engineering, University of Tennessee, Knoxville, TN 37901-1071;
[email protected] 4 Department of Agricultural and Biosystems Engineering, University of Tennessee, Knoxville, TN 37901-1071;
[email protected] 5 Department of Civil & Environmental Engineering, University of Tennessee, Knoxville, TN 37996-2010;
[email protected]
ABSTRACT A seasonal monitoring program of flexible pavement performance has been performed in Tennessee since 1996, in which the water content of the subgrade is measured by Time Domain Reflectometry (TDR) probes. Five-segment probes were chosen to increase the number of measurements and volume of soil monitored. The variations of water content measured in the subgrade and the base course closely follow the temperature trends. This finding suggests the significance of temperature effects on TDR measurement. A laboratory calibration program was thus carried out to study the temperature effects on TDR measurement of volumetric water content. Temperature effects on TDR measurement are related to the energy of the signal. After correcting for temperature effects, the field TDR measurements of volumetric water content appear to track a seasonal variation.
TEMPERATURE EFFECT ON TDR MEASUREMENT OF WATER CONTENT OF UNBOUND MATERIALS Gang Zuo1, N. Randy Rainwater2, Wesley C. Wright3, Ronald E. Yoder 4, and Eric C. Drumm5 1
Department of Civil & Environmental Engineering, University of Tennessee, Knoxville, TN 37996-2010;
[email protected] 2 Department of Civil & Environmental Engineering, University of Tennessee, Knoxville, TN 37996-2010;
[email protected] 3 Department of Agricultural and Biosystems Engineering, University of Tennessee, Knoxville, TN 37901-1071;
[email protected] 4 Department of Agricultural and Biosystems Engineering, University of Tennessee, Knoxville, TN 37901-1071;
[email protected] 5 Department of Civil & Environmental Engineering, University of Tennessee, Knoxville, TN 37996-2010;
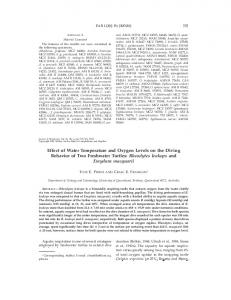
[email protected] ABSTRACT A seasonal monitoring program of flexible pavement performance has been performed in Tennessee since 1996, in which the water content of the subgrade is measured by Time Domain Reflectometry (TDR) probes. Five-segment probes were chosen to increase the number of measurements and volume of soil monitored. The variations of water content measured in the subgrade and the base course closely follow the temperature trends. This finding suggests the significance of temperature effects on TDR measurement. A laboratory calibration program was thus carried out to study the temperature effects on TDR measurement of volumetric water content. Temperature effects on TDR measurement are related to the energy of the signal. After correcting for temperature effects, the field TDR measurements of volumetric water content appear to track a seasonal variation. INTRODUCTION As part of the pavement instrumentation conducted by the Tennessee Department of Transportation (TDOT), Time Domain Reflectometry (TDR) probes were installed to measure volumetric water content (VWC) of subgrade soil and unbound aggregate at four sites in Tennessee. Moisture Point type III fivesegment TDR probes (Figure 1) produced by Environmental Sensors ® were used in the project. The length of each segment is 300 mm. The probe is made of two stainless steel plates approximately 12.7 mm wide by 3.2 mm thick, separated by 12.7 mm of high density plastic and epoxy. The Moisture Point MP-917 is used to measure signal propagation time. A pulse signal is emitted at the center of the probe, between segment 3 and segment 4. The signal then travels through segment 3 – 2 –1, and 4 – 5, respectively. Due to the signal attenuation, the propagation time measured by segment 3 and segment 4 are the most precise. Segment 2 and segment 5 propagation times are less precise than 3 and 4, while segment 1 is the least precise. Because the waveguides are separated by plastic and epoxy, part of the waveguides are in contact with plastic and epoxy, instead of soil. Thus, the measured propagation time should be corrected for this incomplete contact, before it is used to calculate volumetric water content. A linear model was
recommended by the manufacturer (Young 1995) to correct for the effect of the plastic and epoxy on the propagation time. To develop a soil specific correction, slopes and intercepts of the linear model for different segments were obtained from calibration tests on Blount County soil (Wright 1998 and Wright et al. 2001 ).
Figure 1
Moisture Point Type III Five-Segment TDR Probe (Unit: mm)
The linear model proposed by Young (1995) is TM −A B where TM = measured roundtrip propagation time; TMC = corrected roundtrip propagation time; A = time-offset correction constant; B = incomplete-contact correction constant. TMC =
(1)
Herkelrath’s (1991) equation, Equation (2), was adopted for the calculation of VWC, based on the results of the 10 models assessed by Wright et al. (2001). θV = Slope(1 / v ) + Intercept where θV = volumetric water content of soil; v = signal velocity; Slope and Intercept = constants.
(2)
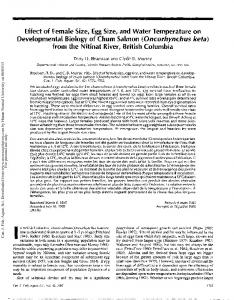
Data has been collected from four instrumented pavement sites for more than three years. Figure 2 shows the subgrade volumetric water contents measured by the TDR probe at the Blount County Site without any temperature correction. Also shown in Figure 2 is the temperature of the subgrade soil measured by thermistors at the same depth as the TDR Probe. This data is typical for all the test sites. The variation in volumetric water contents measured by segments 1, 2 and 5 of the TDR probe are surprisingly consistent with the temperature variation. A temperature correction equation was proposed by the manufacturer (Young, 1996) to account for the decrease of dielectric constant of water with increasing temperature. But the volumetric water contents measured by segments 1, 2, and 5 were opposite to this correction. This phenomenon indicates that either volumetric water content is affected by temperature or the calibration equation needs to be improved to better account for the temperature effect on the dielectric properties of the soil-water medium or on the equipment.
0.70
120 110 Seg. 2
0.60
100 Seg. 3
90 80 70
0.40
60 50 Coring Seg. 1
0.30
40
Temp.
30 0.20
20 10
0.10 0
200
400
600
800
1000
Time Since 01/01/1997 (Day) Figure 2 Volumetric Water Content and Soil Temperature of Blount County
1200
0 1400
o
0.50
Temperature ( C)
Volumetric Water Content
Seg. 4
Seg. 5
Research has shown contradictory trends in regard to the magnitude and direction of temperature effect on TDR measurement in soil (Halbertsma et al. 1995, Verstricht et al. 1994, Alvenas and Stenberg 1995, Pepin et al. 1995). The effect of temperature on the dielectric properties of soil-water medium can be different for different soils, and even for the same soil, the effect can be different at significantly different water contents. A comprehensive review on this topic can be found in the paper by Wraith and Or (1999), in which the contradictory effects of temperature on TDR measurement of soil water content were explained by the interplay of two competing phenomena: (1) the reduction in the dielectric constant of free water with increased temperature; and (2) the increase in the amount of released bound water with increased temperature. SETUP AND PROCEDURES OF LABORATORY TEST The most accurate way to determine what effect temperature has on a specific soil is to perform a calibration test with the soil. This paper describes the procedure and analysis used to determine the effect of temperature on VWC measurements using the Moisture Point Type III five-segment TDR probe. Soil was first mixed to a typical water content corresponding to that determined from gravimetric samples obtained by coring at the field sites. De-ionized water was sprayed into the air-dried soil, and it was mixed by hand as evenly as possible and the soil was then placed in a sealed container. After the moisture in the soil equilibrated for at least 24 hours, a specific mass of soil was placed into an aluminum box with inside dimensions of 6.35 cm (2.5 in.) wide by 8.9 cm (3.5 in.) high by 182.88 cm (72 in.) long. The amount of soil placed into the box was based on the dry density of the soil samples obtained by coring at the site. The TDR probe was placed in the middle layer of the soil while packing. The box was set in a steel frame, which constrained the horizontal expansion during compression, and a steel lid was placed on the soil surface. Seven C-clamps were used to compress the lid down until the depth of soil in the box was reduced to 6.35 cm (2.5 in.), so that the density in the box was similar to that of the field. The box was left in the frame with the C-clamps applied long enough to ensure that the soil did not swell significantly when the frame and clamps were removed. The loading lid was removed and three thermistors were inserted into the soil. The box was then wrapped in plastic wrap to prevent moisture loss and moved into an environmental chamber where the temperature and humidity were strictly controlled. The temperature in the environmental chamber was increased by 5 o C every 24 hours ranging from 5 o C to 40 o C , the typical temperature range in the soil subgrades at the research sites. TDR propagation time was collected by the MP-917 automatically every 30 minutes, and soil temperature which was measured by thermistors was collected by a data logger simultaneously with TDR propagation time. DATA PROCESS 1. Slopes and Intercepts of Herkelrath’s Equation The slope and intercept of Herkelrath’s equation for Blount County soil were derived by Wright et al. (2001), over a volumetric water content range of 0.05 to 0.45. A scatter plot of the data used in their derivation (Figure 3-a) suggests that there is a break point at VWC = 0.20. The slope of the volumetric water content data below 0.20 is greater than the slope above VWC = 0.20. This is consistent with the
characteristics of TDR measurement in clayey soil as discussed by Hook and Livingston (1996). Both the TDR measurement from the field and the water content obtained from field coring samples indicate that the volumetric water content of the subgrade soil at the Blount County Site is consistently higher than 0.20. Therefore, a new slope and intercept was derived from data with high water content for each segment of the five-segment probe. The newly derived slopes and intercepts are listed in Table 1 together with the slope and intercept derived by Wright et al. (2001). The new segment-specific model and the Wright’s model (2001) are compared with the data in Figure 3. Table 1
Slopes and Intercepts for the Herkelrath Equation
Wright et al. (2001) Slope Intercept
37.396 -0.193
Proposed Segment Specific 1 30.913 -0.067
2 33.558 -0.102
3 44.680 -0.258
4 39.844 -0.182
5 34.535 -0.106
2. Relationship between TDR Measurement and Temperature The segment-specific constants for the Herkelrath equation were used to determine the volumetric water content of the Blount County soil in the environmental chamber (Figure 4). The soil was maintained at VWC = 0.41. Measurements by Segment 3 and 4 show little variation with change in temperature. Segments 2 and 5 show significant increase both in the mean value and the deviation of measured volumetric water content at each temperature step as the temperature increases. Segment 1 shows even more increase in the mean value and the deviation of measured volumetric water content with increasing temperature. The following procedures were used to determine the relationship between measured volumetric water content and temperature: 1) Delete the intermediate data points collected before the temperature stabilized at each temperature step. 2) Find the median volumetric water content for each temperature. 3) Fit the medians to appropriate functions. The volumetric water content data at each temperature step is very scattered. It can be deduced that the intermediate data should also have a lot of noise. If the sampling rate were high enough, similar scattering as shown in the stabilized temperature would also be exhibited in the intermediate data. Since there were not enough data points to calculate the mean or median at each intermediate temperature, the inclusion of intermediate data in the curve fitting would only increase the error. Medians are used rather than means, because the sample size of the data at each stabilized temperature is not large enough to determine an accurate mean. Mean is more likely to be affected by extreme values than median. Medians of the measured volumetric water content at stabilized temperatures are shown in Figure 5. Linear or second order polynomials used to fit the curves are shown in the same figure. The volumetric water contents measured by segments 3 and 4 exhibit small linear decrease with increasing temperature. Measurements from segments 2 and 5 do not show a significant increase when the temperature is below 11 oC , but increase quickly as temperature rises beyond 11 oC . The equations in Figure 5 were used to adjust field measurements of volumetric water content from each segment.
0.60
0.60 Measured
Measured 0.50
Wright et al. 2001 Volumetric Water Content
Volumetric Water Content
0.50
0.40
0.30
0.20
0.10
0.00 0.000
Proposed Wright et al. 2001
0.40
0.30
0.20
0.10
0.005
0.010
0.015
0.00 0.000
0.020
0.005
0.010
1/v
(a) Wright’s Overall 0.60 Measured 0.50
Wright et al. 2001
Volumetric Water Content
Volumetric Water Content
Measured
Proposed
0.40
0.30
0.20
0.10
0.00 0.000
Proposed Wright et al. 2001
0.40
0.30
0.20
0.10
0.005
0.010
0.015
0.00 0.000
0.020
0.005
0.010
1/v
0.60 Measured
Measured
Proposed
0.50
Wright et al. 2001
Volumetric Water Content
Volumetric Water Content
0.020
(d) Segment 3
0.60
0.40
0.30
0.20
0.10
0.00 0.000
0.015
1/v
(c) Segment 2
0.50
0.020
(b) Segment 1
0.60
0.50
0.015
1/v
Proposed Wright et al. 2001
0.40
0.30
0.20
0.10
0.005
0.010
0.015
1/v
(e) Segment 4
0.020
0.00 0.000
0.005
0.010
0.015
0.020
1/v
(f) Segment 5
Figure 3 Comparison of Wright’s Model and Proposed Segment-Specific Model for Blount County Soil
0.9 0.8
Volumetric Water Content
0.7 Seg. Seg. Seg. Seg. Seg.
0.6 0.5 0.4
1 2 3 4 5
0.3 0.2 0.1 0.0 5
10
15
20
25
30
35
40
45
50
o
Temperature ( C)
Figure 4
Volumetric Water Content Meausured by TDR vs. Temperature (Lab Data of Blount County Soil)
0.65 Seg. 1 y = 0.0051x + 0.3992
Volumetric Water Content
0.60
Seg. 2 y = 6E-05x 2 - 0.0011x + 0.4536
0.55
Seg. 3 y = -0.0005x + 0.4078
0.50
Seg. 4 y = -0.0003x + 0.4537
0.45
Seg. 5
y = 6E-05x2 - 0.0002x + 0.431
0.40 0.35 0.30 0
5
10
15
20
25
30
35
40
45
Temperature (oC)
Figure 5
Volumetric Water Content Measured by TDR at Stabilized Temperature
RESULT AND DISCUSSION The different temperature dependence of each segment shown in Figure 5 reveals a possible relationship between signal energy level and the TDR measurement. The signal is emitted between segment 3 and segment 4. Energy propagated through segments 3 and 4 is the strongest. When the signal reaches segments 2 and 5, it is not as strong. By the time it reaches segment 1, much of the voltage pulse energy has dissipated. Perhaps, measured VWC tends to decrease with increasing temperature for strong signals and increase with increasing temperature for weak signals (Figure 5). This may offer some additional explanation to the contradictory effects of temperature found by various researchers. The corrected volumetric water content for each segment of the TDR probe in the subgrade of the Blount County site is shown in Figure 6. Also shown in the figure are subgrade temperature and rainfall data collected at the on-site weather station. Volumetric water contents measured by segments 3 and 4 are relatively constant for most of the time except for brief periods after high rainfall in spring and winter seasons. Segments 2 and 5 have similar characteristics as segments 3 and 4, but show some variation opposite to the temperature trends. Segment 1 shows significant variation opposite to the temperature, which makes the peaks in water content after excess rainfall in spring and winter seasons not as easily discernable as in the other four segments. However, as suggested by the lab data (Figure 4), volumetric water content measured by segment 1 is the least precise. It is very possible that the inverse relationship between VWC measurement of segment 1 and temperature are caused by over-correction. The field coring samples show that the subgrade is a little drier than saturation (Figure 6), but the volumetric water content measured by the TDR probe is always unreasonably higher than the saturation ratio (0.42) of the material, except for the measurement of segment 1 in hot dry days. Several field investigations and alternate instrumentation are planned to verify and aid in interpreting the field data in light of the temperature effect calibration study. CONCLUSION The laboratory calibration of Moisture Point Type III TDR probes using the Blount County soil demonstrate that temperature effects on TDR measurement of VWC may be dependent on the energy of the signal propagated through the probe. Therefore, any temperature correction will be dependent on the TDR probe and instrumentation design as well as soil characteristics. For instance, TDR systems with long cable lengths will likely experience a greater temperature effect than short cable lengths, due to signal attenuation. Thus, in addition to Wraith and Or’s (1999) explanation of the contradictory effects of temperature, i.e., (1) the reduction in the dielectric constant of free water with increased temperature; and (2) the increase in the amount of released bound water with increased temperature, a third explanation may be added as (3) TDR probe and instrumentation design and the resulting energy of the signal. The study of temperature effects on TDR measurements of VWC warrants additional investigation.
120
0.70 Seg. 3
110
Seg. 5 Seg. 4
0.60
Seg. 2
100
Volumetric Water Content
0.50
80 70
0.40
60 50
Seg. 1 Coring Rainfall
0.30
40
Temp.
30 0.20
20 10
0.10 0
200
400
600
800
1000
Time Since 01/01/1997 (Day)
Figure 6
Corrected Volumetric Water Content of Blout County Site Subgrade
1200
0 1400
Temperature (o C) or Rainfall (mm)
90
SUMMARY Laboratory calibration was performed to study the temperature effect on measuring the volumetric water content of soil using the Moisture Point Type III five-segment TDR probe. Temperature affected TDR measurements for each segment differently, with segments 3 and 4 showing little variation with temperature, while segment 1 shows the most significant dependence on temperature. The difference in temperature effects of TDR measurements of different segments may be attributed to the change in energy of the signal as a result of signal attenuation. Field data corrected for temperature effects reveal that rainfall during the cold season is a major source of subgrade moisture increase. REFERENCES 1. Alvenas, G., and Stenberg, M., 1995, Problems in Estimating Soil Water Content by TDR Measurements, Paper in the Proceedings of the Symposium: Time-Domain Reflectometry Applications in Soil Science (Foulum, Denmark, Sept. 16, 1994) SP Report No. 11, June, Vol. 3, 121-123. 2. Halbertsma, J., van den Elsen, E., Bohl, H., Skierucha, W., 1995, Temperature Effects on TDR Determinated Soil Water Content, Paper in the Proceedings of the Symposium: Time-Domain Reflectometry Applications in Soil Science (Foulum, Denmark, Sept. 16, 1994) SP Report No. 11, June, Vol. 3, 35-37. 3. Herkelrath, W. N., Hamburg, S. P., and Murphy, F., 1991, Automatic, Real-Time Monitoring in a Remote Field Area with Time Domain Reflectometry, Water Resources Research, 27(5), 857-864. 4. Hook, W. R. and Livingston, N. J., 1996, Errors in Converting in Time Domain Reflectometry Measurements of Propagation Velocity to Estimate Soil Water Content, Soil Science Society of America Journal, 60(1), 35-41. 5. Pepin, S., Livingston, N. J., and Hook, W. R., 1995, Temperature-Dependent Measurement Errors in Time Domain Reflectometry Determinations of Soil Water, Soil Science Society of America Journal, Vol. 59, 38-43. 6. Verstricht, J., Neerdael, B., and Volckaert, G., 1994, Clay Moisture Measurements in Radioactive Waste Disposal Research, Proceedings of the Symposium on Time Domain Reflectometry in Environmental, Infrastracture, and Mining Applications, Evanston, Illinois, Sept. 7-9, U.S. Bureau of Mines, Special Publication SP 19-94, NTIS PB95-105789, 337-348. 7. Wraith, J. M., and Or, D., 1999, Temperature Effects on Soil Bulk Dielectric Permittivity Measured by Time Domain Reflectometry: Experimental Evidence and Hypothesis Development, Water Resources Research, Vol. 35, No. 2, 361-369. 8. Wright, W. C., 1998, In Situ Water Content Measurement of Compacted Highway Subgrade Using Time Domain Reflectometry, A Thesis Presented for the Master of Science Degree, The University of Tennessee, Knoxville. 9. Wright, W. C., Yoder, R. E., Rainwater, N. R. and Drumm, E. C, 2001, Calibration of Five-Segment Time Domain Reflectometry Probes for Water Content Measurement in High Density Materials, ASTM Geotechnical Testing Journal, GTJODJ, Vol. 24, No. 2, 172-184. 10. Young, G. D., 1995, Single-Diode Probes, Moisture Point MP-917 Technical Brief 13, Environmental Sensors, Inc. San Diego, California. 11. Young, G. D., 1996, Calibration of Profiling Probes, Moisture Point MP-917 Technical Brief 17, Environmental Sensors, Inc. San Diego, California.