As a result, the developer must find all the places where the class buffer is used and then he has ..... http://msdn.microsoft.com/library/default.asp?url=/library/en-.
TEMPLATE-BASED SEMI-AUTOMATIC PROFILING OF MULTIMEDIA APPLICATIONS Christophe Poucet 1 , David Atienza 2,3 , Francky Catthoor 1 1
2
IMEC, Kapeldreef 75, B3001 Heverlee, Belgium. DACYA/UCM, Avda. Complutense s/n, 28040 Madrid, Spain. 3 LSI/EPFL 1015 Lausanne, Switzerland. F. Catthoor also professor at ESAT/K.U.Leuven-Belgium.
ABSTRACT Modern multimedia applications possess a very dynamic use of the memory hierarchy depending on the actual input, therefore requiring run-time profiling techniques to enable optimizations. Because they can contain hundreds of thousands of lines of complex objectoriented specifications, this constitutes a tedious time-consuming task since the addition of profilecode is usually performed manually. In this paper, we present a high-level library-based approach for profiling both statically and dynamically defined variables using templates in C++. Our results in the visual texture coder of the MPEG4 standard show that using the information it provides, we can easily achieve 70.56% energy savings and 19.22% memory access reduction. 1. INTRODUCTION Embedded systems have come to support very complex multimedia applications. This new set of multimedia applications puts a lot of pressure on the dynamic memory subsystem and in the processing power of the final embedded system. Therefore, memory access optimizations and optimal code generation for the underlying memory architecture become key elements to improve performance and reduce energy consumption in new consumer devices [1]. Most of these high-level optimizing transformations work directly on the source code. However, due to the dynamism of these new multimedia applications, compile-time analysis techniques are no longer able to provide the necessary information for the high-level optimization steps. Consequently, accurate profiling is necessary to collect runtime information for different representative input cases that can then be employed to define where the bottlenecks reside; thus, what has to be optimized. Typically, profiling is performed by manually adding special lines of code in the source wherever a variable that is to be profiled is read or modified. This is a very time-consuming and error-prone process, because it requires a very good understanding of how the application has been built. As a result, trying to reduce the time spent on it, or when no sources are available, designers sometimes utilize automatic profiling by including debugging information into the compiled application. Nevertheless, the profiling obtained with the latter approach is very limited and loses a large part of the highlevel view of the application. Consequently, the interactions between the variables at run-time are lost, limiting the scope of the possible optimizations that these approaches enable and the overall reachable gains as well. Work partially supported by the Spanish Government Research Grant TIN 2005-5619.
1424403677/06/$20.00 ©2006 IEEE
1061
In this paper we present a semi-automatic profiling approach based on a library of templates that allows profiling of the considered application with a global scope. Thus, it works without incurring tedious manual intervention in the source code to be profiled. Instead of adding profiling statements wherever data is being accessed, the user only needs to identify the variables that have to be profiled and change the type definition of these variables. The rest of the paper is organized as follows. In Section 2 we illustrate with a motivational example the struggling points for current methodologies. In Section 3 we present relevant related work for profiling of multimedia applications and embedded systems. In Section 4 we present our profiling library and the foundations it is based upon. In Section 5 we apply our approach to a real-life multimedia application and present how the obtained information can be easily used to optimize their memory behavior. Finally, in Section 6 we summarize our conclusions. 2. MOTIVATIONAL EXAMPLE To show the difficulties found when profiling information needs to be extracted from an application, we present a motivational example in C++ code that contains some typical struggling points. In Figure 1, a simple program containing an object-oriented buffer is represented, it illustrates the issues that occur in the real-life case study used in this paper, the Visual Texture Coder (or VTC from now on) of the MPEG4 [2] standard. It creates a buffer, fills this with some data and then uses this data by sending it to the output. These are typical phases in a multimedia application. In previous approaches, when adding profiling information to the source code, each line that modifies a variable has to increment a certain counter. In C++ this becomes more complex because references can be passed to or from the function, and it is not certain at the place where the variable is returned from the class whether it will be read or written. This can be seen in Figure 1 on line 6. This typical mechanism in C++ can lead either to a read or a write depending on how the return value is used. As a result, the developer must find all the places where the class buffer is used and then he has to manually determine whether the statement in that location is a read or a write to increment the proper counter, such as on lines 14, 16 and 19. This means that not only the source code describing the data to be profiled must be altered, but the entire application wherever this data may be used. Therefore, adding this profiling information to the source code is a time-consuming and a very error-prone task, as a place where a variable is used can easily be overseen and the compiler will give no warning. With our approach, instead of adding a statement whenever a variable is used, the type of the internal data is changed which can be based on an interactive GUI and designer selection. Typically this needs to be done in only a few limited places. In addition, if any place is missed, the compiler will automatically issue a compiler er-
ICME 2006
ror due to typing mistakes. The changes that would need to be made are given in Figure 2. Notice that the use of log int is limited to the class definition, while one would need to use LOGW and LOGR everywhere the data of that class is accessed. 1 2 3 4 5 6 7 8 9 10 11 12 13 14 15 16 17 18 19 20
struct buffer{ buffer ( size t size ) : s i z e ( s i z e ) , d a t a ( new i n t [ s i z e ] ) {} ˜ buffer () { delete [] data ; } i n t & operator [ ] ( s i z e t index ) { return d a t a [ index ] ; const s i z e t s i z e ( ) const { return s i z e ; } i n t ∗ g e t P o i n t e r ( ) { return d a t a ; } size t size ; int ∗ data ; };
}
... b u f f e r b u f p t r ( num ) ; f o r ( i n t i = 0 ; i < b u f p t r −>s i z e ( ) ; i ++) { LOGW(& b u f p t r [ i ] ) ; b u f p t r [ i ] = i ; } f o r ( i n t i = 0 ; i < b u f p t r −>s i z e ( ) ; i ++) { LOGR(& b u f p t r [ i ] ) ;LOGW(& b u f p t r [ i ] ) ; bufptr [ i ] = . . . bufptr [ i ] . . . } f o r ( i n t i = 0 ; i < b u f p t r −>s i z e ( ) ; i ++) { LOGR(& b u f p t r [ i ] ) ; . . . bufptr [ i ] . . . } ...
Fig. 1. Object-oriented buffer profiled with traditional approach 1 2 3 4 5 6 7 8 9 10 11 12 13 14 15 16 17 18 19 20
struct buffer{ t y p e d e f v a r l o g i n t ; buffer ( size t size ) : s i z e ( s i z e ) , d a t a ( new l o g i n t [ s i z e ] ) {} ˜ buffer () { delete [] data ; } l o g i n t & operator [ ] ( s i z e t index ) { return d a t a [ index ] ; } const s i z e t s i z e ( ) const { return s i z e ; } i n t ∗ g e t P o i n t e r ( ) { return d a t a ; } size t size ; log int ∗ data ; }; ... b u f f e r b u f p t r ( num ) ; f o r ( i n t i = 0 ; i < b u f p t r −>s i z e ( ) ; i ++) { bufptr [ i ] = i ; } f o r ( i n t i = 0 ; i < b u f p t r −>s i z e ( ) ; i ++) { bufptr [ i ] = . . . bufptr [ i ] . . . } f o r ( i n t i = 0 ; i < b u f p t r −>s i z e ( ) ; i ++) { . . . bufptr [ i ] . . . } ...
Fig. 2. Simple object-oriented buffer profiled with our approach 3. RELATED WORK Up until today, a lot of research has been performed in memory analysis and optimization techniques for embedded systems to reduce their power dissipation and increase performance (see surveys in [3, 4]). Traditional optimizations for embedded systems used compile-time, manifest information. The source code is completely transformed to a specific standardized form [1] such that the analysis can happen easily. For modern multimedia applications in in oo format this is no longer possible, due to their rewriting overhead. Additionally, the tools used for this analysis only allow C and can not deal with C++ code. To enable these kinds of optimizations for nonmanifest code, profiling information is necessary during the analysis phase to recognize the bottlenecks. Most profiling tools work directly on the binary application without requiring source code modifications. Tools such as gprof [5] use
1062
debugging information to find out the number of function calls and the time spent in each of these functions. However, they are not designed to provide insights for optimizations according to memory access patterns defined by the applications. More recent tools such as Valgrind [6] are also able to look at the memory accesses and use this information to provide consistency checks for the executed programs. They allow to trace on which line in the program an access occurs, but cannot give a semantical analysis of which variable it is that was actually accessed. In addition, although these tools and the previous tools do not require extra code to be added to the applications, they require a recompilation of the sources to include custom debugging information, hence requiring the source code to be present. Eventually, given that the above approaches cannot detail exactly how the profiling information depends on the concepts present in the source code, developers typically need to add profiling information by hand, which is a very time-consuming and error-prone process. While this profiling information does not provide absolute power usage numbers, it can show the number of memory accesses and this allows for a relative comparison between different optimizations of that application. There is currently no approach to profile individual data types in a C++ object-oriented application in a methodological manner. 4. LIBRARY DESCRIPTION Our profiling library has its foundations in the concept of abstract classes or templates. Templates are compile-time constructs that describe the general behavior of a class or function without having to specify the underlying type within the class. The description of the class or function is parameterized with one or more types to define a family of functions or classes. When the class template is then used, it is instantiated with the desired type, and the compiler will generate the correct instructions to deal with that type. Using the basic idea of templates, our profiling library consists of several class templates that log different information. Each of these class templates is built to be as little obtrusive as possible, thereby removing the need for manually changing a significant part of the original source code of the considered application. More precisely, the four class templates are the following ones: - var - This class template keeps track of all the memory accesses to the wrapped variable. - scope - This class template allows for control-flow logging. - MemLogger - This class template logs any memory allocation or deallocation performed through it. - allocated - This class template serves for sending allocations and deallocation requests from operators new and delete to a custom memory allocator. For logging purposes, more specifically, it is useful for sending allocation and deallocation requests to MemLogger. The above given templates can be used in different ways depending on exactly what must be logged, either a basic type variable or a pointer variable. For example, one typical use when studying memory allocator behavior is to measure how much memory is allocated when and how often it is accessed [7, 8, 9]. In this case, instead of manually checking each function call to malloc(), free(), new() or delete(), the type that is pointed to only needs to be wrapped as shown below: v a r ∗ d a t a ; The variable data is a pointer to the var template, because the data that is pointed is tracked and not the actual pointer. Through the use of MemLogger, whenever the data is allocated with new or
new[] and subsequently deallocated with delete or delete[], this information is logged to the DMMLogger with id 0. The id of the MemLogger template instantiation and surrounding var template instantiation need not be the same. In this way, the toolchain subsequently analyzes which accesses belong to which memory blocks. Typically, only one identifier is needed for all the MemLogger templates. Conceptually, the var id refers to the variable which is performing the accesses, while the MemLogger id refers to the memory allocator that allocates this memory. Then, when the accesses to the pointer need to be tracked instead of the basic type, the previous example would look as follows: v a r d a t a ; In this case, the MemLogger can be left out as a pointer itself is not allocated. The allocator used by the allocated class template from which the var class template derives then just calls the system malloc and free. As a result, current compilers would inline these calls resulting in no overhead compared to not using the allocated class template. If the pointer and the pointed data need to be tracked, then a combination of both techniques is employed: v a r d a t a ; The basic data is wrapped with the var class template which then overrides all the different operators to ensure profiling occurs. It is only necessary to change the type definition of the underlying buffer in the class buffer. Also, if a pointer to the internal buffer is passed then a compile error will occur unless a pointer to the wrapped type is given. Due to the typing rules of C++ this is guaranteed. This reduces the errors that can occur during profiling. Together with the fact that only the type definitions need to be changed, this leads to a major decrease in developer effort for adding profiling information. With a C++ parser and type-inference this could even possibly be automated. Because the the var wrapper logs the address from which is read or to which is written, and because the MemLogger logs the addresses and sizes of allocated buffers, it is possible to know to what size of allocated memory a read or write occurs. In fact, the analysis toolset will keep an active set of allocated blocks as it goes through the logfile, thereby knowing the exact conditions in which the program resided, and therefore being able to gather more detailed information. This is why it is important that the logging file is chosen before any memory is allocated. The var wrapper can wrap any basic type that can be stored in C++ (e.g. char, int, etc...), as well as pointers. Nevertheless, there is no way to wrap structures as there is no way overload the member access operator for structures ’.’. In any case, this poses no limitation to our library because within structures only the basic variables can take up memory and need to be profiled. According to our experience, such cases are very rare in multimedia applications, where data typically comes as numbers or arrays of data. 5. APPLICATION AND EXPERIMENTAL RESULTS In this section, we describe the use of our profiling toolset to consistently profile and optimize a modern real-life multimedia application, namely the VTC, which is in charge of still texture decoding. The central part of this application is the Wavelet transformer that produces an RGB-output. The application consists of around 6000 lines of complex C++ code and includes 42 dynamic variables that require profiling. In order to efficiently analyze the profiling information provided by the presented profiling library, stored in our own binary format,
1063
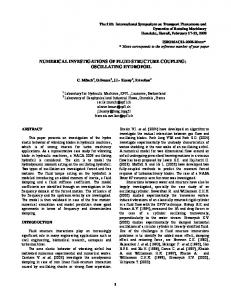
we have developed a complete toolset. This profiling analysis toolset is written in O’Caml [10] to enable a very modular and easily extensible way, and with a reasonable performance for large applications. In fact, for the processing of 1.17 GBytes of stored profiling information (equivalent to approximately 73 M log packets) for the VTC, the completion of our complete toolset only required 11 minutes. The toolset allows developers to obtain many different types of information without any additional effort. As basic information it provides the number of accesses to each of the different block sizes that are allocated. It also enumerates this information by var id, so it is possible to identify which variables put the highest strain on the memory subsystem. Then, our toolset can automatically get a time-wise graph of the different blocksizes that have been allocated in the memory management system (an example is shown in Table 1 for our real-life case study). An extra option that it also allows is the visualization of the number of reads and writes, as well as allocations and deallocations, in a scope-call tree. That way different phases of the application can be identified based on this scope-call tree and optimized, limiting the wasted effort in non-critical parts of the application under study. The scope-call tree itself is defined by the invocations of the scope template detailed in Section 4. To prove the versatility and efficiency of our proposed approach, our template-based profiling approach is illustrated in the VTC application in two ways. First, we show how designers can use the provided information for dynamic memory usage analysis, which is one of the most critical and difficult parts to refine in latest embedded systems with static analysis, due to the very irregular access patterns of each application [11]. Second, we indicate how the provided information by our approach can be used to refine the data flow and use of auxiliary variables in the application. First of all, our profiling library has been used to analyse the behaviour of this application. The time required for the analysis is only 2 hours to insert the library, and only 11 minutes to automatically obtain the required profiling reports, as described previously. First, the data types that need to be profiled are identified and then changed to be wrapped by the var template, then the source code is recompiled to allow the compiler to point us where this affects source code. Then, these reports are utilized to reduce the cost of memory allocation for the application by designing a custom dynamic memory allocator, which has taken 3 days to be implemented; Thus, less than 4 days in total. In contrast, previous traditional manual instrumentation and profiling extraction of the same application have taken at least 3 weeks according to designer input, while the final 3 additional days for the implementation of the dynamic memory allocator represent a very justified effort taking into account the gains in performance, memory footprint and energy that can be achieved compared to state-of-the-art general-purpose allocators for embedded systems that would have been used otherwise. Moreover, in case custom dynamic memory allocators are manually designed without our profiling library, more than two weeks are required on average with reallife applications to identify which are the most critical blocks sizes to optimize [11, 7]. Within this process, one of the most useful for this specific optimization is the table BlockAccesses, as can be seen in Table 1. From this information it is possible to easily understand which block sizes require the most attention in the design of the dynamic memory allocator. In fact, according to the presented analysis for the block sizes of 128, 256, 1024 and 2048 bytes, quicklists were used to speed up allocation since they account for more than 80% of the total memory request (de)allocations. After customizing the memory allocator based on the profile information, the energy consumption of the memory allocation subsystem has been decreased by 42.55% with
block-size 32 64 128 170 256 512 682 1024 2048 65536 131072 262144 524288
#allocs 16 1 873 6 1737 3465 3 7194 5643 8 6 5 2
#frees 16 1 873 6 1737 3465 3 7194 5643 8 6 5 2
#data-accs 17152 9504 166080 261630 663936 2654976 524799 14440509 26351611 1562227 1571840 3802107 2096640
max-live 16 1 39 6 71 135 3 536 1551 8 6 5 2
ter of minutes to find out where in the code each of them should be deallocated. This has saved us many hours (or even days due to the large number of dynamic variables included in the code) of manual instrumentation and debugging of the application.
Table 1. Block Accesses: typical profile information regarding the allocations and deallocations of blocks, as well as the accesses.
6. CONCLUSION In this paper we have presented a profiling library that largely alleviates the manual work needed to add profiling information to an object-oriented application. Through the use of the typing constraints of C++ in the definition of the our profiling library a lot of errors that can occur when adding profiling information (e.g. misunderstood and overlook accesses) are eliminated. Next, our extensive use of templates to do profiling enables the collection of a large range of information in a uniform and consistent way for all types of variables (both static and dynamic) in complex C++ real-life applications. This fact, together with the analysis toolset we have proposed, gives a comprehensive overview of the behaviour of the application, including the behaviour of the dynamic memory subsystem. Therefore, making use of this detailed information the developer can then apply a series of application-specific optimizations to increase performance or reduce energy consumption on an embedded platform. Finally, in this paper we have illustrated how the information provided by our proposed profiling framework can be used to design custom dynamic memory allocators for each studied application, and also to debug any possible error of its memory management. Altogether, reducing the required time for this complex process from approximately 3 weeks to 4 days with complex multimedia applications thanks to the important automation of a large part of the process. 7. REFERENCES [1] F. Catthoor et al., Data access and storage management for embedded programmable processors, Kluwer, 2002. [2] “Iso/iec jtc1/sc29/wg11 mpeg-4 standard features overview,” .
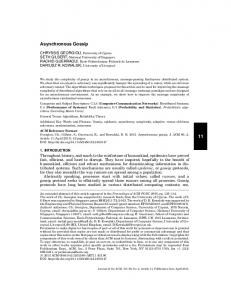
Fig. 3. Gains in energy consumption of memory accesses before and after transformations enabled by profiling information. respect to the Kingsley allocator (soft real-time allocator in Windows CE [12]), as can be seen in Figure 3 when comparing the first two columns. Second, the profiling information quickly gives us insight as to current bottlenecks in how memory is being allocated and used. Through a few simple code transformations, namely by removing auxiliary buffers, the memory accesses are reduced from 50M to 40M, i.e. an improvement of 19.22%. When the custom memory allocator is then used instead of the Kingsley allocator, a total saving of 70.56% in energy consumption can be obtained in the memory allocation subsystem, as can be seen in Figure 3 when comparing the first and the last column. It should be noted that this technique is applicable to other multimedia applications that contain many dynamically allocated data types. The presented toolset have also been used to debug several existing memory management problems in the studied application. Our analysis showed that the original code of the VTC, due to the complex integration process of all the different modules in the application and the large amount of dynamic memory variables shared between them, has originated several memory leaks and, more importantly, where they exactly occur at run-time. Thus, as a result of being able to see where the variables are being allocated and used with our proposed profiling library and toolset, it has been a mat-
1064
[3] P.R. Panda et al., “Data and memory optimizations for embedded systems,” ACM TODAES, April 2001. [4] L. Benini et al., “System level power optimization techniques and tools,” in ACM TODAES, April 2000. [5] S.L. Graham et al., “gprof: a call graph execution profiler,” in ACM SIGPLAN Symposium on Compiler Construction, 1982. [6] N. Nethercote, Dynamic Binary Analysis and Instrumentation or Building Tools is Easy, Ph.D. thesis, 2004. [7] G. Attardi et al., “A customizable memory management framework for c++,” Software Practice and Experience, 1998. [8] F. Poletti et al., “An integrated hardware/software approach for run-time scratch-management,” in Proceedings of DAC, June 2004. [9] D.A. Barret et al. , “Using lifetime predictors to improve memory allocation performance,” in ACM SIGPLAN PLDI, June 1993. [10] INRIA, “Objective caml,” 2005. in http://www.ocaml.org [11] D. Atienza et al., “Dynamic memory management design methodology for reduced memory footprint in multimedia and wireless network applications,” in Proceedings DATE, February 2004. [12] Microsoft Corporation, “Heaps in windows ce,” . http://msdn.microsoft.com/library/default.asp?url=/library/enus/wcecoreos5/html/wce50conheaps.asp